


 |
市场调查报告书
商品编码
1850996
合成石墨:市场占有率分析、产业趋势、统计数据和成长预测(2025-2030 年)Synthetic Graphite - Market Share Analysis, Industry Trends & Statistics, Growth Forecasts (2025 - 2030) |
||||||
※ 本网页内容可能与最新版本有所差异。详细情况请与我们联繫。
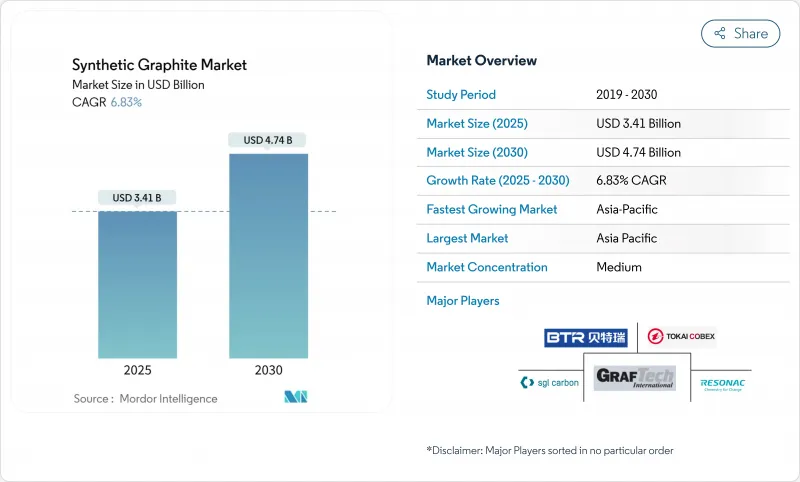
预计到 2025 年,合成石墨市场规模将达到 34.1 亿美元,到 2030 年将达到 47.4 亿美元,2025 年至 2030 年的复合年增长率为 6.83%。
高性能电动车和电网储能电池需要能够实现更快充电、更长续航里程和更稳定循环寿命的负极材料,这推动了市场需求。同时,电弧炉(EAF)炼钢企业依赖能够承受3000°C高温的石墨电极,为合成石墨市场奠定了高产量的基准。製造商也将目光投向小型模组化核子反应炉的核能级部件,从而推动特种钢材开闢新的收入来源。儘管目前的产能和终端消费量主要集中在亚太地区,但北美正在推动公共资金支持的计划,以建立国内供应链。能源转型和冶金现代化的双重拉动正在推动合成石墨市场持续扩张,即便生产商面临着不断上涨的成本上涨和脱碳压力。
全球合成石墨市场趋势与洞察
电动车需求不断成长
随着汽车製造商为满足排放气体严格的排放法规而加大电池产能,对合成石墨阳极的需求也随之飙升。这种材料具有粒径均匀、杂质含量低、循环数千次性能稳定等优点。美国能源局预测,到2035年,美国国内电池产能将成长六倍,并为此向Novonix位于田纳西州的年产能3.15万吨的工厂提供了7.54亿美元的有条件贷款。Panasonic能源公司已签署一项为期四年的北美材料采购协议,采购1万吨北美材料,以缩短供应链并减少范围3排放。能够实现4°C以上充电速率的新型电池化学体係依赖于具有客製化孔隙率的超纯合成颗粒,这重振了合成石墨市场的高端细分领域。围绕中国供应的地缘政治风险日益加剧,促使欧洲和韩国也加大了投资,从而增强了电池级材料生产的多区域增长势头。
扩大电弧炉炼钢製程在钢铁生产的应用
全球钢铁生产商正从高炉炼钢转向电弧炉炼钢,以降低生产过程中的二氧化碳排放强度,而这两种炼钢方式都依赖消耗性石墨电极。印度、越南和波湾合作理事会( GCC)等地区的资本投资项目正在新增数十座单炉炼钢能力超过150吨的电弧炉,这将确保未来十年电极需求的稳定成长。正确的处理、检验和校准仍然至关重要,因为裂缝和氧化会增加单位消耗量并降低熔炼车间的产量比率。电极供应商透过将产品与维护和咨询服务捆绑销售,在提高收入的同时增强了客户忠诚度。这种冶金现代化为合成石墨市场提供了一个稳定的长期週期,即使电池需求推动了强劲成长。
石墨生产成本高
合成石墨的价格仍接近每吨2万美元,这反映了其高能耗、高温石墨化过程(需要在3000 ℃下进行数週)。电池设计人员正在透过将天然石墨和合成石墨混合来降低负极成本,同时保持关键的倍率性能。生产商正在探索新的、低温催化剂路线,例如美国国家能源技术实验室(NETL)的煤废弃物衍生工艺,该工艺可在1500 ℃下形成紊乱层状碳,有望在未来产能方面实现更平缓的成本曲线。目前,合成石墨与天然片状石墨之间巨大的成本Delta将给中阶电池製造商带来利润压力,尤其是那些在大众市场汽车领域展开价格竞争的製造商。
细分市场分析
到2024年,冶金产业将维持49%的合成石墨市场份额,主要得益于长循环钢生产中稳定的电极消耗量。每吨电弧炉钢水消耗1.8-2.2公斤电极,确保了电极的定期更换需求。然而,电池是成长最快的应用领域,其复合年增长率高达8.39%,这主要得益于电动车和固定式储能技术的兴起。电池需求推动了对负极材料品质要求的提高,加速了合成石墨工厂在连续混合和微米级分级方面的投资。
区域分析
亚太地区将占合成石墨市场56%的份额,到2030年将以7.67%的复合年增长率增长,这主要得益于中国在2023年占全球石墨产量的77%,以及各地区电弧炉产能的扩张。然而,北京将于2023年底实施的高纯度石墨出口许可证制度加剧了供应链风险,促使韩国、日本和印度的电池製造商寻求替代货源。
北美正经历前所未有的资源共享浪潮。美国能源局向Novonix公司提供了一笔7.54亿美元的有条件贷款,用于在田纳西州建造一座年产能3.15万吨的工厂,该工厂每年可为32.5万辆电动车提供服务,从而降低对进口的依赖。同时,国家能源技术实验室也正在进行相关研发工作,利用低温将煤炭废弃物转化为电池级石墨,这显示北美正在建造一条具有成本竞争力的垂直整合供应链。
欧洲正致力于引领永续性:Vianord 在挪威的可再生能源试点生产线目前记录的排放为 1.9 kg-CO2 kg-1,目标是到 2030 年达到 1.0 kg-CO2。德国和法国正在培育木质素製碳项目,这些项目有可能引入生物基原料,分散原料风险,并加强合成石墨市场的低碳化。
其他福利:
- Excel格式的市场预测(ME)表
- 3个月的分析师支持
目录
第一章 引言
- 研究假设和市场定义
- 调查范围
第二章调查方法
第三章执行摘要
第四章 市场情势
- 市场概览
- 市场驱动因素
- 电动车需求不断成长
- 扩大电弧炉炼钢製程在钢铁生产的应用
- 适用于需要超高纯度阳极的高阶电动车的快速充电
- 亚洲、中东和非洲超高高功率电炉安装量迅速成长
- 先进模组化反应器重振了对核能级石墨的需求
- 市场限制
- 石墨生产成本高
- 天然石墨的价格差异决定了OEM阳极的混合物。
- 严格的环境法规
- 价值链分析
- 波特五力模型
- 供应商的议价能力
- 买方的议价能力
- 新进入者的威胁
- 替代品的威胁
- 竞争程度
第五章 市场规模及成长预测(价值及数量)
- 透过使用
- 电池
- 冶金
- 零件
- 核
- 其他的
- 依产品类型
- 石墨阳极
- 石墨块
- 其他类型
- 按最终用户行业划分
- 车
- 钢铁和金属
- 能源与电力
- 电子与电机工程
- 化工和石油化工
- 航太与国防
- 其他的
- 按地区
- 亚太地区
- 中国
- 印度
- 日本
- 韩国
- 印尼
- 马来西亚
- 泰国
- 越南
- 亚太其他地区
- 北美洲
- 美国
- 加拿大
- 墨西哥
- 欧洲
- 德国
- 英国
- 法国
- 义大利
- 西班牙
- 北欧国家
- 俄罗斯
- 其他欧洲地区
- 南美洲
- 巴西
- 阿根廷
- 哥伦比亚
- 中东和非洲
- 沙乌地阿拉伯
- 阿拉伯聯合大公国
- 南非
- 奈及利亚
- 埃及
- 其他中东和非洲地区
- 亚太地区
第六章 竞争情势
- 市场集中度
- 策略趋势
- 市占率分析
- 公司简介
- Anovion LLC
- Asbury Carbons
- BTR New Material Group Co., Ltd.
- GrafTech International
- Graphit Kropfmuhl GmbH
- Graphite India Limited
- HEG Limited
- Imerys
- Mersen
- Mitsubishi Chemical Group Corporation
- Nippon Carbon Co Ltd.
- NOVONIX Ltd.
- Resonac Holdings Corporation
- SGL Carbon
- Shanghai PTL New Energy Technology Co., Ltd.
- Shanghai Shanshan Technology Co., Ltd.
- Superior Graphite
- Tokai COBEX GmbH
- Vianode
第七章 市场机会与未来展望
The synthetic graphite market size is valued at USD 3.41 billion in 2025 and is forecast to reach USD 4.74 billion by 2030, reflecting a 6.83% CAGR over 2025-2030.
Demand is advancing because high-performance electric vehicles and grid storage batteries require anode materials that permit faster charging, longer range, and consistent cycle life. At the same time, electric-arc-furnace (EAF) steelmakers rely on graphite electrodes that tolerate 3,000 °C process temperatures, locking in a large volume baseline for the synthetic graphite market. Manufacturers also target small modular reactors' nuclear-grade components, pushing specialty grades into new revenue pools. Asia-Pacific dominates current production capacity and end-use consumption, while North America is mobilizing public-funded projects to build domestic supply chains. The dual pull of energy transition and metallurgical modernization keeps the synthetic graphite market expanding even though producers face cost inflation and mounting decarbonization pressure.
Global Synthetic Graphite Market Trends and Insights
Increasing Demand for Electric Vehicles
Automakers are ramping battery output to meet tightening emissions rules, driving a steep demand for synthetic graphite anodes that deliver uniform particle size, low impurity levels, and stable performance across thousands of cycles. The U.S. Department of Energy projects a six-fold increase in domestic battery capacity by 2035, a trajectory underpinning NOVONIX's 31,500 t pa Tennessee plant backed by a USD 754 million conditional loan. Panasonic Energy has already locked in a four-year off-take for 10,000 t of North American material to shorten supply lines and curb Scope 3 emissions. New cell chemistries that raise charging rates above 4C count on ultra-pure synthetic particles with tailored porosity, invigorating the premium sub-segment of the synthetic graphite market. Heightened geopolitical risk around Chinese supply is prompting parallel investments in Europe and South Korea, reinforcing multi-regional growth momentum in battery-grade output.
Growing Utilization of Electric ARC Furnace Process for Steel Production
Steelmakers worldwide are shifting away from blast furnaces to electric-arc furnaces to cut operational CO2 intensity, and each EAF relies on consumable graphite electrodes. Regional capex pipelines in India, Vietnam, and the Gulf Cooperation Council add dozens of furnaces rated above 150 t per heat, translating to steady electrode off-take over the next decade. Proper handling, inspection, and alignment remain critical because cracks or oxidation raise specific consumption rates and hinder melt shop yields. Electrode vendors are bundling maintenance advisory services, deepening customer lock-in while capturing incremental revenue. This metallurgical modernization anchors a stable, long-cycle foundation under the synthetic graphite market even as battery demand injects high-growth upside.
High Cost of Production of Graphite
Synthetic graphite prices hover near USD 20,000 t, reflecting the high-temperature graphitization step that consumes energy at 3,000 °C over several weeks. Battery cell designers have responded by blending natural and synthetic grades to cap anode cost while retaining critical rate capability. Producers are investigating new low-temperature catalytic routes such as NETL's coal-waste-derived process that forms turbostratic carbon at 1,500 °C, promising sharper cost curves for future capacity. In the interim, the steep cost delta with natural flake graphite creates margin pressure, especially for mid-tier cell makers competing on price in mass-market vehicles.
Other drivers and restraints analyzed in the detailed report include:
- Faster-Charging Premium EV Models Requiring Ultra-High-Purity Anodes
- Surge in Ultra-High-Power EAF Installations in Asia and the Middle-East and Africa
- Strict Environmental Regulations
For complete list of drivers and restraints, kindly check the Table Of Contents.
Segment Analysis
Metallurgy retained 49% of the synthetic graphite market size in 2024, underpinned by steady electrode consumption in long-cycle steel production. Each tonne of liquid steel in an EAF consumes 1.8-2.2 kg of electrodes, guaranteeing recurrent replacement demand. Yet batteries represent the fastest-growing application, posting an 8.39% CAGR outlook as EV and stationary storage installations rise. Battery demand is moving anode quality specifications higher, accelerating continuous-mixing and micron-level classification investments at synthetic graphite plants.
The Synthetic Graphite Market Report Segments the Industry by Application (Batteries, Metallurgy, and More ), Product Type (Graphite Anode, Graphite Block, and Other Types), End-User Industry (Automotive, Steel and Metals, Energy and Power, Electronics and Electrical, and More), and Geography (Asia-Pacific, North America, Europe, South America, and Middle-East and Africa).
Geography Analysis
Asia-Pacific commands 56% of the synthetic graphite market and is expanding at a 7.67% CAGR through 2030, sustained by China's 77% share of global graphite output in 2023 and regional EAF expansions. Beijing's late-2023 export licensing regime for high-purity graphite has heightened supply-chain risk, motivating South Korean, Japanese, and Indian cell makers to secure alternative sources.
North America is experiencing an unprecedented re-shoring wave. The U.S. Department of Energy's conditional USD 754 million loan to NOVONIX enables a 31,500-t pa Tennessee plant that can serve 325,000 EVs annually, reducing import reliance. Parallel research and development at the National Energy Technology Laboratory converts coal waste to battery-grade graphite at lower temperatures, hinting at a cost-competitive, vertically-integrated supply chain.
Europe focuses on sustainability leadership. Vianode's renewable-powered pilot line in Norway records emissions of 1.9 kg CO2 kg-1 today and targets 1.0 kg by 2030. Germany and France are nurturing lignin-to-carbon programs that could introduce bio-based feedstocks, diversifying raw-material risk and reinforcing the synthetic graphite market's low-carbon pivot.
- Anovion LLC
- Asbury Carbons
- BTR New Material Group Co., Ltd.
- GrafTech International
- Graphit Kropfmuhl GmbH
- Graphite India Limited
- HEG Limited
- Imerys
- Mersen
- Mitsubishi Chemical Group Corporation
- Nippon Carbon Co Ltd.
- NOVONIX Ltd.
- Resonac Holdings Corporation
- SGL Carbon
- Shanghai PTL New Energy Technology Co., Ltd.
- Shanghai Shanshan Technology Co., Ltd.
- Superior Graphite
- Tokai COBEX GmbH
- Vianode
Additional Benefits:
- The market estimate (ME) sheet in Excel format
- 3 months of analyst support
TABLE OF CONTENTS
1 Introduction
- 1.1 Study Assumptions and Market Definition
- 1.2 Scope of the Study
2 Research Methodology
3 Executive Summary
4 Market Landscape
- 4.1 Market Overview
- 4.2 Market Drivers
- 4.2.1 Increasing Demand for Electric Vehicles
- 4.2.2 Growing Utilization of Electric ARC Furnace Process for Steel Production
- 4.2.3 Faster-Charging Premium EV Models Requiring Ultra-High-Purity Anodes
- 4.2.4 Surge in Ultra-High-Power EAF Installations in Asia and Middle East Africa
- 4.2.5 Advanced Modular Reactors Reviving Nuclear-Grade Graphite Demand
- 4.3 Market Restraints
- 4.3.1 High Cost of Production of Graphite
- 4.3.2 Price Gap with Natural Graphite Driving OEM Anode Blends
- 4.3.3 Strict Environmental Regulations
- 4.4 Value Chain Analysis
- 4.5 Porter's Five Forces
- 4.5.1 Bargaining Power of Suppliers
- 4.5.2 Bargaining Power of Buyers
- 4.5.3 Threat of New Entrants
- 4.5.4 Threat of Substitutes
- 4.5.5 Degree of Competition
5 Market Size and Growth Forecasts (Value and Volume)
- 5.1 By Application
- 5.1.1 Batteries
- 5.1.2 Metallurgy
- 5.1.3 Parts and Components
- 5.1.4 Nuclear
- 5.1.5 Others
- 5.2 By Product Type
- 5.2.1 Graohite Anode
- 5.2.2 Graphite Block
- 5.2.3 Other Types
- 5.3 By End-User Industry
- 5.3.1 Automotive
- 5.3.2 Steel and Metals
- 5.3.3 Energy and Power
- 5.3.4 Electronics and Electrical
- 5.3.5 Chemical and Petrochemical
- 5.3.6 Aerospace and Defense
- 5.3.7 Others
- 5.4 By Geography
- 5.4.1 Asia-Pacific
- 5.4.1.1 China
- 5.4.1.2 India
- 5.4.1.3 Japan
- 5.4.1.4 South Korea
- 5.4.1.5 Indonesia
- 5.4.1.6 Malaysia
- 5.4.1.7 Thailand
- 5.4.1.8 Vietnam
- 5.4.1.9 Rest of Asia-Pacific
- 5.4.2 North America
- 5.4.2.1 United States
- 5.4.2.2 Canada
- 5.4.2.3 Mexico
- 5.4.3 Europe
- 5.4.3.1 Germany
- 5.4.3.2 United Kingdom
- 5.4.3.3 France
- 5.4.3.4 Italy
- 5.4.3.5 Spain
- 5.4.3.6 Nordics
- 5.4.3.7 Russia
- 5.4.3.8 Rest of Europe
- 5.4.4 South America
- 5.4.4.1 Brazil
- 5.4.4.2 Argentina
- 5.4.4.3 Colombia
- 5.4.5 Middle-East and Africa
- 5.4.5.1 Saudi Arabia
- 5.4.5.2 United Arab Emirates
- 5.4.5.3 South Africa
- 5.4.5.4 Nigeria
- 5.4.5.5 Egypt
- 5.4.5.6 Rest of Middle-East and Africa
- 5.4.1 Asia-Pacific
6 Competitive Landscape
- 6.1 Market Concentration
- 6.2 Strategic Moves
- 6.3 Market Share Analysis
- 6.4 Company Profiles (includes Global level Overview, Market level overview, Core Segments, Financials as available, Strategic Information, Market Rank/Share, Products and Services, and Recent Developments)
- 6.4.1 Anovion LLC
- 6.4.2 Asbury Carbons
- 6.4.3 BTR New Material Group Co., Ltd.
- 6.4.4 GrafTech International
- 6.4.5 Graphit Kropfmuhl GmbH
- 6.4.6 Graphite India Limited
- 6.4.7 HEG Limited
- 6.4.8 Imerys
- 6.4.9 Mersen
- 6.4.10 Mitsubishi Chemical Group Corporation
- 6.4.11 Nippon Carbon Co Ltd.
- 6.4.12 NOVONIX Ltd.
- 6.4.13 Resonac Holdings Corporation
- 6.4.14 SGL Carbon
- 6.4.15 Shanghai PTL New Energy Technology Co., Ltd.
- 6.4.16 Shanghai Shanshan Technology Co., Ltd.
- 6.4.17 Superior Graphite
- 6.4.18 Tokai COBEX GmbH
- 6.4.19 Vianode
7 Market Opportunities and Future Outlook
- 7.1 White-Space and Unmet-Need Assessment
- 7.2 Bio-graphite as a Sustainable Resource for Battery Material
 全球合成石墨市场规模、份额、趋势和成长分析报告(2026-2034)合成石墨市场规模、份额、成长及全球产业分析:按类型和应用划分,区域洞察及2026-2034年预测
 2026年全球合成石墨材料市场报告
 石墨石油焦市场按产品类型、纯度等级、应用和终端用户产业划分-2026-2032年全球预测
 合成石墨市场规模、份额及成长分析(按产品、应用、等级、最终用户及地区划分)-2026-2033年产业预测
 美国合成石墨市场规模、份额和趋势分析报告:按产品、应用和细分市场预测(2025-2033 年)合成石墨市场规模、份额、趋势分析报告:按产品、应用、地区、细分市场预测,2025-2030 年
 人造石墨市场,规模,占有率,趋势,产业分析报告:各产品,各用途,各地区,2025年~2034年的市场预测
 2025-2029年全球合成石墨市场全球合成石墨市场规模(按产品类型、最终用户产业、应用、区域范围和预测)