


 |
市场调查报告书
商品编码
1851023
商业生产力软体:市场占有率分析、产业趋势、统计数据和成长预测(2025-2030 年)Business Productivity Software - Market Share Analysis, Industry Trends & Statistics, Growth Forecasts (2025 - 2030) |
||||||
※ 本网页内容可能与最新版本有所差异。详细情况请与我们联繫。
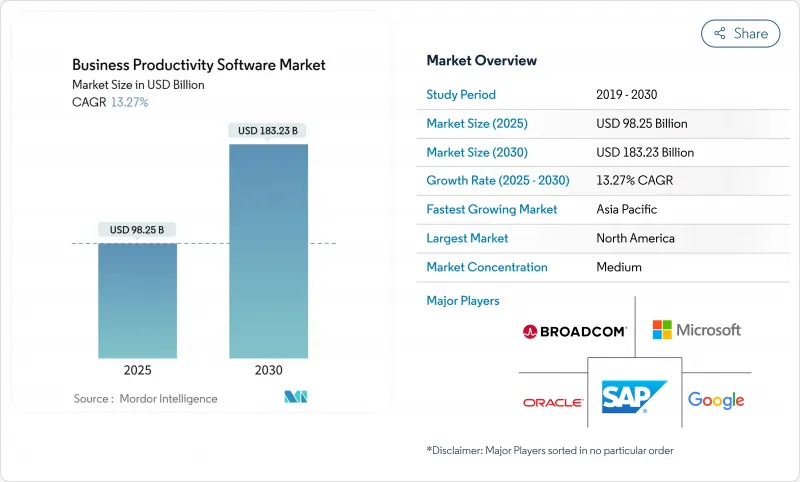
预计到 2025 年,商业生产力软体市场规模将达到 982.5 亿美元,到 2030 年将达到 1,832.3 亿美元,在预测期内将维持 13.3% 的强劲复合年增长率。
生成式人工智慧如今已成为现代生产力套件的核心。微软部署 Copilot 后,用户完成单一任务的速度提升了 75%,并为早期企业用户预测了三年内 112% 的投资报酬率。超大规模云端服务商对云端基础设施的承诺、新的混合办公模式以及更严格的资料管治法规,都在加速平台更新换代。儘管由于许多行业需要在内部管理敏感工作负载,超大规模资料中心业者部署仍然占据大部分收入,但显然,主权云端区域和按需付费的定价模式正在推动支出成长最快的趋势。平台供应商报告称,市场对内建合规自动化、区域资料驻留管理以及低程式码套件包的需求激增,这些工具包能够帮助非技术人员简化日常任务。同时,协作流量也在爆炸式增长:Microsoft Teams 的每日有效用户已超过 3 亿,企业也越来越多地将 Teams 和 Slack 结合使用,以满足团队多样化的偏好。
全球商业生产力软体市场趋势与洞察
企业应用程式采用云端优先的SaaS
企业采购模式正优先考虑云端原生服务,其应用范围已从核心 IT 扩展到财务、人力资源和营运团队。微软 Azure 预计 2024 年营收将年增 30%,而Google云端则强调 Vertex AI 的使用量激增 20 倍,这与 Workspace 的部署直接相关。那些已用标准化 SaaS 套件取代定製本地模组的组织,通常报告称总体拥有成本降低了两位数,发布週期也显着加快。日益严格的资料管治法规并未减缓此趋势。相反,服务提供者正透过区域特定实例、自动化审核追踪和客户管理的加密金钥来满足这些法规要求。因此,即使是那些曾经认为异地储存不可或缺的产业,也正在发生向云端订阅收入的显着转变。
生产力套件中嵌入的生成式人工智慧副驾驶的激增
生成式人工智慧已从实验性试点计画走向日常工作环境。微软的 Copilot 可以快速产生摘要、演示文稿,并在几秒钟内处理长篇电子邮件,从而实现前文所述的 75% 的任务时间缩减。谷Oracle则推出了基于 Gemini 的 Workspace 计划,将人工智慧功能融入基础订阅费用中,消除了大规模部署的成本障碍。 Oracle 将对话式分析功能整合到 Fusion Data Intelligence 中,让财务使用者能够以自然语言查询帐簿。随着 Copilot 等产品的日益成熟,买家在评估供应商时,不再仅仅关注其办公室套件的核心功能,而是更加重视模型透明度、管治工具以及快速工程化的便利性。
网路主权法限制跨境资料居住
各国政府正日益加强在地化强制措施,要求外国服务提供者在国内储存和处理资讯。欧盟资料法的域外适用一旦生效,可能会导緻美国数位服务出口总额下降2%。中国和印度也存在类似的框架,要求云端服务提供者建立实体上独立的设施并接受当地审核。生产力套件高度依赖即时协作和全球人工智慧模型训练,因此资料孤岛的分割会增加资本成本和营运复杂性。
细分市场分析
受金融、国防和政府等产业严格的资料位置策略推动,到2024年,本地部署的业务生产力软体将占总收入的68.4%。然而,云端订阅的成长速度在所有部署模式中位居榜首,年复合成长率高达15.0%,这主要得益于超大规模资料中心营运商不断增加专为大规模语言模型(LLM)工作负载设计的高效能GPU丛集。企业日益倾向于采用混合架构,将受保护的资料集储存在私有丛集上,同时利用云端AI进行即时转录、翻译和文件摘要。资讯长们预计,在预测期内,纯粹的本地部署规模将会缩小,因为在本地复製云端级晶片和託管机器学习工具的成本过高。
采用云端技术的次要优势包括更快的灾害復原速度,以及在季节性高峰期集中和重复使用授权的能力。供应商现在将合规性仪表板、租用户级加密管理和零信任存取控制捆绑在一起,从而缓解了先前关于主权问题的反对意见。随着更多监管框架正式确立认证云端领域,前瞻性的采购策略正在转向「云端优先」模式,将裸机部署降级为仅用于特殊情况的传统方案。
大型企业凭藉庞大的用户数量和多套件续约,在2024年贡献了70.5%的总支出。儘管如此,中小企业市场仍将维持14.7%的复合年增长率,超过所有其他客户群,并逐步蚕食现有企业以大型企业为主的收入结构。中小企业业务效率软体市场规模直接受益于按使用量收费,该模式允许团队从每月少量AI辅助功能起步,并随着投资回报率的显现而逐步扩展。
中小企业能够更快地采用尖端人工智慧技术,因为它们可以最大限度地减少历史包袱。一家零售新兴企业可以在几週内将对话式搜寻嵌入到其整个产品目录中,而一家全球零售商则必须先对平行资料湖进行调整。了解这些差异的供应商会提供用于库存核对、排班、费用核准等的承包模板,几乎无需任何配置。这种「极简管理」的概念对通常缺乏专门IT支援的中小企业极具吸引力。
商业生产力软体市场报告按部署方式(本地部署和云端部署)、组织规模(大型企业和中小企业)、最终用户行业垂直领域(银行、金融服务和保险、通讯和 IT、其他)、解决方案类型(内容、协作和文件管理、通讯和整合通讯、其他)以及地区进行细分。
区域分析
到2024年,北美将占全球收入的36.4%。深厚的云端基础设施、成熟的SaaS采购文化以及创纪录的超大规模资料中心资本支出(光是微软一家到2026年就将在人工智慧资料中心投入800亿美元)确保该地区将继续成为新技术的重要孵化器。公共部门数位现代化津贴透过津贴州和地方机构的安全协作,进一步巩固了其领先地位。随着跨境供应链专案采用共用文件工作流程平台,加拿大和墨西哥有望迎来成长。
儘管法规环境差异巨大,欧洲仍维持稳定成长。 GDPR 和欧盟资料法规促使供应商提供精细的资料可携性控制和基于位置的路由。合规成本在某些情况下会减缓云端迁移,但同时,它也推动了对专用管治模组的需求。欧洲大陆的买家也越来越关注託管在本地架构中的开放原始码基础架构和主权生命週期管理 (LLM)。
亚太地区是成长最快的地区,预计到2030年将以14.0%的复合年增长率成长。印度、印尼和菲律宾的数位化公共基础设施计画正协助数百万家中小企业接入网路。韩国企业在采用行动优先办公模式方面处于领先地位,将人工智慧转录功能整合到行动团队的通讯用户端。日本先进的机器人产业利用人工智慧驱动的电子表格脚本,将生产数据与ERP系统整合,从而减少停机时间。中国继续透过优惠采购和严格的数据出口管制来扶持国内供应商,导致市场呈现双层结构,跨国公司必须与本地云端服务供应商合作才能获得市场认可。
儘管目前南美洲的绝对投资额较低,但未来前景依然强劲。巴西政府正在投资开放银行和电子帐单标准,这些标准要求安全的文件交换,间接推动了协作套件的普及。阿根廷外汇的波动性以及与资本设备采购相关的高对冲风险,刺激了对以美国计价的SaaS的需求。最后,在中东和非洲,需求集中在沙乌地阿拉伯和阿联酋,这两个国家主导的智慧城市计画中包含了远端办公中心;以及南非-尼日利亚走廊沿线,该地区广泛的行动宽频正在推动轻量级、节省频宽的生产力应用程式的发展。
其他福利:
- Excel格式的市场预测(ME)表
- 3个月的分析师支持
目录
第一章 引言
- 研究假设和市场定义
- 调查范围
第二章调查方法
第三章执行摘要
第四章 市场情势
- 市场概览
- 市场驱动因素
- 企业应用程式采用云端优先的SaaS
- 生产力工具中嵌入的生成式人工智慧副驾驶的激增
- 全球合规标准强制要求混合工作工具
- 面向第一线员工的低程式码产业特定工作平台
- 生态系统转向基于使用量的定价模式,释放了中小企业的升级週期。
- 市场限制
- 网路主权法限制跨境资料居住
- SaaS 激增导致整合疲劳和许可证合理化
- 缺乏整合人才会减缓复杂工作流程的部署。
- 价值链分析
- 技术展望
- 波特五力分析
- 供应商的议价能力
- 买方的议价能力
- 新进入者的威胁
- 替代品的威胁
- 竞争对手之间的竞争
- 评估宏观经济趋势对市场的影响
第五章 市场规模与成长预测
- 透过部署
- 本地部署
- 云
- 按公司规模
- 大公司
- 小型企业
- 按最终用户行业划分
- BFSI
- 资讯科技/通讯
- 製造业
- 媒体、娱乐与出版
- 运输与物流
- 零售与电子商务
- 医疗保健和生命科学
- 政府/公共部门
- 其他(教育、公共产业)
- 按解决方案类型
- 内容协作和文件管理
- 通讯和整合通讯
- 计划、工作和任务管理
- 商业智慧与分析
- 低程式码/无程式码自动化
- 数位资产和创新工具
- 安全与合规附加元件
- 按地区
- 北美洲
- 美国
- 加拿大
- 墨西哥
- 欧洲
- 德国
- 英国
- 法国
- 义大利
- 西班牙
- 俄罗斯
- 其他欧洲地区
- 亚太地区
- 中国
- 日本
- 印度
- 韩国
- ASEAN
- 澳洲和纽西兰
- 亚太其他地区
- 南美洲
- 巴西
- 阿根廷
- 其他南美洲
- 中东和非洲
- 中东
- 沙乌地阿拉伯
- 阿拉伯聯合大公国
- 土耳其
- 其他中东地区
- 非洲
- 南非
- 奈及利亚
- 其他非洲地区
- 北美洲
第六章 竞争情势
- 市场集中度
- 策略趋势
- 市占率分析
- 公司简介
- Microsoft Corporation
- Google LLC
- Oracle Corporation
- SAP SE
- Salesforce Inc.
- IBM Corporation
- Broadcom Inc.(Symantec)
- VMware Inc.
- Amazon Web Services Inc.
- Atlassian Corporation
- ServiceNow Inc.
- Adobe Inc.
- Monday.com Ltd.
- Asana Inc.
- Zoho Corporation
- Citrix Systems Inc.
- Dropbox Inc.
- Smartsheet Inc.
- Slack Technologies LLC
- AppScale Systems Inc.
第七章 市场机会与未来展望
The business productivity software market stood at USD 98.25 billion in 2025 and is on track to reach USD 183.23 billion by 2030, reflecting a solid 13.3% CAGR over the forecast period.
Generative AI now sits at the core of modern productivity suites, with Microsoft recording 75% gains in individual task completion speeds after Copilot roll-outs and modelling a 112% three-year ROI for early enterprise adopters. Cloud infrastructure commitments from hyperscalers, fresh hybrid-work mandates, and stricter data-governance laws collectively accelerate platform refresh cycles. On-premise deployments still dominate revenue today because many sectors must keep sensitive workloads in-house, yet the fastest spending momentum clearly tilts toward sovereign-ready cloud regions and consumption-based pricing models. Platform vendors report a sharp rise in requests for built-in compliance automation, regional data-residency controls, and low-code toolkits that let non-technical staff streamline routine work. At the same time, collaboration traffic is exploding: Microsoft Teams has surpassed 300 million daily active users while enterprises increasingly run Teams and Slack side-by-side to satisfy diverse team preferences.
Global Business Productivity Software Market Trends and Insights
Cloud-first SaaS adoption across line-of-business apps
Enterprise buying patterns now prioritise cloud-native services, extending well beyond core IT into finance, HR, and operations teams. Microsoft Azure posted 30% year-on-year revenue growth in 2024, and Google Cloud highlighted a 20-fold jump in Vertex AI usage tied directly to Workspace deployments. Cost advantages remain compelling: organisations that replace bespoke on-premise modules with standardised SaaS suites routinely report double-digit reductions in total ownership costs and noticeably faster release cycles. Increasingly stringent data-governance statutes have not slowed momentum; instead, providers answer sovereignty demands with region-specific instances, automated audit trails, and customer-managed encryption keys. The upshot is a decisive tilt toward cloud subscription revenue even inside industries that once viewed off-prem storage as non-negotiable.
Proliferation of gen-AI copilots embedded in productivity suites
Generative AI has moved from experimental pilots to the day-to-day work fabric. Microsoft's Copilot can draft summaries, generate presentations, and ingest long e-mail threads in seconds, underpinning the 75% task-time reduction noted above. Google counters with Gemini-infused Workspace plans that wrap AI functionality into the base subscription fee, removing a cost barrier for broad roll-outs. Oracle has embedded conversational analytics inside Fusion Data Intelligence so finance users can query ledgers in plain language. As these copilots mature, buyers increasingly evaluate vendors on model transparency, governance tooling, and ease of prompt engineering rather than on core office-suite features.
Cyber-sovereignty laws restricting cross-border data residency
Governments are tightening localisation mandates that obligate foreign providers to store and process information domestically. The EU Data Act's extraterritorial reach could shave 2% off total US digital-services exports once enforcement begins. Similar frameworks in China and India require cloud operators to set up physically separate facilities and subject them to in-country audits. Productivity suites rely heavily on real-time collaboration and global AI model training, so splitting data islands drives both capital costs and operational complexity.
Other drivers and restraints analyzed in the detailed report include:
- Hybrid-work tooling mandates in global compliance standards
- Vertical-specific low-code work platforms for frontline workers
- Rising SaaS sprawl driving consolidation fatigue and licence rationalisation
For complete list of drivers and restraints, kindly check the Table Of Contents.
Segment Analysis
The business productivity software market size for on-premise installations commanded 68.4% of 2024 revenue, a share rooted in strict data-location policies inside finance, defence, and public administration. Yet cloud subscriptions are progressing at a 15.0% CAGR, the fastest of any deployment model, as hyperscalers add high-performance GPU clusters designed for large language model (LLM) workloads. Organisations increasingly select hybrid architectures, keeping protected datasets in private clusters while exploiting cloud AI for real-time transcription, translation, and document summarisation. Over the forecast window, CIOs expect purely on-premise estates to shrink because replicating cloud-grade silicon and managed ML tooling locally is uneconomical.
Cloud adoption's second-order benefits include faster disaster-recovery times and pooled license reuse during seasonal demand spikes. Vendors now bundle compliance dashboards, tenant-level encryption management, and zero-trust access controls, alleviating earlier objections around sovereignty. As more regulatory frameworks formally accept certified cloud regions, forward-looking procurement policies pivot to "cloud-preferred," relegating bare-metal installs to legacy edge cases.
Large enterprises generated 70.5% of the total 2024 spend thanks to expansive seat counts and multi-suite contract renewals. Nevertheless, the SME cohort demonstrates a 14.7% CAGR that outpaces every other customer tier, gradually eroding incumbents' enterprise-heavy revenue mix. The business productivity software market size for SMEs benefits directly from usage-linked billing, where teams can start with a handful of AI assists per month and expand as ROI becomes visible.
Smaller firms also adopt bleeding-edge AI faster because they carry minimal legacy baggage. A retail start-up can embed conversational search across its product catalogue within weeks, whereas a global retailer must reconcile parallel data lakes first. Vendors attuned to these differences now ship turnkey templates-inventory reconciliations, shift scheduling, expense approvals-that require almost no configuration. This "minimal-admin" ethos appeals to SMEs that often lack dedicated IT support.
The Business Productivity Software Market Report is Segmented by Deployment (On-Premise and Cloud), Organization Size (Large Enterprises and Small and Medium Enterprises), End-User Industry (BFSI, Telecommunications and IT, and More), Solution Type (Content Collaboration and Document Management, Communication and Unified Communications, and More), and Geography.
Geography Analysis
North America generated 36.4% of global revenue in 2024. Deep cloud-infrastructure footprints, a mature SaaS procurement culture, and record hyperscaler capex-Microsoft alone is funnelling USD 80 billion into AI datacentres through 2026-ensure the region remains the primary launchpad for new functionality. Public-sector digital-modernisation grants further widen the lead by subsidising secure collaboration for state and local agencies. Canada and Mexico contribute incremental upside as cross-border supply-chain programmes standardise on shared document-workflow platforms.
Europe maintains steady growth under a vastly different regulatory climate. GDPR and the EU Data Act together push vendors to provide granular data-portability controls and location-based routing. While compliance overhead slows some cloud migrations, it simultaneously catalyses demand for purpose-built governance modules. Continental buyers also show heightened interest in open-source underpinnings and sovereign LLMs housed in local facilities.
Asia-Pacific is the fastest-rising territory, projected at a 14.0% CAGR through 2030 as digital-public-infrastructure initiatives across India, Indonesia, and the Philippines bring millions of new small businesses online. Korean organisations spearhead mobile-first workplace adoption, embedding AI transcription inside messaging clients for on-the-move teams. Japan's advanced robotics sector uses AI-enhanced spreadsheet scripts to blend production data with ERP systems, trimming downtime. China continues to encourage domestic vendors through preferential procurement and strict data-export rules, resulting in a dual-track market where multinationals must partner with local cloud operators to gain traction.
South America registers lower absolute spend today, but has a robust runway. Brazil's government is investing in open banking and e-invoicing standards that mandate secure document exchange, indirectly spurring collaboration-suite deployments. Argentina's currency volatility increases the appetite for SaaS denominated in US dollars because capital equipment buys carry higher hedging risk. Finally, the Middle East and Africa cluster demand around Saudi Arabia and the UAE, where state-sponsored smart-city plans incorporate remote-working hubs, and around South Africa-Nigeria corridors, where mobile broadband growth encourages lightweight, bandwidth-frugal productivity apps.
- Microsoft Corporation
- Google LLC
- Oracle Corporation
- SAP SE
- Salesforce Inc.
- IBM Corporation
- Broadcom Inc. (Symantec)
- VMware Inc.
- Amazon Web Services Inc.
- Atlassian Corporation
- ServiceNow Inc.
- Adobe Inc.
- Monday.com Ltd.
- Asana Inc.
- Zoho Corporation
- Citrix Systems Inc.
- Dropbox Inc.
- Smartsheet Inc.
- Slack Technologies LLC
- AppScale Systems Inc.
Additional Benefits:
- The market estimate (ME) sheet in Excel format
- 3 months of analyst support
TABLE OF CONTENTS
1 INTRODUCTION
- 1.1 Study Assumptions and Market Definition
- 1.2 Scope of the Study
2 RESEARCH METHODOLOGY
3 EXECUTIVE SUMMARY
4 MARKET LANDSCAPE
- 4.1 Market Overview
- 4.2 Market Drivers
- 4.2.1 Cloud-first SaaS adoption across line-of-business apps
- 4.2.2 Proliferation of Gen-AI copilots embedded in productivity suites
- 4.2.3 Hybrid-work tooling mandates in global compliance standards
- 4.2.4 Vertical-specific low-code work platforms for frontline workers
- 4.2.5 Ecosystem shift to usage-based pricing unlocking SMB upgrade cycles
- 4.3 Market Restraints
- 4.3.1 Cyber-sovereignty laws restricting cross-border data residency
- 4.3.2 Rising SaaS sprawl driving consolidation fatigue and license rationalisation
- 4.3.3 Scarcity of integration talent delaying complex workflow roll-outs
- 4.4 Value Chain Analysis
- 4.5 Technological Outlook
- 4.6 Porter's Five Forces Analysis
- 4.6.1 Bargaining Power of Suppliers
- 4.6.2 Bargaining Power of Buyers
- 4.6.3 Threat of New Entrants
- 4.6.4 Threat of Substitutes
- 4.6.5 Intensity of Competitive Rivalry
- 4.7 Assessment of the Impact of Macroeconomic Trends on the Market
5 MARKET SIZE AND GROWTH FORECASTS (VALUE)
- 5.1 By Deployment
- 5.1.1 On-Premise
- 5.1.2 Cloud
- 5.2 By Organisation Size
- 5.2.1 Large Enterprises
- 5.2.2 Small and Medium Enterprises
- 5.3 By End-User Industry
- 5.3.1 BFSI
- 5.3.2 Telecommunications and IT
- 5.3.3 Manufacturing
- 5.3.4 Media, Entertainment and Publishing
- 5.3.5 Transportation and Logistics
- 5.3.6 Retail and E-commerce
- 5.3.7 Healthcare and Life Sciences
- 5.3.8 Government and Public Sector
- 5.3.9 Others (Education, Utilities)
- 5.4 By Solution Type
- 5.4.1 Content Collaboration and Document Management
- 5.4.2 Communication and Unified Communications
- 5.4.3 Project, Work and Task Management
- 5.4.4 Business Intelligence and Analytics
- 5.4.5 Low-Code / No-Code Automation
- 5.4.6 Digital Asset and Creative Tools
- 5.4.7 Security and Compliance Add-ons
- 5.5 By Geography
- 5.5.1 North America
- 5.5.1.1 United States
- 5.5.1.2 Canada
- 5.5.1.3 Mexico
- 5.5.2 Europe
- 5.5.2.1 Germany
- 5.5.2.2 United Kingdom
- 5.5.2.3 France
- 5.5.2.4 Italy
- 5.5.2.5 Spain
- 5.5.2.6 Russia
- 5.5.2.7 Rest of Europe
- 5.5.3 Asia-Pacific
- 5.5.3.1 China
- 5.5.3.2 Japan
- 5.5.3.3 India
- 5.5.3.4 South Korea
- 5.5.3.5 ASEAN
- 5.5.3.6 Australia and New Zealand
- 5.5.3.7 Rest of Asia-Pacific
- 5.5.4 South America
- 5.5.4.1 Brazil
- 5.5.4.2 Argentina
- 5.5.4.3 Rest of South America
- 5.5.5 Middle East and Africa
- 5.5.5.1 Middle East
- 5.5.5.1.1 Saudi Arabia
- 5.5.5.1.2 UAE
- 5.5.5.1.3 Turkey
- 5.5.5.1.4 Rest of Middle East
- 5.5.5.2 Africa
- 5.5.5.2.1 South Africa
- 5.5.5.2.2 Nigeria
- 5.5.5.2.3 Rest of Africa
- 5.5.1 North America
6 COMPETITIVE LANDSCAPE
- 6.1 Market Concentration
- 6.2 Strategic Moves
- 6.3 Market Share Analysis
- 6.4 Company Profiles (includes Global level Overview, Market level overview, Core Segments, Financials as available, Strategic Information, Market Rank/Share for key companies, Products and Services, Recent Developments)
- 6.4.1 Microsoft Corporation
- 6.4.2 Google LLC
- 6.4.3 Oracle Corporation
- 6.4.4 SAP SE
- 6.4.5 Salesforce Inc.
- 6.4.6 IBM Corporation
- 6.4.7 Broadcom Inc. (Symantec)
- 6.4.8 VMware Inc.
- 6.4.9 Amazon Web Services Inc.
- 6.4.10 Atlassian Corporation
- 6.4.11 ServiceNow Inc.
- 6.4.12 Adobe Inc.
- 6.4.13 Monday.com Ltd.
- 6.4.14 Asana Inc.
- 6.4.15 Zoho Corporation
- 6.4.16 Citrix Systems Inc.
- 6.4.17 Dropbox Inc.
- 6.4.18 Smartsheet Inc.
- 6.4.19 Slack Technologies LLC
- 6.4.20 AppScale Systems Inc.
7 MARKET OPPORTUNITIES AND FUTURE OUTLOOK
- 7.1 White-space and Unmet-need Assessment


