


 |
市场调查报告书
商品编码
1851038
资料品质工具:市场占有率分析、产业趋势、统计资料和成长预测(2025-2030 年)Data Quality Tools - Market Share Analysis, Industry Trends & Statistics, Growth Forecasts (2025 - 2030) |
||||||
※ 本网页内容可能与最新版本有所差异。详细情况请与我们联繫。
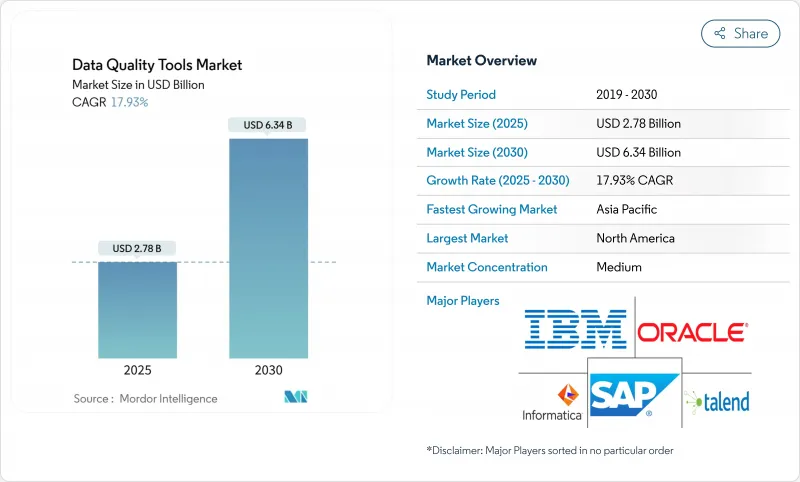
预计到 2025 年,数据品质工具市场规模将达到 27.8 亿美元,到 2030 年将达到 63.4 亿美元,复合年增长率为 17.93%。
监管审查力度加大、云端运算快速普及以及即时分析技术的广泛应用,使得高品质数据成为不可或缺的资产。由于模型准确性取决于干净可靠的数据,企业正将数据品质提升与人工智慧应用结合。能够与资料湖和低程式码工作流程整合的云端对应平臺需求最为强劲,有助于缓解专业人才短缺的问题。供应商正将重心转向自动化异常检测、预测性资料清洗和特定领域规则,加速银行、金融服务和保险 (BFSI)、零售和医疗保健等行业的部署。
全球数据品质工具市场趋势与洞察
核心银行平台加速向云端迁移,推动了大规模资料修復计划。
金融机构在将传统核心系统迁移到云端环境时,优先考虑自动化资料修復,以确保贷款和支付流程的线上运作。过去需要四到六个小时人工检验的核准房屋抵押贷款审批流程,现在几乎可以即时完成,从而改善客户体验并降低营运风险。云端原生资料品质引擎强化了资料撷取、分析和人工智慧主导的分析之间的回馈循环,形成一个良性循环:更优质的资料提升云端投资报酬率,进而增强资料品质预算。
日益增加的ESG报告义务要求公司范围内的资料品管
美国证券交易委员会的气候变迁揭露要求、加州的SB-253/SB-261法案以及欧盟的CSRD指令将于2025年1月生效,届时将对数千家公司产生影响。合规项目目前累计专案预算,用于追溯、检验和审核准备等工作。董事会正在将ESG数据不足与声誉风险联繫起来,并鼓励永续性负责人采用能够追踪范围3排放和检验供应商声明的解决方案。
传统本地资料仓储遗留的持续性技术债会减缓现代工具的采用。
许多组织每年花费高达 300 万美元维护老旧的 ETL 作业和专有资料库。旧模式和现代 API 之间的整合差距减缓了采用速度,迫使金融和医疗保健行业的公司在完全释放云端原生品质功能之前,必须按照多年的蓝图逐步升级。
细分市场分析
到2024年,云端部署将占资料品质工具市场收入的64%,相当于2025年基准年的约17.8亿美元。高达20.23%的复合年增长率表明,对于许多买家而言,扩充性、弹性定价以及接近性云端资料储存等因素比安全方面的担忧更为重要。随着API驱动的连接器简化了从SaaS来源和串流平台导入资料的过程,云端服务上的资料品质工具市场规模将迅速扩大。
在处理敏感的患者、支付和国防数据的行业中,本地部署仍然至关重要。预计到2024年,该领域将占总营收的36%,目前正致力于增强其混合部署能力,将受监管的工作负载与公共云端分析结合。医疗服务提供者正在努力平衡本地临床记录和在符合HIPAA标准的云端进行实验室资料清洗。
到2024年,大型企业将贡献58%的总收入,这主要得益于其跨越数十个领域的复杂资料资产以及监管义务。许多大型企业都拥有企业管治方案,将资料分析、监控和修復整合到一个通用的控制平台中。大型企业的数据品质工具市场规模稳定,但呈现逐步成长的趋势。
到2030年,该行业将以19.52%的复合年增长率成长,其中中小企业将是成长的主要驱动力。计量收费、消费积分和模组化包装将降低准入门槛。一项针对英国製造商的案例研究发现,数据品质的提升加快了产品创新速度,并增强了其竞争优势。
资料品质工具市场按部署类型(云端基础、本地部署)、组织规模(中小企业、大型企业)、元件(软体、服务)、资料领域(客户资料、产品资料、其他)、工具类型(资料分析、资料清洗/标准化、其他)、最终使用者产业(银行、金融服务和保险、政府、其他)以及地区进行细分。市场预测以美元计价。
区域分析
北美地区将在2024年贡献全球36%的收入,并在2025年接近10亿美元,主要得益于大规模的云端迁移以及金融服务领域人工智慧分析技术的广泛应用。美国证券交易委员会(SEC)气候报告规则的实施,进一步凸显了企业资料管理合规的重要性。总部位于亚太地区的供应商将拥有更快的创新週期,并能更早获得新功能。
亚太地区是成长最快的地区,预计2025年至2030年的复合年增长率将达到22.21%。对5G、电子商务和金融科技的投资将产生大量数据,因此需要进行品质保证。中国、印度和日本正将资料完整性作为其数位公共基础设施的支柱,而亚太地区的零售商正在加强客户360度全方位体验的部署,并引入用户画像引擎以实现个人化行销。
在严格的隐私和永续性法规的推动下,欧洲正经历强劲成长。企业社会责任指令(CSRD)推动了对审核的ESG资讯揭露解决方案的需求。企业正在权衡云端运算的优势与资料主权,并采用区域节点和主权云端来遵守区域化规则。欧洲企业董事会日益认识到,干净的数据是数位化竞争力的基石。
其他好处
- Excel格式的市场预测(ME)表
- 3个月的分析师支持
目录
第一章 引言
- 研究假设和市场定义
- 调查范围
第二章调查方法
第三章执行摘要
第四章 市场情势
- 市场概览
- 市场驱动因素
- 北美核心银行平台加速向云端迁移,推动大规模资料修復计划。
- 加强欧洲ESG报告义务需要公司范围内的资料品管。
- 人工智慧驱动的客户360度体验计画推动亚太零售业在数据分析和匹配工具方面的支出增加。
- 厂商原生自动化插件可降低SaaS工作负载的整体拥有成本。
- 金融服务业即时诈欺侦测管道推动了对串流数据品质引擎的需求
- 美国和欧盟的健康资料互通性法规加速了FHIR相容资料清洗解决方案的采用
- 市场限制
- 传统本地资料仓储中持续存在的技术债会减缓现代工具的采用。
- 区域资料居住法规的分散化使全球扩张变得复杂。
- 中小企业缺乏数据工程人才,阻碍了工具的有效利用。
- 由于一级ERP套件内建了ETL规则集,导致转换成本高。
- 技术展望
- 波特五力分析
- 供应商的议价能力
- 消费者议价能力
- 新进入者的威胁
- 替代品的威胁
- 竞争对手之间的竞争
- 对影响市场的宏观经济因素进行评估
第五章 市场规模与成长预测
- 依部署类型
- 云端基础的
- 本地部署
- 按组织规模
- 小型企业
- 大公司
- 按组件
- 软体
- 服务
- 按数据区域
- 客户数据
- 产品数据
- 财务数据
- 供应商和厂商数据
- 风险与合规数据
- 按工具类型
- 数据分析
- 资料清洗/标准化
- 资料匹配和去重
- 监控和警报
- 主资料管理为中心的工具
- 按行业
- BFSI
- 政府/公共部门
- 资讯科技和电信
- 零售与电子商务
- 医疗保健和生命科学
- 其他产业(製造业、公共产业、媒体)
- 按地区
- 北美洲
- 美国
- 加拿大
- 墨西哥
- 南美洲
- 巴西
- 阿根廷
- 智利
- 秘鲁
- 其他南美洲
- 欧洲
- 德国
- 英国
- 法国
- 义大利
- 西班牙
- 其他欧洲地区
- 亚太地区
- 中国
- 日本
- 韩国
- 印度
- 澳洲
- 纽西兰
- 亚太其他地区
- 中东和非洲
- 阿拉伯聯合大公国
- 沙乌地阿拉伯
- 土耳其
- 南非
- 其他中东和非洲地区
- 北美洲
第六章 竞争情势
- 策略发展
- 供应商定位分析
- 公司简介
- Informatica Inc.
- IBM Corporation
- SAP SE
- Oracle Corporation
- SAS Institute Inc.
- Precisely(Syncsort)
- Talend Inc.
- Experian PLC
- Ataccama Corp.
- Microsoft Corp.
- Collibra NV
- TIBCO Software Inc.
- Alteryx Inc.
- Dun and Bradstreet Holdings Inc.
- Moody's Analytics/Bureau van Dijk
- Information Builders(ibi/TIBCO)
- Data Ladder LLC
- Melissa Data Corp.
- Innovative Systems Inc.
- ASG Technologies
第七章 市场机会与未来展望
The data quality tools market size is currently valued at USD 2.78 billion in 2025 and is forecast to climb to USD 6.34 billion by 2030, reflecting a 17.93% CAGR.
Escalating regulatory scrutiny, rapid cloud adoption, and the surge in real-time analytics have positioned high-quality data as a non-negotiable asset. Enterprises are pairing data quality initiatives with AI deployments because model accuracy depends on clean, reliable data. Demand is strongest for cloud-ready platforms that integrate with data lakes and low-code workflows, helping firms offset shortages of specialist talent. Vendor focus has shifted toward automated anomaly detection, predictive cleansing, and domain-specific rules that accelerate implementation in sectors such as BFSI, retail, and healthcare.
Global Data Quality Tools Market Trends and Insights
Accelerated Migration of Core Banking Platforms to Cloud Driving High-Volume Data Remediation Projects
Financial institutions moving legacy cores to cloud environments are prioritizing automated data remediation to keep lending and payments processes online. Mortgage approval checks that once took 4-6 hours under manual validation now run in near real time after tool deployment, improving customer experience and reducing operational risk. Cloud-native data quality engines tighten feedback loops between data ingestion, profiling and AI-driven analytics, creating a cycle in which better data increases cloud ROI, which in turn reinforces quality budgets.
Intensifying ESG-Reporting Mandates Necessitating Enterprise-Wide Data Quality Controls
SEC climate disclosures, California SB-253/SB-261, and the EU CSRD begin in January 2025 and collectively affect thousands of firms. Compliance programmes now earmark dedicated budgets for lineage, validation, and audit-readiness functionality. Boards link poor ESG data to reputational risk, pushing sustainability officers to adopt solutions that track Scope 3 emissions and verify supplier declarations .
Persistent Technical Debt in Legacy On-Prem Data Warehouses Delaying Modern Tool Adoption
Many organisations divert budgets to maintain ageing ETL jobs and proprietary databases, spending USD 3 million yearly on upkeep. Integration gaps between old schemas and modern APIs slow rollouts, leading firms in finance and healthcare to phase upgrades over multi-year roadmaps before unlocking full cloud-native quality capabilities.
Other drivers and restraints analyzed in the detailed report include:
- AI-Driven Customer 360 Initiatives Boosting Spend on Data Profiling & Matching Tools
- Real-Time Fraud-Detection Pipelines in BFSI Catalysing Demand for Streaming Data Quality Engines
- Shortage of Data Engineering Talent Limiting Effective Tool Utilisation in SMEs
For complete list of drivers and restraints, kindly check the Table Of Contents.
Segment Analysis
Cloud deployments generated 64% of data quality tools market revenue in 2024, equal to roughly USD 1.78 billion in the 2025 baseline year. Exceptional 20.23% CAGR indicates that scalability, elastic pricing, and proximity to cloud data stores outweigh security concerns for most buyers. The data quality tools market size for cloud services is set to expand rapidly as API-driven connectors simplify ingestion from SaaS sources and streaming platforms.
On-premise installations remain critical for sectors handling sensitive patient, payment, or defence data. Accounting for 36% of revenue in 2024, this cohort is enhancing hybrid capabilities that bridge regulated workloads with public cloud analytics. Healthcare providers illustrate the balance, retaining clinical records on site while cleansing lab feeds in HIPAA-compliant clouds.
Large enterprises produced 58% of total revenue in 2024, thanks to complex data estates spanning dozens of domains and regulatory mandates. Many run enterprise governance programmes that integrate data profiling, monitoring, and remediation into common control planes. The data quality tools market size among large enterprises is stable yet incremental.
SMEs deliver the strongest momentum with 19.52% CAGR to 2030. Pay-as-you-go pricing, consumption credits, and modular packaging lower entry costs. Case studies from UK manufacturers show that improved data quality increased product innovation velocity and enhanced competitive positioning, fostering broader adoption beyond early tech adopters.
Data Quality Tools Market is Segmented by Deployment Type (Cloud-Based, On-Premise), Size of the Organization (SMEs, Large Enterprises), Component (Software, Services), Data Domain (Customer Data, Product Data, and More), Tool Type (Data Profiling, Data Cleansing/Standardisation, and More), End-User Vertical (BFSI, Government and Public Sector, and More), Geography. The Market Forecasts are Provided in Terms of Value (USD).
Geography Analysis
North America generated 36% of global revenue in 2024, or close to USD 1.00 billion in 2025, underpinned by heavy cloud migration in financial services and advanced adoption of AI-enabled analytics. The introduction of SEC climate reporting rules strengthens the compliance rationale for enterprise-wide data controls. Vendors headquartered in the region accelerate innovation cycles, providing early exposure to new features.
Asia-Pacific is the fastest mover with a projected 22.21% CAGR from 2025 to 2030. Investments in 5G, e-commerce, and fintech generate vast data volumes that require quality assurances. China, India, and Japan emphasise data integrity as a pillar of digital public infrastructure, while APAC retailers deploy profiling engines to enhance Customer 360 rollouts and personalise offers.
Europe's growth is steady, driven by stringent privacy and sustainability mandates. The CSRD drives demand for solutions that ensure auditable ESG disclosures. Organisations weigh cloud benefits against data sovereignty, adopting regional nodes or sovereign clouds to comply with localisation rules. Increasingly, European boards recognise clean data as foundational to digital competitiveness.
- Informatica Inc.
- IBM Corporation
- SAP SE
- Oracle Corporation
- SAS Institute Inc.
- Precisely (Syncsort)
- Talend Inc.
- Experian PLC
- Ataccama Corp.
- Microsoft Corp.
- Collibra NV
- TIBCO Software Inc.
- Alteryx Inc.
- Dun and Bradstreet Holdings Inc.
- Moody's Analytics/Bureau van Dijk
- Information Builders (ibi/TIBCO)
- Data Ladder LLC
- Melissa Data Corp.
- Innovative Systems Inc.
- ASG Technologies
Additional Benefits:
- The market estimate (ME) sheet in Excel format
- 3 months of analyst support
TABLE OF CONTENTS
1 INTRODUCTION
- 1.1 Study Assumptions and Market Definition
- 1.2 Scope of the Study
2 RESEARCH METHODOLOGY
3 EXECUTIVE SUMMARY
4 MARKET LANDSCAPE
- 4.1 Market Overview
- 4.2 Market Drivers
- 4.2.1 Accelerated Migration of Core Banking Platforms to Cloud Driving High-Volume Data Remediation Projects in North America
- 4.2.2 Intensifying ESG-Reporting Mandates in Europe Necessitating Enterprise-Wide Data Quality Controls
- 4.2.3 AI-Driven Customer 360 Initiatives Boosting Spend on Data Profiling and Matching Tools Across APAC Retail
- 4.2.4 Vendor-Native Automation Plug-Ins Reducing Total Cost-of-Ownership for SaaS Workloads
- 4.2.5 Real-Time Fraud-Detection Pipelines in BFSI Catalysing Demand for Streaming Data Quality Engines
- 4.2.6 Healthcare Interoperability Rules (US and EU) Accelerating FHIR-Compatible Data Cleansing Solutions
- 4.3 Market Restraints
- 4.3.1 Persistent Technical Debt in Legacy On-Prem Data Warehouses Delaying Modern Tool Adoption
- 4.3.2 Fragmented Regional Data-Residency Statutes Complicating Global Roll-Outs
- 4.3.3 Shortage of Data Engineering Talent Limiting Effective Tool Utilisation in SMEs
- 4.3.4 High Switching Costs from Embedded ETL Rule-Sets within Tier-1 ERP Suites
- 4.4 Technological Outlook
- 4.5 Porter's Five Forces Analysis
- 4.5.1 Bargaining Power of Suppliers
- 4.5.2 Bargaining Power of Consumers
- 4.5.3 Threat of New Entrants
- 4.5.4 Threat of Substitute Products
- 4.5.5 Intensity of Competitive Rivalry
- 4.6 Assessment of Macroeconomic Factors Impact on the Market
5 MARKET SIZE AND GROWTH FORECASTS (VALUE)
- 5.1 By Deployment Type
- 5.1.1 Cloud-based
- 5.1.2 On-Premise
- 5.2 By Size of the Organization
- 5.2.1 Small and Medium Enterprises
- 5.2.2 Large Enterprises
- 5.3 By Component
- 5.3.1 Software
- 5.3.2 Services
- 5.4 By Data Domain
- 5.4.1 Customer Data
- 5.4.2 Product Data
- 5.4.3 Financial Data
- 5.4.4 Supplier and Vendor Data
- 5.4.5 Risk and Compliance Data
- 5.5 By Tool Type
- 5.5.1 Data Profiling
- 5.5.2 Data Cleansing / Standardisation
- 5.5.3 Data Matching and De-Duplication
- 5.5.4 Monitoring and Alerting
- 5.5.5 Master Data Management-Centric Tools
- 5.6 By End-User Vertical
- 5.6.1 BFSI
- 5.6.2 Government and Public Sector
- 5.6.3 IT and Telecom
- 5.6.4 Retail and E-commerce
- 5.6.5 Healthcare and Life Sciences
- 5.6.6 Other Industries (Manufacturing, Utilities, Media)
- 5.7 By Geography
- 5.7.1 North America
- 5.7.1.1 United States
- 5.7.1.2 Canada
- 5.7.1.3 Mexico
- 5.7.2 South America
- 5.7.2.1 Brazil
- 5.7.2.2 Argentina
- 5.7.2.3 Chile
- 5.7.2.4 Peru
- 5.7.2.5 Rest of South America
- 5.7.3 Europe
- 5.7.3.1 Germany
- 5.7.3.2 United Kingdom
- 5.7.3.3 France
- 5.7.3.4 Italy
- 5.7.3.5 Spain
- 5.7.3.6 Rest of Europe
- 5.7.4 Asia-Pacific
- 5.7.4.1 China
- 5.7.4.2 Japan
- 5.7.4.3 South Korea
- 5.7.4.4 India
- 5.7.4.5 Australia
- 5.7.4.6 New Zealand
- 5.7.4.7 Rest of Asia-Pacific
- 5.7.5 Middle East and Africa
- 5.7.5.1 United Arab Emirates
- 5.7.5.2 Saudi Arabia
- 5.7.5.3 Turkey
- 5.7.5.4 South Africa
- 5.7.5.5 Rest of Middle East and Africa
- 5.7.1 North America
6 COMPETITIVE LANDSCAPE
- 6.1 Strategic Developments
- 6.2 Vendor Positioning Analysis
- 6.3 Company Profiles (includes Global level Overview, Market level overview, Core Segments, Financials as available, Strategic Information, Products and Services, and Recent Developments)
- 6.3.1 Informatica Inc.
- 6.3.2 IBM Corporation
- 6.3.3 SAP SE
- 6.3.4 Oracle Corporation
- 6.3.5 SAS Institute Inc.
- 6.3.6 Precisely (Syncsort)
- 6.3.7 Talend Inc.
- 6.3.8 Experian PLC
- 6.3.9 Ataccama Corp.
- 6.3.10 Microsoft Corp.
- 6.3.11 Collibra NV
- 6.3.12 TIBCO Software Inc.
- 6.3.13 Alteryx Inc.
- 6.3.14 Dun and Bradstreet Holdings Inc.
- 6.3.15 Moody's Analytics/Bureau van Dijk
- 6.3.16 Information Builders (ibi/TIBCO)
- 6.3.17 Data Ladder LLC
- 6.3.18 Melissa Data Corp.
- 6.3.19 Innovative Systems Inc.
- 6.3.20 ASG Technologies
7 MARKET OPPORTUNITIES AND FUTURE OUTLOOK
- 7.1 White-Space and Unmet-Need Assessment


