


 |
市场调查报告书
商品编码
1851081
气相层析法:市场占有率分析、产业趋势、统计数据和成长预测(2025-2030 年)Gas Chromatography - Market Share Analysis, Industry Trends & Statistics, Growth Forecasts (2025 - 2030) |
||||||
※ 本网页内容可能与最新版本有所差异。详细情况请与我们联繫。
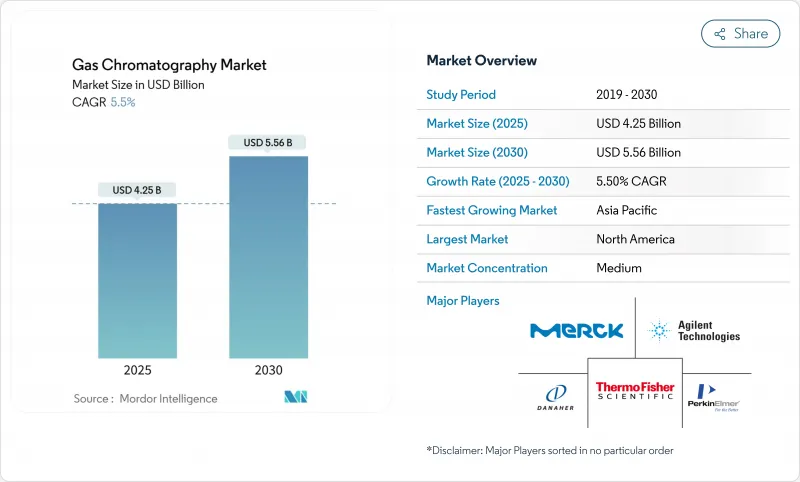
预计到 2025 年,气相层析法市场规模将达到 42.5 亿美元,到 2030 年将达到 55.6 亿美元,年复合成长率为 5.50%。
环境和药物检测领域日益严格的法规、氢能係统等技术的快速升级以及载气供应链的积极策略,都在推动着这一稳步发展趋势。全球实验室正从氦气转向氢气和氮气,在降低营运成本的同时,也减少了对稀缺惰性气体的依赖。与质谱仪的整合如今已成为资本支出计划的重点,它将分离和鑑定整合到一次运行中,提高了分析通量,并增强了数据完整性。可携式和微型气相层析仪正在重塑现场分析,而技术创新,尤其是在气体发生器和低相容比毛细管柱等配件方面的创新,表明永续和自主运行将在2030年之前成为竞争优势的关键所在。
全球气相层析法市场趋势与洞察
扩大 GC-MS 工作流程的应用
气相层析法质谱联用技术(GC-MS)现已成为受监管产业的标准做法。製药研发管线利用GC-MS进行杂质分析,超过80%的新药认证申请会参考整合层析法资料系统。环保机构使用GC-MS来检测微量污染物,而大气压力化学电离等技术的进步进一步提高了灵敏度。这些功能的结合缩短了样品製备步骤,节省了分析人员的时间,并满足了监管机构对资料完整性的要求。
气相层析在药物核准品管中的作用日益增强
美国食品药物管理局 (FDA) 严格的製程分析技术指南要求进行即时监测,这促使企业投资建设能够在生产车间连续运作的高性能气相层析 (GC) 设备。二维气相层析 (2D GC) 和自动化杂质定量技术能够应对生物製药的特性,而机器学习演算法则能加速峰值识别,从而强化 GC 在加快核准中的作用。
对先进GC平台的高额资本投入
一套完整的二维气相层析质谱联用系统单价可能超过50万美元,而安装和服务合约可能使总成本增加30%。小型实验室在设备升级方面一直较为滞后,但租赁项目和设备共用计画正在蓬勃发展,逐渐降低了经济门槛。
细分市场分析
系统仍将是主要市场参与者,预计2024年将贡献38.50%的销售额。受更新换代週期和整合检测器的推动,这些桌上型气相层析法仪的市场规模预计将持续成长。可携式和微型气相层析仪以9.84%的复合年增长率成长,满足了紧急应变、采矿、燃料配送和其他行业的现场监测需求。例如,FLIR Griffin G510等仪器在坚固耐用的机壳中提供了实验室等级的检测能力。现场安装可缩短样品处理时间并支援即时决策。添加自动取样器还可以弥补技能差距并标准化通量,而分液收集器则为製备工作流程开闢了一片天地。检测器升级和基于MEMS的创新将分析扩展到以前无法进入的环境,从而增强了可携式系统在气相层析法市场中的重要性。
与此同时,高性能模组正朝着小型化方向发展。柱上加热器、微型进样器和快速冷却设计在保持层析法分离度的同时,显着缩小了体积。氢气载气偏好符合可携式的功率预算和环保目标,正推动对氢燃料电池微型气相层析仪的需求。预计未来五年,成本的持续降低将推动可携式气相层析法平台市场份额的成长。
2024年,色谱柱将占总支出的46.26%,这反映了其作为耗材的地位,以及其可预测的更换週期。低相容比毛细管的创新提高了挥发性硫化物的惰性和峰形。然而,随着实验室以按需供应的氢气、氮气和零级空气取代钢瓶,气体发生器的年复合成长率高达8.8%。 PEAK Scientific收购Noblegen扩大了该领域的产能,并使其业务遍及全球。保护柱和高纯度接头等色谱柱附件可提高维护效率。采用先进合金製成的压力稳压器可承受氢气的使用,而支援RFID的阀门可自动发出更换警报。改进的管路可减少死体积、提高峰形对称性并节省气体。随着永续性受到重视,能够减少浪费并提高仪器运作运行时间的优质耗材价格更高,这将直接影响气相层析法市场。
区域分析
2024年,北美将占全球销售额的36.36%,这主要得益于美国环保署(EPA)的强有力监管、强劲的製药生产以及众多分析密集型产业。赛默飞世尔科技(Thermo Fisher)在北美地区20亿美元的扩张计划,体现了其对设备持续需求的信心。在美国,饮用水中全氟烷基和多氟烷基物质(PFAS)的检测标准要求低于兆分之一,这项要求正在逐步实施,推动了实验室的升级改造和新设备的安装。加拿大和墨西哥将凭藉着不断增长的石化产品产量和统一的环境通讯协定,为市场成长提供助力,确保在整个预测期内设备都能保持积极的更新换代。
欧洲凭藉着影响深远的环境指令和严格的食品安全法规,保持其第二梯队的领先地位。联邦层级的农药残留限制和积极的微塑胶治理措施推动了对高灵敏度气相层析仪平台的需求,而氢能转化奖励则与区域能源目标相契合。德国、英国和法国占据订单主导地位,义大利和西班牙的农产品品质检测业务也呈现成长态势。欧洲市场重视低功耗、氢能优化的仪器以及能够简化GDPR和GMP法规合规性的整合式资料完整性模组。
亚太地区以8.74%的复合年增长率成为成长最快的地区,这主要得益于工业化、药品产量成长以及先进的监测方法。中国仍是最大的市场贡献者,但受宏观经济逆风的影响,供应商的销售额有所波动。日本和印度将透过清洁能源计画和原料药生产规模的扩大来加速需求成长。韩国正在投资需要超微量分析的高科技产业,而澳洲的采矿业正在采用可携式气相层析仪来简化现场调查。技术转移、本地化生产和政府资助计画正在扩大潜在市场,巩固该地区在未来气相层析法市场成长中的地位。
随着中东和非洲的石化企业对其品质实验室进行现代化改造,该地区正迎来新的发展势头。海湾合作委员会(GCC)炼油厂升级和氢气生产的投资带来了稳定的设备订单,而南非的采矿和化学工业则依赖气相层析(GC)平台进行製程控制。经济波动将抑制短期内的订单量,但区域内与国际标准的接轨将推动技术的逐步普及。
南美洲呈现缓慢但稳定的成长态势。巴西的製药和石化产业丛集着订单,而阿根廷的农产品则推动了农药残留检测的发展。区域贸易协定促进了设备跨境流动,智利的铜矿开采业务则整合了线上气相层析系统以符合排放标准。外汇波动和政治变革加剧了市场波动,但当地分销商透过提供融资和维护合约来降低风险。
其他福利:
- Excel格式的市场预测(ME)表
- 3个月的分析师支持
目录
第一章 引言
- 研究假设和市场定义
- 调查范围
第二章调查方法
第三章执行摘要
第四章 市场情势
- 市场概览
- 市场驱动因素
- GC-MS工作流程的日益普及
- 扩大GC在药物核准品管中的作用
- 页岩气与石油化学分析扩展
- 世界各地都制定了严格的空气和水质法规。
- 在全球氦气短缺的情况下,转向使用氢气作为载气
- PFAS/微塑胶监测要求激增
- 市场限制
- 对尖端GC平台的高额资本投入
- 训练有素的色谱分析人员短缺
- 氦气供应链波动影响运转率
- 遵守气相层析溶剂排放法规的成本
- 供应链分析
- 监管环境
- 技术展望
- 波特五力分析
- 新进入者的威胁
- 买方的议价能力
- 供应商的议价能力
- 替代品的威胁
- 竞争对手之间的竞争
第五章 市场规模与成长预测
- 依设备类型
- 系统
- 检测器
- 自动取样器
- 分液收集器
- 微型可携式层析仪
- 其他设备
- 配件及耗材
- 柱子
- 立柱配件
- 压力调节器
- 瓦斯发电机
- 管件和管材
- 其他的
- 按下检测器类型
- 火焰离子化检测器(FID)
- 热导检测器(TCD)
- 电子捕获检测器(ECD)
- 质谱检测器(GC-MS)
- 其他的
- 最终用户
- 製药和生物技术公司
- 石油天然气/石化业
- 环境和污水处理剂
- 食品饮料业
- 学术和政府研究机构
- 其他的
- 按地区
- 北美洲
- 美国
- 加拿大
- 墨西哥
- 欧洲
- 德国
- 英国
- 法国
- 义大利
- 西班牙
- 其他欧洲地区
- 亚太地区
- 中国
- 日本
- 印度
- 韩国
- 澳洲
- 亚太其他地区
- 中东和非洲
- GCC
- 南非
- 其他中东和非洲地区
- 南美洲
- 巴西
- 阿根廷
- 其他南美洲
- 北美洲
第六章 竞争情势
- 市场集中度
- 市占率分析
- 公司简介
- Agilent Technologies
- Shimadzu Corporation
- Thermo Fisher Scientific
- Danaher(Cytiva & Pall)
- PerkinElmer
- Merck KGaA
- Waters Corporation
- Teledyne Technologies
- Restek Corporation
- Chromatotec
- Scion Instruments
- Sartorius
- Air Liquide(Extended Life Sciences)
- Process Sensing Tech(LDetek)
- Hobre Instruments BV
- Phenomenex
- Bruker Corporation
- LECO Corporation
- Markes International
- Falcon Analytical
第七章 市场机会与未来展望
The gas chromatography market stands at USD 4.25 billion in 2025 and is forecast to reach USD 5.56 billion by 2030, advancing at a 5.50% CAGR.
Heightened regulatory scrutiny in environmental and pharmaceutical testing, rapid technology upgrades such as hydrogen-ready systems, and proactive supply-chain strategies around carrier gases underpin this steady trajectory. Laboratories worldwide are moving from helium to hydrogen and nitrogen, trimming operating costs while reducing dependence on scarce noble gas supplies. Integrations with mass spectrometry now dominate capital-spending agendas because they condense separation and identification into a single run, accelerating throughput and improving data integrity. Portable and micro-GC units are reshaping field analytics, and accessory innovations, particularly gas generators and low-phase-ratio capillary columns, signal that sustainable, autonomous operations will define competitive advantage through 2030.
Global Gas Chromatography Market Trends and Insights
Rising Adoption of GC-MS Workflows
Linking gas chromatography with mass spectrometry is now standard practice across regulated industries. Pharmaceutical pipelines rely on GC-MS for impurity profiling, and more than 80% of new-drug dossiers reference integrated chromatography data systems. Environmental agencies use GC-MS to detect contaminants at trace levels, and developments such as atmospheric pressure chemical ionization push sensitivity even further. These combined capabilities shorten sample preparation steps, free analyst time, and meet regulators' data-integrity demands.
Growing Role of GC in Drug-Approval Quality Controls
Stringent process analytical technology guidance from the FDA mandates real-time monitoring, driving investment in rugged GC units that can run continuously on production floors. Two-dimensional GC and automated impurity quantitation address increasingly complex biologic formulations, while machine-learning algorithms accelerate peak identification, reinforcing GC's role in fast-tracking approvals.
High Capital Expenditure for Advanced GC Platforms
Comprehensive two-dimensional GC-MS systems can top USD 500,000 per unit, and installation plus service contracts can add 30% to total spend. Smaller laboratories delay upgrades, yet leasing programs and shared-instrument initiatives are gaining momentum, softening the financial barrier.
Other drivers and restraints analyzed in the detailed report include:
- Expansion of Shale-Gas & Petrochemical Analytics
- Stringent Air & Water-Quality Regulations Worldwide
- Shortage of Trained Chromatographers
For complete list of drivers and restraints, kindly check the Table Of Contents.
Segment Analysis
Systems remained the workhorse, contributing 38.50% to 2024 revenue. The gas chromatography market size for these benchtop units will continue to rise, propelled by replacement cycles and integrated detectors. Portable and micro-GC instruments, growing at 9.84% CAGR, meet on-site monitoring needs in emergency response, mining, and fuel distribution. Devices such as the FLIR Griffin G510 deliver laboratory-grade detection in rugged housing. Field deployability saves sample-handling time and supports real-time decision making. Laboratories also add auto-samplers to close skill gaps and standardize throughput, while fraction collectors carve niches in preparative workflows. Detector upgrades and MEMS-based innovations extend analytics to previously inaccessible environments, reinforcing the relevance of portable systems within the gas chromatography market.
A parallel trend is the miniaturization of high-performance modules: on-column heaters, micro-injectors, and rapid cooling designs shrink physical footprints while maintaining chromatographic resolution. The preference for hydrogen carrier gas aligns with portable power budgets and environmental objectives, reinforcing demand for hydrogen-ready micro-GCs. Continuous cost improvements suggest portable platforms will capture a growing slice of gas chromatography market share over the next five years.
Columns captured 46.26% of the 2024 spend, reflecting their status as consumables with predictable replacement intervals. Low-phase-ratio capillary innovations improve inertness and peak shape for volatile sulfur compounds. Gas generators, however, are racing ahead at an 8.8% CAGR as labs swap cylinders for on-demand hydrogen, nitrogen, and zero air. PEAK Scientific's takeover of Noblegen extends capacity and global reach in this segment. Column accessories such as guard columns and high-purity connectors keep maintenance workflows efficient. Pressure regulators made from advanced alloys withstand hydrogen service, while RFID-enabled valves automate replacement alerts. Tubing refinements cut dead volume, sharpening peak symmetry and conserving gas. As sustainability priorities climb, premium consumables that reduce waste and extend instrument uptime earn price premiums, directly influencing the gas chromatography market.
The Gas Chromatography Market is Segmented by Instrument (Systems, Detectors, Auto-Samplers, and More), Accessories & Consumables (Columns, Column Accessories, and More), Detector Type (Flame Ionization, Thermal Conductivity, and More), End User (Pharmaceutical & Biotechnology, Oil & Gas, and More), and Geography (North America, Europe, Asia-Pacific, and More). The Market Sizes and Forecasts are Provided in Terms of Value (USD).
Geography Analysis
North America contributes 36.36% of global revenue in 2024, anchored by robust EPA mandates, strong pharmaceutical output, and a deep bench of analytically intensive industries. Thermo Fisher's USD 2 billion domestic expansion plan asserts confidence in sustained equipment demand. The United States enforces PFAS drinking-water limits that require sub-parts-per-trillion detection, driving laboratory upgrades and new installations. Canada and Mexico supplement growth via petrochemical outputs and harmonized environmental protocols, ensuring replacement cycles stay active throughout the forecast window.
Europe maintains second-tier leadership through far-reaching environmental directives and stringent food-safety regulations. Union-wide pesticide residue controls and vigorous microplastic initiatives elevate demand for sensitive GC platforms, and hydrogen conversion incentives align with regional energy goals. Germany, the United Kingdom, and France dominate orders, while Italy and Spain grow through agricultural quality testing. The European market rewards low-power, hydrogen-optimized instruments and integrated data integrity modules that simplify compliance with GDPR and GMP provisions.
Asia Pacific records the fastest trajectory at 8.74% CAGR, driven by industrialization, rising pharmaceutical output, and progressive monitoring laws. China remains the largest contributor, though vendor sales fluctuated amid macroeconomic headwinds. Japan and India accelerate demand through clean-energy programs and API manufacturing scale-up. South Korea invests in high-tech industries requiring ultra-trace analytics, whereas Australia's mining sector adopts portable GC units for site survey efficiency. Technology transfer, local production, and government funding schemes expand the addressable base, cementing the region's role in future gas chromatography market growth.
Middle East and Africa register emerging momentum as petrochemical complexes modernize quality labs. GCC investments in refinery upgrades and hydrogen production translate into steady instrument orders, while South Africa's mining and chemicals sectors rely on GC platforms for process control. Economic variance tempers short-term volumes, but regional alignment with international standards fosters gradual adoption.
South America presents moderate yet stable expansion. Brazil's pharmaceutical and petrochemical clusters anchor orders, and Argentine agribusiness drives pesticide residue testing. Regional trade pacts ease cross-border equipment movement, and Chilean copper operations integrate online GC systems for emission compliance. Currency swings and political shifts add volatility, but local distributors offset risk by offering financing and maintenance contracts.
- Agilent Technologies
- Shimadzu
- Thermo Fisher Scientific
- Danaher (Cytiva & Pall)
- PerkinElmer
- Merck
- Waters Corporation
- Teledyne Technologies
- Restek
- Chromatotec
- Scion Instruments
- Sartorius
- Air Liquide (Extended Life Sciences)
- Process Sensing Tech (LDetek)
- Hobre Instruments
- Phenomenex
- Bruker
- LECO
- Markes International
- Falcon Analytical
Additional Benefits:
- The market estimate (ME) sheet in Excel format
- 3 months of analyst support
TABLE OF CONTENTS
1 Introduction
- 1.1 Study Assumptions & Market Definition
- 1.2 Scope of the Study
2 Research Methodology
3 Executive Summary
4 Market Landscape
- 4.1 Market Overview
- 4.2 Market Drivers
- 4.2.1 Rising Adoption of GC-MS Workflows
- 4.2.2 Growing Role of GC In Drug-Approval Quality Controls
- 4.2.3 Expansion of Shale-Gas & Petrochemical Analytics
- 4.2.4 Stringent Air- & Water-Quality Regulations Worldwide
- 4.2.5 Shift To Hydrogen Carrier Gas Amid Global Helium Shortage
- 4.2.6 Surge In PFAS/Micro-Plastic Monitoring Requirements
- 4.3 Market Restraints
- 4.3.1 High Capital Expenditure For Advanced GC Platforms
- 4.3.2 Shortage Of Trained Chromatographers
- 4.3.3 Supply-Chain Volatility for Helium Impacting Uptime
- 4.3.4 Emission-Control Compliance Costs for GC Solvents
- 4.4 Supply Chain Analysis
- 4.5 Regulatory Landscape
- 4.6 Technological Outlook
- 4.7 Porter's Five Forces Analysis
- 4.7.1 Threat of New Entrants
- 4.7.2 Bargaining Power of Buyers
- 4.7.3 Bargaining Power of Suppliers
- 4.7.4 Threat of Substitutes
- 4.7.5 Intensity of Competitive Rivalry
5 Market Size & Growth Forecasts (Value)
- 5.1 By Instrument Type
- 5.1.1 Systems
- 5.1.2 Detectors
- 5.1.3 Auto-samplers
- 5.1.4 Fraction Collectors
- 5.1.5 Micro & Portable GC
- 5.1.6 Other Instruments
- 5.2 By Accessories & Consumables
- 5.2.1 Columns
- 5.2.2 Column Accessories
- 5.2.3 Pressure Regulators
- 5.2.4 Gas Generators
- 5.2.5 Fittings & Tubing
- 5.2.6 Others
- 5.3 By Detector Type
- 5.3.1 Flame Ionization Detector (FID)
- 5.3.2 Thermal Conductivity Detector (TCD)
- 5.3.3 Electron Capture Detector (ECD)
- 5.3.4 Mass-Spectrometry Detector (GC-MS)
- 5.3.5 Others
- 5.4 By End User
- 5.4.1 Pharmaceutical & Biotechnology Companies
- 5.4.2 Oil & Gas / Petrochemical Industry
- 5.4.3 Environmental & Waste-water Agencies
- 5.4.4 Food & Beverage Industry
- 5.4.5 Academic & Government Research Institutes
- 5.4.6 Others
- 5.5 By Geography
- 5.5.1 North America
- 5.5.1.1 United States
- 5.5.1.2 Canada
- 5.5.1.3 Mexico
- 5.5.2 Europe
- 5.5.2.1 Germany
- 5.5.2.2 United Kingdom
- 5.5.2.3 France
- 5.5.2.4 Italy
- 5.5.2.5 Spain
- 5.5.2.6 Rest of Europe
- 5.5.3 Asia Pacific
- 5.5.3.1 China
- 5.5.3.2 Japan
- 5.5.3.3 India
- 5.5.3.4 South Korea
- 5.5.3.5 Australia
- 5.5.3.6 Rest of Asia Pacific
- 5.5.4 Middle East and Africa
- 5.5.4.1 GCC
- 5.5.4.2 South Africa
- 5.5.4.3 Rest of Middle East and Africa
- 5.5.5 South America
- 5.5.5.1 Brazil
- 5.5.5.2 Argentina
- 5.5.5.3 Rest of South America
- 5.5.1 North America
6 Competitive Landscape
- 6.1 Market Concentration
- 6.2 Market Share Analysis
- 6.3 Company Profiles (includes Global-level Overview, Market-level Overview, Core Segments, Financials as available, Strategic Information, Market Rank/Share for key companies, Products & Services, and Recent Developments)
- 6.3.1 Agilent Technologies
- 6.3.2 Shimadzu Corporation
- 6.3.3 Thermo Fisher Scientific
- 6.3.4 Danaher (Cytiva & Pall)
- 6.3.5 PerkinElmer
- 6.3.6 Merck KGaA
- 6.3.7 Waters Corporation
- 6.3.8 Teledyne Technologies
- 6.3.9 Restek Corporation
- 6.3.10 Chromatotec
- 6.3.11 Scion Instruments
- 6.3.12 Sartorius
- 6.3.13 Air Liquide (Extended Life Sciences)
- 6.3.14 Process Sensing Tech (LDetek)
- 6.3.15 Hobre Instruments BV
- 6.3.16 Phenomenex
- 6.3.17 Bruker Corporation
- 6.3.18 LECO Corporation
- 6.3.19 Markes International
- 6.3.20 Falcon Analytical
7 Market Opportunities & Future Outlook
- 7.1 White-space & Unmet-Need Assessment
 火焰光强度市场:2026-2032年全球市场预测(依应用程式、检测器用户、产品类型及销售管道划分)微型气相层析法市场:按组件、技术、应用和最终用户划分,全球预测,2026-2032年
 气相层析法市场报告:按产品、终端用户产业和地区划分(2026-2034 年)多点气体检测柜市场:依产品类型、气体类型、应用、终端用户产业和分销管道划分,全球预测,2026-2032年按填料类型、结构材料、排放类型、运作模式和应用产业分類的填料塔洗涤器市场,全球预测,2026-2032年
 全球气相层析法市场规模、份额、趋势和成长分析报告(2026-2034)
 气相层析法市场规模、份额及成长分析(按产品、最终用户及地区划分)-2026-2033年产业预测
 气相层析的全球市场 - 使用趋势,预测(2025年~2033年)
 气相层析市场机会、成长驱动因素、产业趋势分析与预测 2024 - 2032
 亚太地区气相层析市场预测至 2031 年 - 区域分析 - 依进样技术、进样类型、侦测器类型和最终用户