


 |
市场调查报告书
商品编码
1851091
5G服务:市场占有率分析、产业趋势、统计数据和成长预测(2025-2030年)5G Services - Market Share Analysis, Industry Trends & Statistics, Growth Forecasts (2025 - 2030) |
||||||
※ 本网页内容可能与最新版本有所差异。详细情况请与我们联繫。
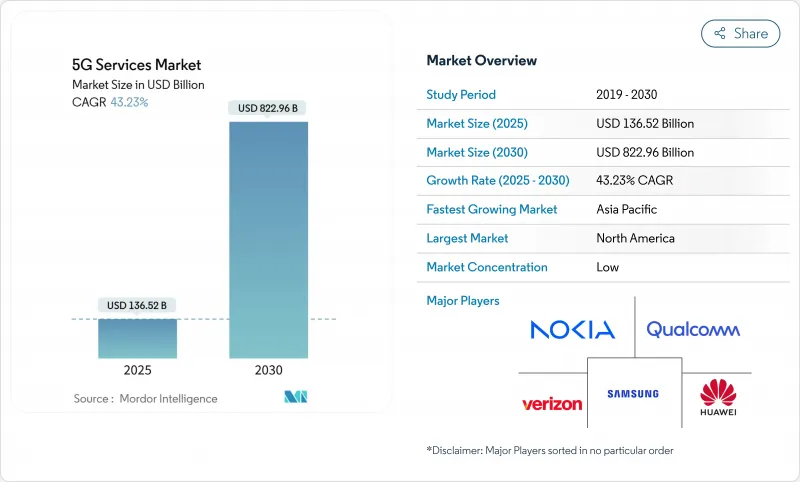
预计 5G 服务市场在 2025 年将创造 1,365.2 亿美元的收入,到 2030 年将达到 8,229.6 亿美元,复合年增长率为 43.23%。
通讯业者正从基于流量的收费转向基于体验的收费,这种模式对延迟、吞吐量和安全等级有保障,并收取额外费用,从而提升工业领域的平均用户收入。製造业、医疗保健和物流正在采用专用 5G 网路来支援即时自动化、预测性维护和远端操作。亚太地区透过积极开放频谱和大规模部署 5G-Advanced 网络,保持其技术领先地位,而北美则利用其丰富的中频段频谱资源,加速固定无线接入 (FWA) 的普及。
全球5G服务市场趋势与洞察
企业数位转型用例
主要亮点
- 2024年行动数据流量将年增38%,到2030年将成长八倍,这将为4G网路带来巨大压力,并促使营运商向5G中频段频谱过渡。影片串流媒体已消耗超过70%的行动电话频宽,促使营运商将流量分流至5G独立网路核心网。随着通讯业者能够以更高的价格分布提供分级无限流量套餐,同时降低每GB的成本,5G服务市场将从中受益。随着智慧型手机处理器和显示器的改进,4K行动视讯、云端游戏和基于XR的娱乐将推动流量成长,进一步巩固预计的8.5%的复合年增长率。
透过网路切片和 SLA 层级实现获利
美国商用5G网路的平均下载速度为225 Mbps,中国为405 Mbps,远超过4G记录。消费者如今期望获得稳定的4K串流媒体播放和低延迟游戏体验,通讯业者在已开发市场推出高级速度套餐,每月每用户平均收入(ARPU)增加5-10美元。行动装置厂商预测,2024年5G智慧型手机出货量将达到2.8亿部,占旗舰机型市场的81%,这巩固了他们对大众市场的承诺。通讯业者将透过基于速度的套餐和捆绑云端游戏通行证来满足这项需求,在eMBB需求的推动下,实现6.2%的复合年增长率。体育场馆、音乐会场馆和交通枢纽越来越多地依赖5G小型基地台来支援高流量,这表明消费者愿意为可预测的吞吐量付费。
实施成本高,投资回收期长
一座5G基地台的成本在10万至20万美元之间,而毫米波基地台的成本是其两倍。到2025年,全球5G基础设施投资将超过1.1兆美元,但损益平衡点通常需要8到10年,这给价格敏感地区的企业带来了沉重的负担。一些营运商报告称,即使采用了节能软体,电费也上涨了23%。这种压力促使企业达成成本分摊协议,例如KDDI和Softbank Corporation在日本协力网路。像T-Mobile以44亿美元收购UScellular的併购案也强化了企业追求规模经济的趋势。
细分市场分析
至2024年,增强型行动宽频将占5G服务市场64.20%的份额。超可靠、低延迟通讯将以60.30%的复合年增长率成长,这主要得益于依赖亚毫秒延迟的製造自动化和远端手术等应用。大规模机器通讯在智慧城市网路中日益普及,根据Mobile World Live预测,到2033年,蜂巢式物联网链路数量将达到75亿。
URLLC(超可靠低延迟通讯)推动了高阶业务的获利模式,各产业为确保确定性效能而付费。预计到2030年,随着医院网路采用机器人手术链路,URLLC应用的5G服务市场规模将占据较高的个位数份额。 RedCap和eRedCap设备的标准化降低了物联网晶片组的成本,加速了简化型工业感测器的商业化进程。网路切片为低资料速率设备分配专用频宽,从而提高了物流公司的电池续航时间和可预测性。
区域分析
亚太地区预计在2024年贡献全球42.00%的收入,并以56.42%的复合年增长率成为所有地区中成长最快的地区。中国联通北京和华为联合运作的5G-Advanced网路覆盖1000万人口,凸显了融合频谱接入、低成本硬体以及厂商与营运商紧密合作的生态系统(huawei.com)。印度的固定无线存取(FWA)市场目标是在2027年达到3,000万用户,反映出该国固定宽频的庞大需求尚未满足,目前只有11%的家庭享有有线宽频存取。
在北美,丰富的中频段频谱和积极的固定无线接入(FWA)扩张已使预计到2027年5G用户渗透率达到90%。 T-Mobile的643万FWA用户和Verizon的430万FWA用户表明,无线接入已成为光纤的主流替代方案。加拿大Rogers公司在该地区进行了首次网路切片测试,为企业级保固服务铺平了道路。
欧洲在独立组网(SA)覆盖率方面落后,预计到2024年下半年SA覆盖率仅2%。然而,德国、英国和西班牙正在加速部署,沃达丰和Three的合併(202.8亿美元)预计将为SA部署提供更大的资金池。在中东和非洲,埃及投资6.09亿美元计画于2025年推出5G服务,南非已新增1,080万用户,覆盖率超过50%。拉丁美洲也稳定扩张,巴西将在1300个城市推出商用5G服务,哥斯大黎加将于2025年2月分配四个频宽的频谱。
其他福利:
- Excel格式的市场预测(ME)表
- 3个月的分析师支持
目录
第一章 引言
- 研究假设和市场定义
- 调查范围
第二章调查方法
第三章执行摘要
第四章 市场洞察
- 市场概览
- 市场驱动因素
- 行动资料流程量的爆炸性成长
- 消费者对eMBB服务的需求很高
- 企业数位转型用例
- 政府为开放频宽所做的努力
- 在CBRS和频宽授权频段上部署私人5G网络
- 利用网路切片和 SLA 层级实现货币化
- 市场限制
- 实施成本高,投资报酬期长
- 碎片化且滞后的频谱政策
- 新兴市场5G设备准备度有限
第五章 市场动态
- 价值链分析
- 监管环境
- 技术展望
- 波特五力分析
- 新进入者的威胁
- 买方的议价能力
- 供应商的议价能力
- 替代品的威胁
- 竞争对手之间的竞争
第六章 市场规模与成长预测
- 按服务类型
- 高速大容量(eMBB)
- 超可靠、低延迟通讯(URLLC)
- 大规模机器通讯(mMTC)
- 透过网路架构
- 非独立组网(NSA)5G
- 独立组网(SA)5G
- 按最终用户行业划分
- 资讯科技和电讯
- 媒体与娱乐
- 汽车与出行
- 能源与公共产业
- 航太/国防
- 製造业
- 卫生保健
- 其他行业
- 按地区
- 北美洲
- 美国
- 加拿大
- 墨西哥
- 南美洲
- 巴西
- 阿根廷
- 其他南美洲
- 欧洲
- 德国
- 英国
- 法国
- 义大利
- 俄罗斯
- 其他欧洲地区
- 亚太地区
- 中国
- 印度
- 日本
- 韩国
- ASEAN
- 亚太其他地区
- 中东和非洲
- 中东
- 沙乌地阿拉伯
- 阿拉伯聯合大公国
- 土耳其
- 其他中东地区
- 非洲
- 南非
- 奈及利亚
- 其他非洲地区
- 北美洲
第七章 竞争情势
- 市场集中度
- 策略趋势
- 市占率分析
- 公司简介
- China Mobile Ltd.
- Verizon Communications Inc.
- ATandT Inc.
- T-Mobile US Inc.
- China Telecom Corp. Ltd.
- Telefonaktiebolaget LM Ericsson
- Nokia Corp.
- Huawei Technologies Co. Ltd.
- Deutsche Telekom AG
- Vodafone Group Plc
- Orange SA
- Telefonica SA
- BT Group plc
- Swisscom AG
- Telstra Corp. Ltd.
- SK Telecom Co. Ltd.
- KT Corp.
- Rakuten Mobile Inc.
- Reliance Jio Infocomm Ltd.
- Qualcomm Inc.(5G as-a-Service platforms)
- Samsung Electronics Co. Ltd.(5G networks)
第八章:市场机会与未来展望
- 閒置频段与未满足需求评估
The 5G services market generated USD 136.52 billion in 2025 and is forecast to reach USD 822.96 billion by 2030, reflecting a 43.23% CAGR.
Standalone 5G rollouts, the commercial debut of network slicing, and a rapid shift from consumer to enterprise use cases underpin this expansion.Operators are moving away from traffic-based billing and toward experience-based pricing that charges premiums for assured latency, throughput, and security levels, boosting average revenue per user in industrial verticals. Manufacturing, healthcare, and logistics are adopting private 5G networks to support real-time automation, predictive maintenance, and remote operations-use cases that cannot be handled by legacy Wi-Fi. Asia Pacific retains technology leadership through aggressive spectrum releases and large-scale 5G-Advanced deployments, while North America leverages a deep mid-band spectrum pool to accelerate fixed wireless access (FWA) adoption.
Global 5G Services Market Trends and Insights
Enterprise Digital-Transformation Use Cases
Key Highlights
- Mobile-data traffic rose 38% year-on-year in 2024 and is tracking toward an eight-fold increase by 2030, straining 4 G networks and driving migration to 5 G mid-band spectrum. Video streaming already consumes more than 70% of cellular bandwidth, encouraging operators to off-load traffic to 5G stand-alone cores where higher spectral efficiency lowers cost per bit. eMBB services now average 38 GB per subscriber each month in South Korea, a figure that would saturate legacy radios. The 5G services market benefits because service providers can tier unlimited-data plans at higher price points while still reducing the cost per gigabyte. As smartphone processors and displays improve, 4K mobile video, cloud gaming, and XR-based entertainment will amplify traffic, reinforcing the 8.5% uplift in forecast CAGR.
Monetization via Network Slicing and SLA Tiers
Commercial 5 G networks deliver median download speeds of 225 Mbps in the United States and 405 Mbps in China, well above 4 G records. Consumers now expect consistent 4K streaming and low-latency gaming, prompting carriers to launch premium-speed tiers that add USD 5-10 to monthly ARPU in developed markets. Handset vendors shipped 280 million 5 G-capable smartphones in 2024, 81% of the flagship segment, cementing mass-market readiness. Operators monetize this appetite with speed-based plans and bundled cloud-gaming passes, producing the 6.2% CAGR lift attributed to eMBB demand. Stadiums, concert venues, and transportation hubs increasingly rely on 5 G small cells to sustain dense traffic, proving early willingness to pay for predictable throughput.
High Deployment Cost and Long ROI Horizons
Operators face steep capital commitments: a single 5G base-station costs USD 100,000-200,000, with millimeter-wave units up to twice as expensive. Global 5G infrastructure spend will top USD 1.1 trillion in 2025, yet breakeven is often eight to ten years, stretching balance sheets in price-sensitive regions. Energy outlays are also rising; some operators report 23% hikes in electricity bills even after adopting power-saving software. These pressures spur cost-sharing deals such as KDDI and SoftBank's joint network build in Japan, which aims to lower expenses by 30-40% through site co-location. Mergers like T-Mobile's USD 4.4 billion acquisition of UScellular reinforce the quest for scale economies.
Other drivers and restraints analyzed in the detailed report include:
- Enterprise Digital-Transformation Use Cases
- Government Spectrum-Release Initiatives
- Limited 5G Device Readiness in Emerging Markets
For complete list of drivers and restraints, kindly check the Table Of Contents.
Segment Analysis
Enhanced mobile broadband contributed 64.20% to the 5G services market in 2024, reflecting its foundational role in consumer video and gaming. Ultra-reliable low-latency communications is forecast to deliver a 60.30% CAGR, buoyed by manufacturing automation and telesurgery, which depend on sub-millisecond latency. Massive machine-type communications is gaining traction in smart-city grids, with cellular IoT links predicted to hit 7.5 billion by 2033, according to Mobile World Live.
URLLC drives premium monetization because industries will pay to ensure deterministic performance. The 5G services market size for URLLC applications is projected to capture a high-single-digit share by 2030 as hospital networks adopt robotic-surgery links. Standardization of RedCap and eRedCap devices keeps IoT chipset costs down, hastening commercial readiness for simplified industrial sensors. Network slicing allocates dedicated bandwidth to low-data-rate devices, improving battery life and predictability for logistics firms.
The 5G Service Market Report is Segmented by Service Type (Enhanced Mobile Broadband (eMBB), Ultra-Reliable Low-Latency Comms (URLLC), and More), Network Architecture (Non-Standalone (NSA) 5G and Standalone (SA) 5G), End-User Industry (IT and Telecom, Media and Entertainment, Automotive and Mobility, and More), and Geography. The Market Forecasts are Provided in Terms of Value (USD).
Geography Analysis
Asia Pacific generated 42.00% of global revenue in 2024 and is on track for a 56.42% CAGR, the fastest among all regions. China Unicom Beijing and Huawei activated a 5G-Advanced network covering 10 million people, highlighting an ecosystem that blends spectrum access, low-cost hardware, and tight vendor-operator collaboration huawei.com. India's FWA market aims for 30 million users by 2027, reflecting unmet fixed-broadband demand in a nation where only 11% of households enjoy wired access.
North America already records 90% 5G subscription penetration forecasts for 2027, driven by abundant mid-band spectrum and aggressive FWA scaling. T-Mobile's 6.43 million FWA customers and Verizon's 4.3 million illustrate how wireless has become a mainstream alternative to fiber. Canada's Rogers performed the region's first network-slicing trial, paving the way for guaranteed service to enterprises.
Europe lags in standalone coverage, with only 2% SA availability in late 2024. Yet Germany, the UK, and Spain accelerate deployment, while the USD 20.28 billion Vodafone-Three merger promises deeper capital pools for SA rollouts. In the Middle East and Africa, Egypt invested USD 609 million to prepare for 2025 launches, and South Africa reaches over 50% population coverage with 10.8 million users. Latin America is steadily expanding, with Brazil's commercial 5G live in 1,300 cities and Costa Rica allocating spectrum across four bands in February 2025.
- China Mobile Ltd.
- Verizon Communications Inc.
- ATandT Inc.
- T-Mobile US Inc.
- China Telecom Corp. Ltd.
- Telefonaktiebolaget LM Ericsson
- Nokia Corp.
- Huawei Technologies Co. Ltd.
- Deutsche Telekom AG
- Vodafone Group Plc
- Orange S.A.
- Telefonica S.A.
- BT Group plc
- Swisscom AG
- Telstra Corp. Ltd.
- SK Telecom Co. Ltd.
- KT Corp.
- Rakuten Mobile Inc.
- Reliance Jio Infocomm Ltd.
- Qualcomm Inc. (5G as-a-Service platforms)
- Samsung Electronics Co. Ltd. (5G networks)
Additional Benefits:
- The market estimate (ME) sheet in Excel format
- 3 months of analyst support
TABLE OF CONTENTS
1 INTRODUCTION
- 1.1 Study Assumptions and Market Definition
- 1.2 Scope of the Study
2 RESEARCH METHODOLOGY
3 EXECUTIVE SUMMARY
4 MARKET INSIGHTS
- 4.1 Market Overview
- 4.2 Market Drivers
- 4.2.1 Exploding mobile data traffic
- 4.2.2 High consumer demand for eMBB services
- 4.2.3 Enterprise digital-transformation use-cases
- 4.2.4 Government spectrum-release initiatives
- 4.2.5 Private-5G uptake in CBRS and local-licence bands
- 4.2.6 Monetisation via network slicing and SLA tiers
- 4.3 Market Restraints
- 4.3.1 High deployment cost and long ROI horizons
- 4.3.2 Fragmented and delayed spectrum policy
- 4.3.3 Limited 5G device readiness in emerging markets
5 MARKET DYNAMICS
- 5.1 Value Chain Analysis
- 5.2 Regulatory Landscape
- 5.3 Technological Outlook
- 5.4 Porter's Five Forces Analysis
- 5.4.1 Threat of New Entrants
- 5.4.2 Bargaining Power of Buyers
- 5.4.3 Bargaining Power of Suppliers
- 5.4.4 Threat of Substitutes
- 5.4.5 Intensity of Competitive Rivalry
6 MARKET SIZE AND GROWTH FORECASTS (VALUE)
- 6.1 By Service Type
- 6.1.1 Enhanced Mobile Broadband (eMBB)
- 6.1.2 Ultra-Reliable Low-Latency Comms (URLLC)
- 6.1.3 Massive Machine-Type Comms (mMTC)
- 6.2 By Network Architecture
- 6.2.1 Non-Standalone (NSA) 5G
- 6.2.2 Standalone (SA) 5G
- 6.3 By End-User Industry
- 6.3.1 IT and Telecom
- 6.3.2 Media and Entertainment
- 6.3.3 Automotive and Mobility
- 6.3.4 Energy and Utilities
- 6.3.5 Aerospace and Defense
- 6.3.6 Manufacturing
- 6.3.7 Healthcare
- 6.3.8 Other Industries
- 6.4 By Geography
- 6.4.1 North America
- 6.4.1.1 United States
- 6.4.1.2 Canada
- 6.4.1.3 Mexico
- 6.4.2 South America
- 6.4.2.1 Brazil
- 6.4.2.2 Argentina
- 6.4.2.3 Rest of South America
- 6.4.3 Europe
- 6.4.3.1 Germany
- 6.4.3.2 United Kingdom
- 6.4.3.3 France
- 6.4.3.4 Italy
- 6.4.3.5 Russia
- 6.4.3.6 Rest of Europe
- 6.4.4 Asia Pacific
- 6.4.4.1 China
- 6.4.4.2 India
- 6.4.4.3 Japan
- 6.4.4.4 South Korea
- 6.4.4.5 ASEAN
- 6.4.4.6 Rest of Asia Pacific
- 6.4.5 Middle East and Africa
- 6.4.5.1 Middle East
- 6.4.5.1.1 Saudi Arabia
- 6.4.5.1.2 UAE
- 6.4.5.1.3 Turkey
- 6.4.5.1.4 Rest of Middle East
- 6.4.5.2 Africa
- 6.4.5.2.1 South Africa
- 6.4.5.2.2 Nigeria
- 6.4.5.2.3 Rest of Africa
- 6.4.1 North America
7 COMPETITIVE LANDSCAPE
- 7.1 Market Concentration
- 7.2 Strategic Moves
- 7.3 Market Share Analysis
- 7.4 Company Profiles {(includes Global level Overview, Market level overview, Core Segments, Financials as available, Strategic Information, Market Rank/Share for key companies, Products and Services, and Recent Developments)}
- 7.4.1 China Mobile Ltd.
- 7.4.2 Verizon Communications Inc.
- 7.4.3 ATandT Inc.
- 7.4.4 T-Mobile US Inc.
- 7.4.5 China Telecom Corp. Ltd.
- 7.4.6 Telefonaktiebolaget LM Ericsson
- 7.4.7 Nokia Corp.
- 7.4.8 Huawei Technologies Co. Ltd.
- 7.4.9 Deutsche Telekom AG
- 7.4.10 Vodafone Group Plc
- 7.4.11 Orange S.A.
- 7.4.12 Telefonica S.A.
- 7.4.13 BT Group plc
- 7.4.14 Swisscom AG
- 7.4.15 Telstra Corp. Ltd.
- 7.4.16 SK Telecom Co. Ltd.
- 7.4.17 KT Corp.
- 7.4.18 Rakuten Mobile Inc.
- 7.4.19 Reliance Jio Infocomm Ltd.
- 7.4.20 Qualcomm Inc. (5G as-a-Service platforms)
- 7.4.21 Samsung Electronics Co. Ltd. (5G networks)
8 MARKET OPPORTUNITIES AND FUTURE OUTLOOK
- 8.1 White-space and Unmet-need Assessment
 2026年全球5G服务市场报告
 5G服务市场分析及预测(至2035年):依类型、产品类型、服务、技术、组件、应用、部署类型、最终用户及功能划分
 2026-2034年全球5G服务市场规模、份额、趋势和成长分析报告
 5G服务市场-全球产业规模、份额、趋势、机会及预测(依通讯类型、产业垂直领域、最终用途、地区及竞争格局划分,2021-2031年)
 5G服务市场:产业趋势·全球预测 (~2035年):服务类型·通讯类型·技术·用途·终端用户·企业规模·各地区
 2025-2029年全球5G服务市场
 全球 5G 服务市场:市场规模、份额和趋势分析(按通讯类型、行业和地区)、按细分市场预测(2025-2030 年)
 5G 服务市场规模、份额及成长分析(按通讯类型、企业、应用、最终用户和地区)- 产业预测(2025 年至 2032 年)
 5G服务的全球市场的评估:各类型,各终端用户,各产业,各地区,机会,预测(2017年~2031年)
 5G 服务市场报告:2030 年趋势、预测与竞争分析