


 |
市场调查报告书
商品编码
1851111
行动电源:市场占有率分析、产业趋势、统计数据和成长预测(2025-2030 年)Power Bank - Market Share Analysis, Industry Trends & Statistics, Growth Forecasts (2025 - 2030) |
||||||
※ 本网页内容可能与最新版本有所差异。详细情况请与我们联繫。
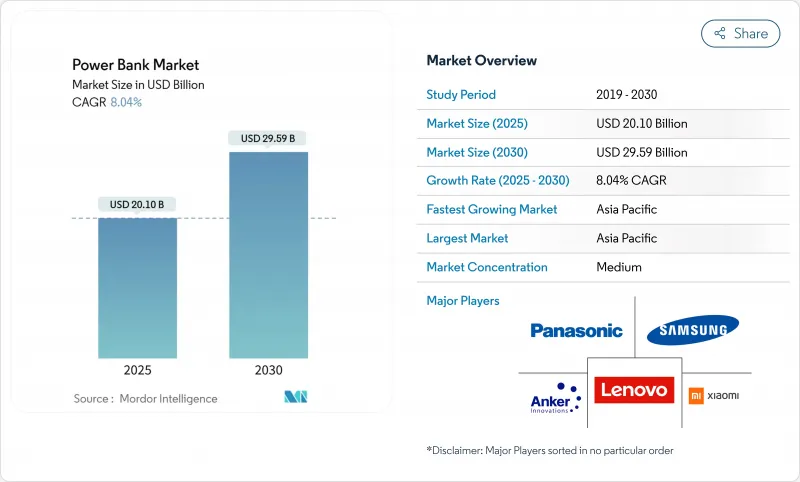
预计到 2025 年,行动电源市场规模将达到 201 亿美元,到 2030 年将达到 295.9 亿美元,2025 年至 2030 年的复合年增长率为 8.04%。
这种稳定成长反映了可携式充电在当今环境中的重要作用,因为5G行动电话、更大的萤幕和多装置使用等因素导致电池消耗速度远超以往技术。製造商正在大力推广氮化镓(GaN)晶片组,该晶片组可透过多个连接埠提供高达165W的功率,同时还能减轻产品重量,从而将用户群从行动电话扩展到笔记型电脑和主机。游戏玩家和需要长时间离网供电的远端办公人员正在转向20000mAh及以上的大容量行动电源。亚太地区凭藉其高智慧型手机销售、薄弱的电网以及成本效益高的製造群,保持着领先地位。该地区的共用行动电源亭网路也使充电成为一种类似公共的服务。基于UN38.3标准的空运法规推高了运输成本,而世界各地的监管机构正在召回不安全的仿冒品,这进一步巩固了拥有认证供应链的知名品牌的优势。
全球行动电源市场趋势与洞察
5G智慧型手机的快速普及
5G行动电话的能耗将比4G手机高出20-30%,毫米波处理和频繁的基地台切换会迅速消耗电池电量。平均萤幕续航时间将从12-14小时缩短至8-10小时,迫使用户在日常通勤中携带备用电源。随着行动通讯业者在人口密集的城市完成中频段部署,活跃的5G连线数将超过智慧型手机流量的一半,这将在未来十年内对可携式充电解决方案形成结构性需求。
家用电器电子商务的扩张
2024年,网路商店在出货量中占据了很大份额,其成长速度超过了实体店。注重规格的买家会参考产品页面上的详细运力图表、港口通讯协定和安全标籤。用户评论凸显了仿冒品的风险,并为发布独立测试摘要的品牌带来了流量。数位化履约也突破了地理限制,使中型供应商能够触及没有经销商网路的偏远地区的买家。
假冒伪劣产品的氾滥破坏了人们的信任
监管机构召回了42.9万个小型充电器,先前有51起故障报告和6起烧烫伤事故发生。 UL的调查发现,大多数假冒产品绕过了过热保护电路,增加了热失控的风险。海关加强检查、提高罚款额度以及强制摘要报告等措施增加了持证企业的合规成本,但并未彻底消除市场上的假冒产品。
细分市场分析
容量在 8001-20000mAh 之间的行动电源,兼顾了两到三次智慧型手机充电的需求以及航空公司随身携带物品的限制,在 2024 年占据了行动电源市场 32.5% 的份额。这一细分市场将受益于重量低于 400 克、却能为笔记型电脑提供 65W 功率的价格分布(GaN) 产品。随着内建 4500-5000mAh 电芯的 5G中阶设备的推出,该细分市场的营收也将同步成长。
容量在 20,001-30,000mAh 区间的行动电源成长最快,复合年增长率 (CAGR) 为 8.6%。专业游戏玩家、无人机飞行员和远端办公人员倾向于选择能为 85W 笔记型电脑提供 4-6 小时续航的行动电源。产品通讯重点在于支援直通充电、智慧温控和符合美国运输安全管理局 (TSA) 规定的尺寸,从而将高容量行动电源的容量控制在航空公司规定的 100Wh 限制之内。预计随着高阶游戏笔记型电脑出货量的成长,该细分市场的行动电源规模也将扩大,而随着入门级行动电话容量超过 5,000mAh,容量低于 3,000mAh 的行动电源市场规模将会下降。
由于有线解决方案具有高转换效率和与 USB-C 电源传输协定的广泛相容性,预计到 2024 年,其市场份额将保持在 58.3%。企业和内容创作者更倾向于使用有线设备,因为目前的感应线圈无法满足 90W 以上的负载需求。儘管如此,无线产品的复合年增长率仍将达到 9.7%,这主要得益于无连接行动电话的普及以及 Qi2 认证的推出,后者将线圈对准效率提升至 80%。
如今,街角小摊就能租到线圈式行动电源,供游客租赁,这标誌着行动电源逐渐被主流市场接受。能够同时为15W行动电话和5W耳机充电的二合一行动电源也越来越受欢迎。因此,随着每瓦成本的下降,无线设备行动电源的市场份额可能会在2030年之前持续扩大。
行动电源市场按容量范围(最高 3,000 mAh、3,001-8,000 mAh、8,001-20,000 mAh 及其他)、充电技术(有线、无线)、应用领域(智慧型手机和平板电脑、笔记型电脑和游戏机及其他)、分销(有线、无线)、应用领域(智慧型手机和平板电脑、笔记型电脑和游戏机及其他)、分销(有线、无线和离线)以及线上进行区域通路。市场预测以美元计价。
区域分析
亚太地区行动电源市占率将在2024年达到高峰51.2%,并在2030年之前以9.1%的复合年增长率成长。中国、印度和印尼每年智慧型手机出货量合计超过10亿部,城市附近电网经常出现2-6小时的轮流停电。当地製造商正利用劳动力和零件的接近性,将前置作业时间缩短至30天以内,而叫车公司则在地铁站安装租赁充电亭,并将充电服务转化为微服务。
北美地区销量位居第二。消费者平均每两年更换行动电话,并且偏好支援 65W PPS 快充的 USB-C 介面等功能,这种介面可以在 50 分钟内为笔记型电脑充满电。对中国製造的电子产品征收关税预计到 2025 年将使平均售价上涨 18%,但消费者对 Anker、Belkin 和苹果认证供应商的品牌忠诚度稳定了出货量。获得认证的电商平台透过提供免费送货服务来承担危险品运输费用,从而维持了需求动能。
在永续性政策的推动下,欧洲市场呈现温和成长。欧盟电池法规将加强可回收性资讯揭露,强制要求从2027年起使用QR码材料护照,并激励品牌宣传更长的循环寿命和消费后回收计画。德国、法国和北欧国家在无线充电的普及方面处于领先地位,公共交通工具的座椅上已安装了感应式垫片。
其他福利:
- Excel格式的市场预测(ME)表
- 3个月的分析师支持
目录
第一章 引言
- 研究假设和市场定义
- 调查范围
第二章调查方法
第三章执行摘要
第四章 市场情势
- 市场概览
- 市场驱动因素
- 5G智慧型手机的快速普及
- 家用电器电子商务的扩张
- 在电力系统不稳定的开发中国家扩大应用
- 大容量笔记型电脑和游戏机的快速普及
- 交通枢纽行动租赁亭的激增
- 将氮化镓快速充电晶片组整合到高阶机型中
- 市场限制
- 假冒伪劣产品的氾滥正在侵蚀信任。
- 延长智慧型手机原生电池续航力
- 收紧对锂离子运输的联合国38.3号航空货运规定
- 早期采用固体微型电池将减少外部电池组的需求。
- 供应链分析
- 监管环境
- 技术展望
- 波特五力分析
- 供应商的议价能力
- 买方的议价能力
- 新进入者的威胁
- 替代品的威胁
- 竞争对手之间的竞争
- 评估市场宏观经济趋势
第五章 市场规模与成长预测
- 按容量范围
- 最高可达 3000mAh
- 3,001-8,000 mAh
- 8,001-20,000 mAh
- 20,001-30,000 mAh
- 30,000mAh 或以上
- 透过充电技术
- 有线
- 无线的
- 透过使用
- 智慧型手机和平板电脑
- 笔记型电脑和游戏机
- 穿戴式装置和物联网设备
- 相机和无人机
- 其他设备(电子烟、路由器、医疗设备)
- 透过分销管道
- 在线的
- 离线
- 按地区
- 北美洲
- 美国
- 加拿大
- 墨西哥
- 南美洲
- 巴西
- 阿根廷
- 其他南美洲
- 欧洲
- 德国
- 英国
- 法国
- 义大利
- 其他欧洲地区
- 亚太地区
- 中国
- 日本
- 韩国
- 印度
- 亚太其他地区
- 中东和非洲
- 中东
- 沙乌地阿拉伯
- 阿拉伯聯合大公国
- 土耳其
- 其他中东地区
- 非洲
- 南非
- 埃及
- 奈及利亚
- 其他非洲地区
- 北美洲
第六章 竞争情势
- 市场集中度
- 策略趋势
- 市占率分析
- 公司简介
- Anker Innovations Ltd.
- Xiaomi Corporation
- Samsung Electronics Co., Ltd.
- Shenzhen Haopai Electronics(RAVPower)
- Lenovo Group Ltd.
- Sony Group Corporation
- Koninklijke Philips NV
- ADATA Technology Co., Ltd.
- Panasonic Energy Co., Ltd.
- Huawei Technologies Co., Ltd.
- ZAGG Inc.(mophie)
- Belkin International
- UGREEN Group Ltd.
- Baseus Technology Co., Ltd.
- Syska Mobile Accessories
- Ambrane India Pvt. Ltd.
- Intex Technologies(India)Ltd.
- Aukey Technology Co., Ltd.
- Zendure USA Inc.
- EcoFlow Inc.
第七章 市场机会与未来展望
The power bank market generated USD 20.10 billion in 2025 and is forecast to reach USD 29.59 billion in 2030, translating to an 8.04% CAGR over 2025-2030.
This steady rise reflects the indispensable role of portable charging in an environment where 5G phones, larger displays and multi-device lifestyles drain batteries faster than earlier technology generations. Manufacturers are pushing gallium nitride (GaN) chipsets that supply up to 165 W through several ports while cutting product weight, which expands the addressable user base beyond phones to laptops and consoles. Capacity migration to 20,000 mAh and above is visible among gamers and remote workers who need prolonged off-grid power. Asia Pacific holds the lead thanks to its smartphone volume, patchy grids and cost-efficient manufacturing clusters, and the region's shared-power-bank kiosk networks are making charging a utility-like service. Regulatory oversight is tightening in parallel; air-cargo rules under UN 38.3 standards raise shipping costs, while authorities worldwide are recalling unsafe counterfeit units, reinforcing the advantage of established brands with certified supply chains.
Global Power Bank Market Trends and Insights
Surging Penetration of 5G-Enabled Smartphones
5G handsets draw 20-30% more energy than 4G equivalents because millimeter-wave processing and constant cell-handover drain batteries quickly. Average screen-on endurance drops from 12-14 hours to 8-10 hours, pushing users to carry supplementary power on daily commutes. As mobile operators finish mid-band roll-outs in dense cities, active 5G connections pass the halfway mark of smartphone traffic, embedding a structural demand for portable charging solutions through this decade.
Expanding E-Commerce for Consumer Electronics
Online stores held a significant share of 2024 unit shipments and grew faster than physical retail. Spec-driven buyers rely on detailed capacity charts, port protocols, and safety labels posted on product pages. User-generated reviews expose counterfeit risks, nudging traffic toward brands that publish independent test summaries. Digital fulfillment also short-circuits geographic barriers, allowing mid-tier vendors to reach rural buyers without dealer networks.
Inflated Counterfeit and Sub-Standard Products Eroding Trust
Regulators recalled 429,000 compact chargers after 51 failure reports and 6 burn injuries, underscoring the safety threat posed by untested cells. UL Research shows most fakes skip temperature cut-off circuitry, raising thermal-runaway risk.Heightened customs inspections, fines, and mandatory test summaries raise compliance costs for licensed firms while still failing to fully shut counterfeiters out of marketplace listings.
Other drivers and restraints analyzed in the detailed report include:
- Higher Penetration in Developing Economies with Unreliable Power Grids
- Integration of GaN Fast-Charging Chipsets in Premium Models
- Incremental Gains in Native Smartphone Battery Life
For complete list of drivers and restraints, kindly check the Table Of Contents.
Segment Analysis
The 8,001-20,000 mAh tier led the power bank market with 32.5% revenue in 2024, due to its compromise between two to three smartphone recharges and airline cabin limits. This segment benefits from mid-priced GaN variants that stay under 400 g yet deliver 65 W for notebooks. Revenue here will rise in tandem with 5G mid-range handsets that still launch with 4,500-5,000 mAh internal cells.
The 20,001-30,000 mAh tier is the fastest climber at 8.6% CAGR. Professional gamers, drone pilots, and remote-first employees gravitate to packs that sustain 4-6 hours of 85 W laptop draw. Product messaging highlights pass-through charging, smart-temperature control, and TSA-compliant footprints, keeping the high-capacity segment within the accepted 100 Wh airline ceiling. The power bank market size for this tier is projected to expand alongside premium gaming notebook shipments, while sub-3,000 mAh units fade as entry-level phones cross 5,000 mAh internal capacity.
Wired solutions retained a 58.3% share in 2024 due to higher conversion efficiency and broader compatibility with USB-C Power Delivery. Enterprises and content creators prefer cabled units because 90 W-plus loads remain impractical on current inductive coils. Nevertheless, wireless SKUs will log a 9.7% CAGR, reflecting more port-less phones and Qi2 certification that lifts coil alignment efficiency to 80%.
High-street kiosks now rent coil-based bricks for tourists, signaling mainstream acceptance. Two-in-one surfaces that power both a handset at 15 W and an earbud case at 5 W drive up-selling value. Consequently, the power bank market share of wireless devices will keep widening through 2030 as the cost per watt falls.
Power Bank Market is Segmented by Capacity Range (Up To 3, 000 MAh, 3, 001 - 8, 000 MAh, 8, 0001 - 20, 000 MAh, and More), Charging Technology (Wired, Wireless), Application (Smartphones and Tablets, Laptops and Gaming Consoles, and More), Distribution Channel (Online and Offline), and by Geography. The Market Forecasts are Provided in Terms of Value (USD).
Geography Analysis
Asia-Pacific maintained the highest regional power bank market share at 51.2% in 2024 and is headed for a 9.1% CAGR to 2030. China, India, and Indonesia together ship more than 1 billion smartphones annually, and rolling blackouts of 2-6 hours are common in peri-urban grids. Local manufacturers leverage labor and component proximity, compressing lead times to under 30 days, while ride-hail firms install rental kiosks in metro stations, framing charging as a micro-service.
North America ranked second by revenue. Consumers replace handsets every two years and favor specs such as PPS-enabled USB-C at 65 W that refuel laptops in under 50 minutes. Tariffs on Chinese electronics lifted average selling prices 18% in 2025, but brand loyalty toward Anker, Belkin, and Apple-certified suppliers held shipments steady. Certified e-tailers absorb hazmat fees into free-shipping bundles, preserving demand momentum.
Europe shows moderate growth centered on sustainability mandates. The EU Battery Regulation enforces recyclability disclosures and requires QR-coded material passports from 2027, motivating brands to highlight longer cycle life and post-consumer recycling programs. Wireless-charging adoption leads Germany, France, and the Nordics, where public transport integrates inductive pads in seating.
- Anker Innovations Ltd.
- Xiaomi Corporation
- Samsung Electronics Co., Ltd.
- Shenzhen Haopai Electronics (RAVPower)
- Lenovo Group Ltd.
- Sony Group Corporation
- Koninklijke Philips N.V.
- ADATA Technology Co., Ltd.
- Panasonic Energy Co., Ltd.
- Huawei Technologies Co., Ltd.
- ZAGG Inc. (mophie)
- Belkin International
- UGREEN Group Ltd.
- Baseus Technology Co., Ltd.
- Syska Mobile Accessories
- Ambrane India Pvt. Ltd.
- Intex Technologies (India) Ltd.
- Aukey Technology Co., Ltd.
- Zendure USA Inc.
- EcoFlow Inc.
Additional Benefits:
- The market estimate (ME) sheet in Excel format
- 3 months of analyst support
TABLE OF CONTENTS
1 INTRODUCTION
- 1.1 Study Assumptions and Market Definition
- 1.2 Scope of the Study
2 RESEARCH METHODOLOGY
3 EXECUTIVE SUMMARY
4 MARKET LANDSCAPE
- 4.1 Market Overview
- 4.2 Market Drivers
- 4.2.1 Surging penetration of 5G-enabled smartphones
- 4.2.2 Expanding e-commerce for consumer electronics
- 4.2.3 Higher Penetration in Developing Economies with Unreliable Power Grids
- 4.2.4 Rapid adoption of high-capacity laptops and gaming consoles
- 4.2.5 Proliferation of power-bank rental kiosks at transit hubs
- 4.2.6 Integration of GaN fast-charging chipsets in premium models
- 4.3 Market Restraints
- 4.3.1 Inflated counterfeit and sub-standard products eroding trust
- 4.3.2 Incremental gains in native smartphone battery life
- 4.3.3 Stricter UN 38.3 air-cargo limits for Li-ion shipments
- 4.3.4 Early traction of solid-state micro-batteries reducing need for external packs
- 4.4 Supply-Chain Analysis
- 4.5 Regulatory Landscape
- 4.6 Technological Outlook
- 4.7 Porter's Five Forces Analysis
- 4.7.1 Bargaining Power of Suppliers
- 4.7.2 Bargaining Power of Buyers
- 4.7.3 Threat of New Entrants
- 4.7.4 Threat of Substitutes
- 4.7.5 Intensity of Competitive Rivalry
- 4.8 Assesment of Macroeconomic Trends on Market
5 MARKET SIZE AND GROWTH FORECASTS (VALUE)
- 5.1 By Capacity Range
- 5.1.1 Up to 3,000 mAh
- 5.1.2 3,001 - 8,000 mAh
- 5.1.3 8,001 - 20,000 mAh
- 5.1.4 20,001 - 30,000 mAh
- 5.1.5 Above 30,000 mAh
- 5.2 By Charging Technology
- 5.2.1 Wired
- 5.2.2 Wireless
- 5.3 By Application
- 5.3.1 Smartphones and Tablets
- 5.3.2 Laptops and Gaming Consoles
- 5.3.3 Wearables and IoT Devices
- 5.3.4 Cameras and Drones
- 5.3.5 Other Devices (e-cigarettes, routers, medical)
- 5.4 By Distribution Channel
- 5.4.1 Online
- 5.4.2 Offline
- 5.5 By Geography
- 5.5.1 North America
- 5.5.1.1 United States
- 5.5.1.2 Canada
- 5.5.1.3 Mexico
- 5.5.2 South America
- 5.5.2.1 Brazil
- 5.5.2.2 Argentina
- 5.5.2.3 Rest of South America
- 5.5.3 Europe
- 5.5.3.1 Germany
- 5.5.3.2 United Kingdom
- 5.5.3.3 France
- 5.5.3.4 Italy
- 5.5.3.5 Rest of Europe
- 5.5.4 Asia-Pacific
- 5.5.4.1 China
- 5.5.4.2 Japan
- 5.5.4.3 South Korea
- 5.5.4.4 India
- 5.5.4.5 Rest of Asia-Pacific
- 5.5.5 Middle East and Africa
- 5.5.5.1 Middle-East
- 5.5.5.1.1 Saudi Arabia
- 5.5.5.1.2 United Arab Emirates
- 5.5.5.1.3 Turkey
- 5.5.5.1.4 Rest of Middle-East
- 5.5.5.2 Africa
- 5.5.5.2.1 South Africa
- 5.5.5.2.2 Egypt
- 5.5.5.2.3 Nigeria
- 5.5.5.2.4 Rest of Africa
- 5.5.1 North America
6 COMPETITIVE LANDSCAPE
- 6.1 Market Concentration
- 6.2 Strategic Moves
- 6.3 Market Share Analysis
- 6.4 Company Profiles (includes Global level Overview, Market level overview, Core Segments, Financials as available, Strategic Information, Market Rank/Share, Products and Services, Recent Developments)
- 6.4.1 Anker Innovations Ltd.
- 6.4.2 Xiaomi Corporation
- 6.4.3 Samsung Electronics Co., Ltd.
- 6.4.4 Shenzhen Haopai Electronics (RAVPower)
- 6.4.5 Lenovo Group Ltd.
- 6.4.6 Sony Group Corporation
- 6.4.7 Koninklijke Philips N.V.
- 6.4.8 ADATA Technology Co., Ltd.
- 6.4.9 Panasonic Energy Co., Ltd.
- 6.4.10 Huawei Technologies Co., Ltd.
- 6.4.11 ZAGG Inc. (mophie)
- 6.4.12 Belkin International
- 6.4.13 UGREEN Group Ltd.
- 6.4.14 Baseus Technology Co., Ltd.
- 6.4.15 Syska Mobile Accessories
- 6.4.16 Ambrane India Pvt. Ltd.
- 6.4.17 Intex Technologies (India) Ltd.
- 6.4.18 Aukey Technology Co., Ltd.
- 6.4.19 Zendure USA Inc.
- 6.4.20 EcoFlow Inc.
7 MARKET OPPORTUNITIES AND FUTURE OUTLOOK
- 7.1 White-space and Unmet-Need Assessment
 行动电源市场按类型、输出容量、分销管道、最终用户和电池类型划分-2025-2032 年全球预测
 2025年全球行动电池市场报告2025年全球行动电源市场报告
 碳性电池组市场-全球产业规模、份额、趋势、机会和预测(按类型、按容量、按最终用途、按地区和按竞争细分,2020-2030 年)
 日本行动电源市场报告(按产品类型、电池类型、额定功率、应用和地区)2025-2033
 全球露营行动电源市场露营行动电源市场 - 全球产业规模、份额、趋势、机会和预测,细分,按产品类型、按容量、按最终用户、按配销通路、按地区、按竞争,2020-2030F
 露营行动电源市场:按产品类型、按容量、按输出连接埠数量、按最终用户、按分销管道、按地区
 全球碳电池组市场研究报告-产业分析、规模、份额、成长、趋势与预测 2025 年至 2033 年行动电源市场 - 全球产业规模、份额、趋势、机会和预测,按容量、电池类型、应用、最终用户、地区、竞争进行细分,2020-2030F