


 |
市场调查报告书
商品编码
1851159
折迭式智慧型手机:市场占有率分析、产业趋势、统计数据和成长预测(2025-2030 年)Foldable Smartphone - Market Share Analysis, Industry Trends & Statistics, Growth Forecasts (2025 - 2030) |
||||||
※ 本网页内容可能与最新版本有所差异。详细情况请与我们联繫。
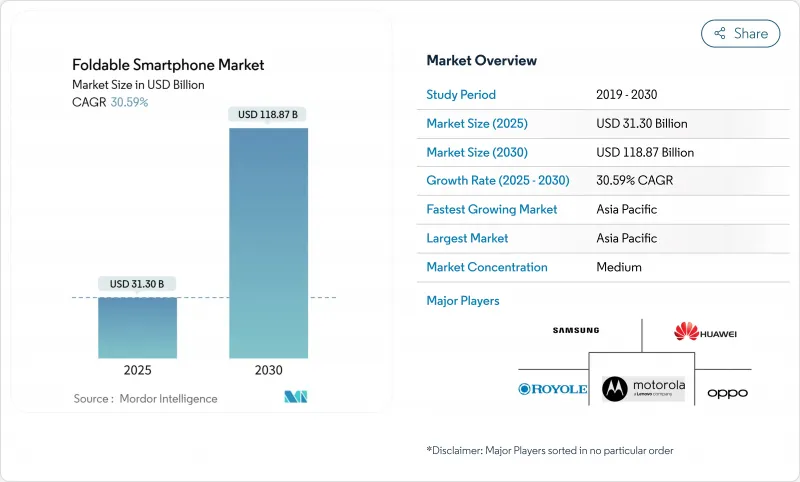
预计到 2025 年,折迭式智慧型手机市场规模将达到 313 亿美元,到 2030 年将达到 1,188.7 亿美元,预测期内(2025-2030 年)复合年增长率为 30.59%。
超薄玻璃 (UTG) 製造、铰链工程和麵板产量比率的进步正在降低单位成本并提高耐用性。亚太地区是供需的主要驱动力,中国 OEM 厂商正在扩大多代生产线产能,而韩国显示器製造商则在保护其製程技术。儘管传统智慧型手机的成长速度已放缓至个位数,但营运商主导的设备补贴和高端 5G 套餐、企业对以生产力为中心的应用场景日益增长的兴趣以及不断扩大的内容串流伙伴关係,都在推动 5G 的普及。製造商们正在为注重时尚的消费者改进泡壳设计,为注重生产力的消费者推出书本式旗舰机型,并投资研发三折屏原型机,以确保下一波外形规格创新浪潮的到来。
全球折迭式智慧型手机市场趋势与洞察
快速提高UTG产量比率
持续的製程改进提高了UTG(超薄玻璃)的产量比率,从而创造出更坚固的保护层。三星最新一代Galaxy Z系列采用可承受超过20万次折迭的强化玻璃,而摩托罗拉2025款Razr系列则采用钛金属骨架,铰链耐用性提升35%,并获得IP48级防水防尘认证。可靠性里程碑的达成降低了消费者的犹豫,随着废品率的降低和产量的提高,产品价格区间的进一步扩大也为更广泛的细分市场铺平了道路。
通讯业者对高端5G套餐的补贴
通讯业者门市仍占折迭式行动电话销量的60%,因为分期付款计画加上高ARPU值的5G套餐抵销了最终用户的价格溢价。典型的补贴计画在24个月的合约期间将零售价降低30%至45%,从而提高用户留存率并鼓励用户增加数据流量,因为折迭式行动电话用户观看影片的流量是行动电话用户的1.8倍。这种策略在北美和欧洲尤其有效,因为这些地区无限费率方案的普及率已经很高,这为营运商提供了利润空间和行销优势,使其能够将折迭式手机定位为5G升级週期中的理想选择。
折迭自行车铰链在潮湿热带气候下低于 20 万公里
高相对湿度会加速铰链销和柔性黏合层的腐蚀,导致使用寿命低于实验室额定的20万次循环,并引发用户在购买后18个月内申诉。原始设备製造商(OEM)正透过采用防腐蚀合金和奈米涂层等措施来应对这一问题,但这些升级会增加材料成本,并使散热预算更加复杂。儘管智慧型手机更换率很高,但由于难以在耐用性和价格之间取得平衡,印尼、泰国和巴西等沿海地区的智慧型手机普及率低于平均水平。
细分市场分析
到2024年,图书将占全球出货量的62%,在折迭式智慧型手机市场中占有重要份额。平板电脑等级的7-8吋内建显示器支援三萤幕多工处理和触控笔友善绘图介面,使其区别于一体式超薄装置。三星Galaxy Z Fold系列和华为Mate X系列是推动这一市场主导地位的主要力量,这两款产品都瞄准了金融、设计以及早期嚐鲜消费者等电力用户群。翻盖泡壳细分市场正以预计33.4%的复合年增长率快速增长,它们凭藉亲民的建议零售价和人们对翻盖手机人体工学设计的怀旧情怀,吸引着追求时尚的消费者。
一款计划于2025年限量生产的三折迭原型机,其内部面板尺寸预计将扩展至10英寸,从而在不影响核心机型的情况下增加收入。向外折迭的设计仍受限于保护裸露柔性矩阵免受磨损的工程难题。儘管目前仍在进行试验,但预计到2030年,折迭式智慧型手机市场(与书籍市场并列)的规模将超过650亿美元,而泡壳的强劲销量增长将缩小两者之间的差距,并巩固未来产品组合的双支柱结构。
到2024年,7至8吋面板将占全球出货量的55%,这体现了笔记型电脑般的生产力和折迭式后单手携带的便利性之间的完美平衡。 OEM厂商的蓝图显示,主动式显示器仍将青睐此频宽,因为它们每平方英吋的毛利率最高。随着复杂的多齿轮铰链的简化和聚合物背板刚性的增强,8英寸以上的显示器将以32.5%的复合年增长率增长,从而减少摺痕。
萤幕尺寸小于等于 6.9 吋的翻盖手机在时尚和年轻群体中仍然颇具吸引力,因为便携性和色彩搭配的配件比单纯的萤幕空间更重要。然而,更大的萤幕更能吸引高 ARPU 内容合作伙伴。预计到 2030 年,萤幕尺寸大于 8 吋的手机将占据折迭式智慧型手机市场 23% 的份额,但由于价格竞争加剧,其收入份额仍将落后于其他机型。
区域分析
亚太地区预计到2024年将占全球出货量的68%,其在显示器製造、铰链锻造和UTG抛光等方面的垂直整合将确保其区域领先地位。中国既支撑着供应,也满足了国内需求,本土OEM厂商利用省级补贴扩大其8.6代OLED工厂规模,实现了规模经济。韩国凭藉强大的5G网路覆盖范围和三星本土品牌的股权,拥有全球最高的人均折迭式萤幕设备普及率。日本延续了紧凑型手机的传统,倾向于更小巧的泡壳设备,而印度的普及率则因相对于平均可支配收入而言过高的价格而受到限制,但都市区的发展势头依然强劲。
北美在全球排名第二,主要得益于营运商积极的补贴政策,有效抵销了前期成本。美国在通讯方面领先,这得益于无限流量套餐的普及以及对高端5G体验的大力行销。加拿大虽然绝对规模较小,但落后美国。拉丁美洲的5G普及主要集中在巴西和墨西哥,这两个国家的富裕都市区消费者追求的是彰显身分的设备。
欧洲市场呈现出多元化的格局:北欧和西方市场,例如德国、法国和英国,已经广泛采用书本式折迭式以提高生产力,而南方市场仍然对成本较为敏感,转型速度缓慢。在中东,波湾合作理事会国家展现出对高端产品的需求,将折迭式包定位为生活方式旗舰产品。非洲(南非的城市丛集除外)仍处于发展阶段,虽然受到购买力平价的限制,但随着售价低于1000美元的折迭萤幕手机日益普及,也看到了市场机会。亚太地区在2030年前将继续扩大其折迭式萤幕智慧型手机的市场份额,但未来的成长将越来越依赖北美和西欧的企业采购以及新兴市场中价格分布的选择。
其他福利:
- Excel格式的市场预测(ME)表
- 3个月的分析师支持
目录
第一章 引言
- 调查先决条件
- 调查范围
第二章调查方法
第三章执行摘要
第四章 市场情势
- 市场概览
- 市场驱动因素
- 超薄玻璃产量比率率的快速提高
- 营运商针对高端 5G 套餐的补贴策略
- 物流领域对支援现场生产力提升应用程式的可折迭设备的企业需求
- 需要更宽宽比的内容串流伙伴关係长宽比
- 柔性AMOLED面板单价下降
- 市场限制
- 在潮湿的热带地区,铰链的耐久性问题可能出现在低于 20 万公里的里程中。
- 针对多视窗折迭式使用者介面的应用最佳化有限
- UTG和铰链零件供应链瓶颈(2023年后台湾大地震)
- 价值/供应链分析
- 监理展望
- 技术展望
- 折迭式智慧型手机科技场景
- 折迭式显示面板概述
- 折迭式智慧型手机转换能力
- 兰德投资与产业政策
- 折迭式智慧型手机相容性
- 软体相容性
- 硬体相容性
- 波特五力分析
- 新进入者的威胁
- 买方/消费者的议价能力
- 供应商的议价能力
- 替代品的威胁
- 竞争对手之间的竞争
第五章 市场规模与成长预测
- 按外形规格
- 泡壳(垂直折迭)
- 书籍装帧(横向折迭)
- 外折迭
- 旋转性/滑出式
- 按萤幕尺寸
- 6.9 英吋或更小
- 7-8英寸
- 8吋或以上
- 价格分布范围
- 不到1000美元
- 1,000-1,499 美元
- 1500-1999美元
- 超过2000美元
- 按销售管道
- 承运商/运营商商店
- 消费性电子产品和专业零售
- 电子商务/直接面向消费者
- 最终用户
- 消费者
- 公司/企业
- 政府/国防
- 按地区
- 北美洲
- 美国
- 加拿大
- 墨西哥
- 南美洲
- 巴西
- 其他南美洲
- 欧洲
- 德国
- 英国
- 法国
- 义大利
- 西班牙
- 北欧国家
- 其他欧洲地区
- 中东
- 沙乌地阿拉伯
- 阿拉伯聯合大公国
- 其他中东地区
- 非洲
- 南非
- 奈及利亚
- 其他非洲地区
- 亚太地区
- 中国
- 日本
- 韩国
- 印度
- 新加坡
- 澳洲
- 亚太其他地区
- 北美洲
第六章 竞争情势
- 市场集中度
- 策略趋势
- 市占率分析
- 公司简介
- Samsung Electronics Co. Ltd.
- Huawei Technologies Co. Ltd.
- Motorola Mobility LLC(Lenovo)
- Xiaomi Corp.
- Oppo Co. Ltd.
- vivo Communication Technology Co. Ltd.
- Royole Corp.
- Honor Device Co. Ltd.
- TCL Technology Group Corp.
- ZTE Corporation
- Google LLC
- Microsoft Corp.
- Sony Corp.
- LG Electronics Inc.
- Apple Inc.
- TECNO Mobile Ltd.
- OnePlus Technology(Shenzhen)Co. Ltd.
- Energizer Holdings Inc.
- Sharp Corp.
- BOE Technology Group Co. Ltd.
- Visionox Technology Inc.
- Kyocera Corp.
第七章 市场机会与未来展望
The Foldable Smartphone Market size is estimated at USD 31.30 billion in 2025, and is expected to reach USD 118.87 billion by 2030, at a CAGR of 30.59% during the forecast period (2025-2030).
Advances in ultra-thin glass (UTG) manufacturing, hinge engineering, and panel yields are bringing unit costs down while improving durability, a combination that is repositioning foldables from niche status to a mainstream upgrade path. Asia Pacific remains the engine of demand and supply, anchored by Chinese OEMs scaling multi-generation line capacity and South Korean display makers safeguarding process know-how. Carrier-led device subsidies tied to premium 5G plans, rising enterprise interest in productivity-focused use cases, and widening content-streaming partnerships are reinforcing adoption momentum even as conventional smartphone growth settles into single-digit territory. Manufacturers are honing clamshell designs for style-driven buyers and launching book-style flagships for productivity enthusiasts, and they are investing in tri-fold prototypes to secure the next wave of form-factor innovation.
Global Foldable Smartphone Market Trends and Insights
Rapid UTG yield-rate gains
Continuous process refinements have raised UTG yield rates and enabled tougher cover layers. Samsung's latest Galaxy Z generation incorporates reinforced glass that tolerates more than 200,000 folds, while Motorola's 2025 Razr family uses a titanium backbone that raises hinge endurance by 35% and carries IP48 water- and dust-resistance certification . Reliability milestones are reducing consumer hesitation and paving the way for broader price segmentation as scrap losses fall, and throughput improves.
Carrier subsidies for premium 5G bundles
Operator stores still control a 60% share of foldable sales because monthly instalments tied to high-ARPU 5G plans neutralize premium pricing for end users. Typical subsidy schemes shave 30 - 45% off retail prices over 24-month contracts, lifting retention rates and stimulating higher data consumption as foldable owners stream 1.8 times more video traffic than slab-phone users. The tactic is especially potent in North America and Europe, where penetration of unlimited-data tariffs is already high, giving carriers both the margin headroom and marketing muscle to position foldables as the aspirational choice for 5G upgrade cycles.
Sub-200 k fold-cycle hinges in humid tropics
High relative humidity accelerates corrosion on hinge pins and flexible adhesive layers, reducing effective life cycles below the laboratory-rated 200,000 folds and triggering client complaints within 18 months of purchase. OEMs are countering with rust-resistant alloys and additional nano-coatings, yet these upgrades raise bill-of-materials costs and complicate thermal budgets. Difficulty in balancing ruggedization with affordability explains the below-average penetration across Indonesia, Thailand, and coastal Brazil, despite high smartphone replacement frequency.
Other drivers and restraints analyzed in the detailed report include:
- Enterprise productivity demand in logistics
- Content-streaming alliances favouring wide AR
- Limited third-party multi-window app optimisation
For complete list of drivers and restraints, kindly check the Table Of Contents.
Segment Analysis
Book-style devices controlled 62% of global shipments in 2024, underpinning a substantial slice of the foldable smartphone market. Their tablet-class 7 - 8-inch internal displays unlock three-pane multitasking and stylus-friendly drawing surfaces that differentiate them from monolithic slabs. This dominance is underpinned by Samsung's Galaxy Z Fold line and Huawei's Mate X series, which both target power users in finance, design, and early-adopter consumer niches. The clamshell sub-segment is expanding at a forecast 33.4% CAGR as it leverages lower MSRP thresholds and nostalgia for flip-phone ergonomics to appeal to fashion-oriented buyers.
Tri-fold prototypes scheduled for limited production in 2025 could stretch internal panels to 10 inches, potentially capturing incremental revenue without cannibalising core models. Outward-fold variants remain constrained by the engineering challenge of protecting exposed flexible matrices from abrasion. Despite the experimentation, the foldable smartphone market size attached to book-style lines is set to stay above USD 65 billion by 2030, while clamshells will narrow the gap through brisk volume gains, reaffirming the dual-pillar architecture of future portfolios.
Panels between 7 and 8 inches accounted for 55% of global shipments in 2024, reflecting a sweet spot that marries laptop-lite productivity with one-hand portability in folded mode. OEM roadmaps indicate a continued preference for this band because it delivers the highest gross margin per square inch of active display. Displays beyond 8 inches will scale at a 32.5% CAGR as complex multi-gear hinges slim down and polymer backplanes stiffen, shrinking crease lines.
Smaller <= 6.9-inch clamshell screens remain attractive in the fashion and youth segments where pocketability and colour-matched accessories trump raw workspace. Nevertheless, larger canvases attract premium ARPU content partnerships. By 2030, the > 8-inch cohort is expected to reach 23% of the foldable smartphone market size, though still lagging in revenue share due to price compression.
The Foldable Smartphone Market Report is Segmented by Form Factor (Clamshell, Book-Style, and More), Screen Size ( Less Than Equal To 6. 9 Inch, 7-8 Inch, and More), Price Range (Less Than USD 1, 000, and More), Sales Channel (Carrier/Operator Stores, Consumer Electronics and Specialty Retail, and More), End User (Consumer, Enterprise/Corporate, and More), and Geography. The Market Forecasts are Provided in Terms of Value (USD).
Geography Analysis
Asia Pacific commanded 68% of 2024 shipments, securing regional leadership through its tight vertical integration of display fabrication, hinge forging, and UTG polishing. China anchors both supply and domestic demand, with local OEMs leveraging provincial subsidies to expand Gen 8.6 OLED fabs and achieve scale economies. South Korea boasts the world's highest per-capita foldable uptake thanks to a robust 5G footprint and Samsung's home-field brand equity. Japan leans toward petite clamshells in keeping with compact handset traditions, while India's adoption pace is gated by premium pricing relative to average disposable income, yet still plots a steep trajectory in metro areas.
North America ranks second globally, driven by aggressive carrier subsidies that neutralise upfront costs. The United States leads volume on the back of broad unlimited-data plan penetration, coupled with a heavy marketing push behind premium 5G experiences. Canada shadows the US curve, albeit at a lower absolute scale. Latin American adoption is concentrated in Brazil and Mexico, where affluent urban consumers seek status devices; however, sticky import tariffs and volatile foreign-exchange conditions temper mass-market momentum.
Europe presents a mosaic picture: Northern and Western markets such as Germany, France, and the UK exhibit productive-use adoption of book-style folds, while Southern markets remain cost-sensitive and slower to migrate. Gulf Cooperation Council states in the Middle East display luxury-driven demand, positioning foldables as lifestyle flagships. Africa remains nascent except for South Africa's urban clusters, constrained by purchasing-power parity yet signalling opportunity once sub-USD 1,000 models proliferate. Collectively, Asia Pacific will continue to raise its foldable smartphone market share through 2030, but incremental growth will increasingly hinge on North American and Western European enterprise purchases and emerging-market affordability plays.
- Samsung Electronics Co. Ltd.
- Huawei Technologies Co. Ltd.
- Motorola Mobility LLC (Lenovo)
- Xiaomi Corp.
- Oppo Co. Ltd.
- vivo Communication Technology Co. Ltd.
- Royole Corp.
- Honor Device Co. Ltd.
- TCL Technology Group Corp.
- ZTE Corporation
- Google LLC
- Microsoft Corp.
- Sony Corp.
- LG Electronics Inc.
- Apple Inc.
- TECNO Mobile Ltd.
- OnePlus Technology (Shenzhen) Co. Ltd.
- Energizer Holdings Inc.
- Sharp Corp.
- BOE Technology Group Co. Ltd.
- Visionox Technology Inc.
- Kyocera Corp.
Additional Benefits:
- The market estimate (ME) sheet in Excel format
- 3 months of analyst support
TABLE OF CONTENTS
1 INTRODUCTION
- 1.1 Study Assumptions
- 1.2 Scope of the Study
2 RESEARCH METHODOLOGY
3 EXECUTIVE SUMMARY
4 MARKET LANDSCAPE
- 4.1 Market Overview
- 4.2 Market Drivers
- 4.2.1 Rapid Advancements in Ultra-Thin Glass Yield Rates
- 4.2.2 Carrier Subsidization Strategies for Premium 5G Plans
- 4.2.3 Enterprise Demand for Foldables to Support Field-Productivity Apps in Logistics Sector
- 4.2.4 Content-Streaming Partnerships Requiring Wider Aspect Ratios
- 4.2.5 Declining Per-Unit Cost of Flexible AMOLED Panels
- 4.3 Market Restraints
- 4.3.1 Sub-200 k Cycle Hinge Durability Concerns in Humid Tropics
- 4.3.2 Limited App Optimization for Multi-window Foldable UI
- 4.3.3 Supply-Chain Bottlenecks for UTG and Hinge Components (Post-2023 Taiwan Quake)
- 4.4 Value/Supply-Chain Analysis
- 4.5 Regulatory Outlook
- 4.6 Technological Outlook
- 4.7 Folding Smartphone Technology Scenario
- 4.7.1 Folding Display Panel Overview
- 4.7.2 Foldable Smartphone Convertibility
- 4.7.3 RandD Investment and Industry Policies
- 4.7.4 Foldable Smartphone Compatibility
- 4.7.4.1 Software Compatibility
- 4.7.4.2 Hardware Compatibility
- 4.8 Porter's Five Forces Analysis
- 4.8.1 Threat of New Entrants
- 4.8.2 Bargaining Power of Buyers/Consumers
- 4.8.3 Bargaining Power of Suppliers
- 4.8.4 Threat of Substitute Products
- 4.8.5 Intensity of Competitive Rivalry
5 MARKET SIZE AND GROWTH FORECASTS (VALUE)
- 5.1 By Form Factor
- 5.1.1 Clamshell (Vertical Fold)
- 5.1.2 Book-Style (Horizontal Fold)
- 5.1.3 Outward Fold
- 5.1.4 Rollable/Slide-out
- 5.2 By Screen Size
- 5.2.1 Less than Equal 6.9 inch
- 5.2.2 7 - 8 inch
- 5.2.3 Greater than to 8 inch
- 5.3 By Price Range
- 5.3.1 Less than USD 1,000
- 5.3.2 USD 1,000 - 1,499
- 5.3.3 USD 1,500 - 1,999
- 5.3.4 Greater than equal USD 2,000
- 5.4 By Sales Channel
- 5.4.1 Carrier/Operator Stores
- 5.4.2 Consumer Electronics and Specialty Retail
- 5.4.3 E-commerce/Direct-to-Consumer
- 5.5 By End User
- 5.5.1 Consumer
- 5.5.2 Enterprise/Corporate
- 5.5.3 Government and Defense
- 5.6 By Geography
- 5.6.1 North America
- 5.6.1.1 United States
- 5.6.1.2 Canada
- 5.6.1.3 Mexico
- 5.6.2 South America
- 5.6.2.1 Brazil
- 5.6.2.2 Rest of South America
- 5.6.3 Europe
- 5.6.3.1 Germany
- 5.6.3.2 United Kingdom
- 5.6.3.3 France
- 5.6.3.4 Italy
- 5.6.3.5 Spain
- 5.6.3.6 Nordics
- 5.6.3.7 Rest of Europe
- 5.6.4 Middle East
- 5.6.4.1 Saudi Arabia
- 5.6.4.2 United Arab Emirates
- 5.6.4.3 Rest of Middle East
- 5.6.5 Africa
- 5.6.5.1 South Africa
- 5.6.5.2 Nigeria
- 5.6.5.3 Rest of Africa
- 5.6.6 Asia-Pacific
- 5.6.6.1 China
- 5.6.6.2 Japan
- 5.6.6.3 South Korea
- 5.6.6.4 India
- 5.6.6.5 Singapore
- 5.6.6.6 Australia
- 5.6.6.7 Rest of Asia-Pacific
- 5.6.1 North America
6 COMPETITIVE LANDSCAPE
- 6.1 Market Concentration
- 6.2 Strategic Moves
- 6.3 Market Share Analysis
- 6.4 Company Profiles (includes Global-level Overview, Market-level Overview, Core Segments, Financials as available, Strategic Info, Market Rank/Share for key companies, Products and Services, Recent Developments)
- 6.4.1 Samsung Electronics Co. Ltd.
- 6.4.2 Huawei Technologies Co. Ltd.
- 6.4.3 Motorola Mobility LLC (Lenovo)
- 6.4.4 Xiaomi Corp.
- 6.4.5 Oppo Co. Ltd.
- 6.4.6 vivo Communication Technology Co. Ltd.
- 6.4.7 Royole Corp.
- 6.4.8 Honor Device Co. Ltd.
- 6.4.9 TCL Technology Group Corp.
- 6.4.10 ZTE Corporation
- 6.4.11 Google LLC
- 6.4.12 Microsoft Corp.
- 6.4.13 Sony Corp.
- 6.4.14 LG Electronics Inc.
- 6.4.15 Apple Inc.
- 6.4.16 TECNO Mobile Ltd.
- 6.4.17 OnePlus Technology (Shenzhen) Co. Ltd.
- 6.4.18 Energizer Holdings Inc.
- 6.4.19 Sharp Corp.
- 6.4.20 BOE Technology Group Co. Ltd.
- 6.4.21 Visionox Technology Inc.
- 6.4.22 Kyocera Corp.
7 MARKET OPPORTUNITIES AND FUTURE OUTLOOK
- 7.1 White-space and Unmet-Need Assessment
 折迭式智慧型手机市场:依显示类型、铰链方向、萤幕大小及销售管道划分-2026-2032年全球市场预测
 折迭式智慧型手机市场-全球产业规模、份额、趋势、机会和预测:按功能、价格范围、销售管道、地区和竞争格局划分,2021-2031年
 折迭式智慧型手机的全球市场
 2025年全球折迭式智慧型手机市场报告可折迭智慧型手机市场 - 全球产业规模、份额、趋势、机会和预测,细分,按显示面板类型、按模式、按配销通路、按地区、按竞争,2020-2030F
 折迭式智慧型手机市场按功能类型、销售管道和地区划分
 折迭式智慧型手机市场规模、份额、趋势分析报告:按功能、分销管道、地区、细分市场预测,2024-2030