


 |
市场调查报告书
商品编码
1851162
过氧乙酸:市场占有率分析、产业趋势、统计、成长预测(2025-2030)Peracetic Acid - Market Share Analysis, Industry Trends & Statistics, Growth Forecasts (2025 - 2030) |
||||||
※ 本网页内容可能与最新版本有所差异。详细情况请与我们联繫。
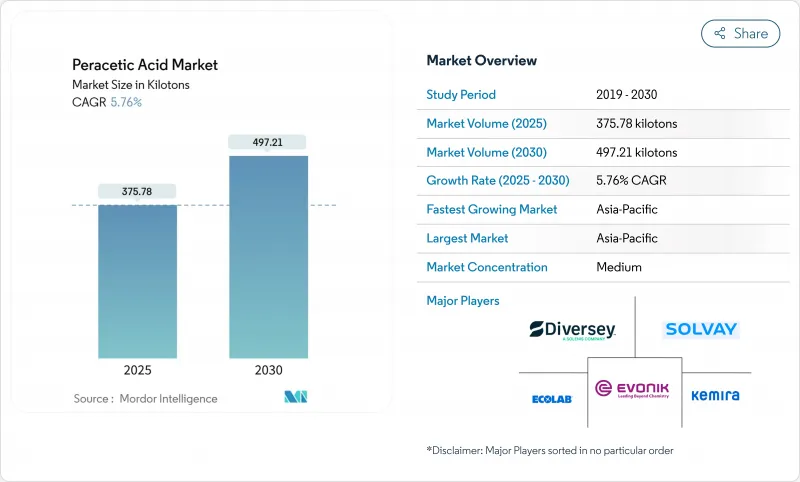
预计到 2025 年,过氧乙酸市场规模将达到 375.78 千吨,到 2030 年将达到 497.21 千吨,在预测期(2025-2030 年)内复合年增长率为 5.76%。
推动这一前景的因素包括:监管政策转向逐步淘汰氯基除生物剂、巴氏杀菌系统的应用以及对水资源再利用基础设施的持续投资。食品加工商对经批准的频谱抗菌剂的需求不断增长,这些抗菌剂用于有机物处理和无残留消毒,进一步推动了销售量成长。生产商也在利用製程创新来稳定水性混合物、降低运输成本并减少工人接触风险。在亚太和北美地区的收购凸显了企业策略转向区域生产基地,以便快速满足高成长终端用户的需求。
全球过氧乙酸市场趋势与洞察
水处理产业的需求不断增长
市政和工业业者正在转向使用过氧乙酸,因为它会分解成乙酸、水和氧气,从而避免产生受监管的消毒副产物。儘管由于2024年饮用水中全氟烷基和多氟烷基物质(PFAS)法规的实施,对残留化学物质的审查力度加大,但初步试验已证实,过氧乙酸在较宽的pH范围内均能有效惰性病毒和原生动物。由于该氧化剂可透过现有的漂白剂供应管线注入,维修成本低,从而降低了资本支出。此外,也有报告指出,过氧乙酸还能减少膜上的生物膜积聚,缩短清洗週期,并延长设备使用寿命。这些性能和合规性优势相结合,将使大型市政系统在2027年之前能够提高平均投加量,尤其是在中国和美国排放标准日益严格的背景下。
促进食品和饮料卫生的食品安全法规
美国农业部有机法规允许使用过氧乙酸进行设备和表面消毒,而美国环保署500ppm的残留豁免规定则消除了传统氯清洗中常见的微生物滞留时间过长的问题。使用干粉或泡沫稳定型过氧乙酸製剂的加工商正在提高肉类和农产品加工厂的生产效率,减少用水量并加快生产线切换速度。研究表明,浓度为100ppm或更低的除生物剂即可有效杀灭沙门氏菌和李斯特菌,并符合洁净标示标准。美国职业安全与健康管理局(OSHA)2024年10月发布的肉类加工指南强调过氧乙酸是一种有效的细菌控制方案,鼓励高风险工厂采用此方案。先前因过氧乙酸保质期短而犹豫不决的小型加工商现在开始购买保质期长达6个月的预稀释袋装系统,这在农村地区催生了新的市场需求。
职业事故及处理问题
美国职业安全与健康管理局 (OSHA) 将过氧乙酸列为高度危险化学品,当库存超过 1000 磅时,必须遵守製程安全法规。过氧乙酸的蒸气阈值值为 1.24 mg/m³,因此相关设施必须安装专用通风系统和连续监测器。规模较小的加工企业有时缺乏实施这些控制规定的资金,导致其实施延迟。在预算允许的情况下,工人必须穿戴经过密合性测试的呼吸器和化学防护个人防护装备 (PPE),这增加了训练成本。过氧乙酸对软金属具有腐蚀性,因此需要使用聚合物或不銹钢管道,这增加了改造成本。虽然自动注射系统减少了直接接触,但保险公司仍会收取高额保费,直到证明多年的事故率处于有利水平为止。
细分市场分析
到2024年,液态过氧乙酸将占过氧乙酸市场68.17%的份额,相当于超过25.5万吨。其可靠性、供应稳定性以及配方简单性是其领先优势的支撑因素。随着市政部门、酪农和饮料生产商采用成熟的饲料系统,液态过氧乙酸市场规模预计将稳定成长。然而,水性混合物的成长速度最快,复合年增长率达5.98%。供应商目前正在配製含有过氧化氢和稳定剂的缓衝过氧乙酸,以将保质期延长至12个月并降低处置成本。混合物的运输浓度较低,因此运输规范要求较低,在农村地区的应用也更广泛。设备製造商正在将这些混合物与线上稀释模组配合使用,以减少工人接触,从而推动其在精酿啤酒厂和分散式水资源再利用装置中的应用。粉末和颗粒则满足了对长期储存和零洩漏运输至关重要的特殊卫生需求,例如在偏远矿区和军用厨房。
技术进步促进了产品形式的多样化。泡沫稳定的喷雾剂可附着于垂直表面,延长孵化场和肉类的接触时间。干粉混合袋可在现场溶解,形成针对性浓度,用于清洁农产品,同时减轻重量和降低运输成本。供应商声称,他们可以将干粉产品分销的碳排放减少20%。在预测期内,不断上涨的能源成本和净零排放目标将促使用户转向浓缩干粉泡沫,儘管需要復溶步骤。整体而言,产品形式的多样化增强了供应商的韧性,并鼓励客製化,但除非监管措施或保险费大幅增加,否则液体产品仍可能保持其大容量优势。
预计到2024年,中等浓度(5-15%)的过氧乙酸将占过氧乙酸市场(约20万吨)的54.17%。此浓度范围的过氧乙酸可达到6-log的微生物杀灭效果,同时低于防爆储存所需的阈值,为使用者提供最佳的成本效益比。饮料灌装机、起司轮和家禽加工厂的喷雾冷却器等设备的需求是推动该市场成长的主要因素,这些设备需要在换班时进行消毒。到2030年,该市场将以6.02%的复合年增长率成长,这主要得益于东南亚新参与企业选择中等浓度包装以满足进口设备的规格要求。低浓度(<5%)的过氧乙酸适用于餐饮连锁店和医用表面擦拭巾等小众即用型包装。高浓度(>15%)的过氧乙酸用于软式内视镜再处理和製药无尘室的散装消毒剂,但其高昂的处理成本限制了其广泛应用。
混配商正在设计添加了防腐蚀添加剂的中级配方,使其能够与铝製输送机和计量泵接触。这种相容性为客户节省了昂贵的升级不銹钢设备的费用。同时,联网计量器会记录浓度数据以审核追踪,从而减轻了美国食品药物管理局 (FDA) 和欧盟的卫生记录要求。这些改进措施提高了转换成本,并导致供应商锁定。儘管原物料价格波动可能挤压净利率,但生产商正透过双重醋酸采购和期货合约进行避险。具有竞争力的价格可见度使中级价差保持在永续的范围内,使其在未来几年内保持稳定。
区域分析
亚太地区,以中国、印度和泰国为首,预计2024年将占全球销售额的38.24%。可支配收入的成长推动了包装食品的需求,而诸如中国GB 31604.1食品接触材料标准等严格法规,正促使加工商转向氯的替代品。日本唯一的生产商正利用非氯技术吸引高纯度电子和製药业的客户。政府对智慧水网的投资也推动了过氧乙酸进入三级消毒阶段。该地区预计6.75%的复合年增长率主要得益于印度和印尼的医院建设。
北美市场虽然仍较成熟,但规模庞大。 2024 年 PFAS 法规和美国环保署 (EPA) 的蒸气灭菌排放提案正促使公用事业公司和医院考虑使用过氧乙酸以符合相关规定。肉类和家禽出口依赖美国)批准的消毒剂,大型加工商通常将化学物质与自动化喷雾柜结合使用。美国创新丛集聚集了多家配方专家,供应干粉级和缓衝级产品。市政再利用计划,例如加州的圣地牙哥纯净水计划,正在推动基准需求。由于维修活动和产品多样化,全部区域的成长接近全球平均水平。
在永续性指令的推动下,欧洲正呈现稳定扩张的态势。斯堪地那维亚的纸浆厂正在引入过氧乙酸漂白过程以获得生态标籤认证,德国和比利时的啤酒厂则采用低发泡混合物进行生产线清洗。欧盟的职业安全指令限制了操作人员的曝射量,并鼓励采用封闭式进料系统。新兴的东欧国家正在凝聚基金的支持下升级市政污水处理设施,并引入过氧乙酸进行二次消毒。儘管目前处理量成长缓慢,但更严格的碳排放和氯排放限制使得相关技术的应用预计在2030年之前进一步推广。
其他福利:
- Excel格式的市场预测(ME)表
- 3个月的分析师支持
目录
第一章 引言
- 研究假设和市场定义
- 调查范围
第二章调查方法
第三章执行摘要
第四章 市场情势
- 市场概览
- 市场驱动因素
- 水处理产业的需求不断增长
- 食品安全法规旨在改善食品和饮料卫生状况
- 医疗设备低温灭菌技术的发展
- 从氯漂白剂转向环保纸浆漂白剂
- 在各行业中作为消毒剂的应用日益广泛
- 市场限制
- 职业危害及应对挑战
- 高成本与氯基替代品
- 前驱乙酸酐的价格波动
- 价值链分析
- 波特五力模型
- 供应商的议价能力
- 买方的议价能力
- 新进入者的威胁
- 替代品的威胁
- 竞争程度
第五章 市场规模与成长预测
- 按产品形式
- 液体溶液
- 粉末/颗粒
- 水性混合物
- 按浓缩级
- <5% PAA(低)
- 5-15% PAA(中)
- PAA含量15%或以上(高)
- 透过使用
- 消毒剂
- 氧化剂
- 消毒器
- 其他用途(漂白、消毒等)
- 按最终用户行业划分
- 食品和饮料加工
- 水处理
- 纸浆和造纸
- 医疗保健(包括药品)
- 化学
- 其他终端用户产业(农业、水产养殖等)
- 按地区(数量)
- 亚太地区
- 中国
- 印度
- 日本
- 韩国
- 亚太其他地区
- 北美洲
- 美国
- 加拿大
- 墨西哥
- 欧洲
- 德国
- 英国
- 法国
- 义大利
- 其他欧洲地区
- 南美洲
- 巴西
- 阿根廷
- 其他南美洲
- 中东和非洲
- 沙乌地阿拉伯
- 南非
- 其他中东和非洲地区
- 亚太地区
第六章 竞争情势
- 市场集中度
- 策略趋势
- 市占率(%)/排名分析
- 公司简介
- ACURO ORGANICS LIMITED
- Aditya Birla Chemicals
- Airedale Group
- Biosan
- Brainerd Chemical
- Christeyns
- Diversey, Inc
- Ecolab
- Enviro Tech Chemical Services, Inc.
- Evonik Industries AG
- Hydrite Chemical
- Jubilant Pharmova Limited
- Kemira
- MITSUBISHI GAS CHEMICAL COMPANY, INC.
- Solvay
- STOCKMEIER Group
第七章 市场机会与未来展望
The Peracetic Acid Market size is estimated at 375.78 kilotons in 2025, and is expected to reach 497.21 kilotons by 2030, at a CAGR of 5.76% during the forecast period (2025-2030).
The outlook benefits from regulatory shifts that discourage chlorine-based biocides, uptake in low-temperature sterilization systems, and ongoing investment in water reuse infrastructure. Rising demand from food processors that require broad-spectrum antimicrobials approved for organic handling and residue-free sanitation further supports volume gains. Producers are also capitalizing on process innovations that stabilize aqueous blends, lower shipping costs, and cut worker exposure risks. Acquisitions in Asia-Pacific and North America underline a strategic pivot toward regional production hubs able to serve high-growth end-uses quickly.
Global Peracetic Acid Market Trends and Insights
Growing Demand From Water Treatment Industry
Municipal and industrial operators are switching to peracetic acid because it breaks down into acetic acid, water, and oxygen, thus avoiding regulated disinfection by-products. The 2024 PFAS drinking-water rule has intensified scrutiny of residual chemicals, and pilot trials confirm that peracetic acid achieves superior virus and protozoa inactivation across wide pH ranges. Retrofit costs stay low because the oxidant can be dosed through existing bleach feed lines, trimming capital outlays. Operators also report lower biofilm build-up in membranes, which reduces cleaning cycles and extends asset life. These performance and compliance benefits combine to raise average dose volumes in large municipal systems, particularly through 2027 when tighter effluent targets phase in across China and the United States.
Food-safety Regulations Boosting Food and Beverage Sanitation
USDA organic rules permit peracetic acid for equipment and surface sanitation, and a 500 ppm residue exemption by the EPA removes microbiological hold-time delays common with legacy chlorine rinses. Processors that adopt dry or foam-stabilized peracetic acid formulations are cutting water usage and achieving quicker line changeovers, which improves throughput in meat and produce facilities. Studies show the biocide is lethal to Salmonella and Listeria at sub-100 ppm doses, supporting clean-label positioning. The October 2024 OSHA guidance for meat-packing highlighted peracetic acid as a validated bacterial control option, accelerating conversions in high-risk plants. Smaller processors, once deterred by short shelf life, now purchase diluted bag-in-box systems with six-month stability, opening new rural demand pockets.
Occupational Hazards and Handling Challenges
OSHA lists peracetic acid among highly hazardous chemicals, triggering process-safety rules at inventories above 1,000 lb. Facilities must install dedicated ventilation and continuous monitors because the vapor threshold limit is 1.24 mg/m3. Small processors sometimes lack capital for these controls, slowing adoption. Even where budgets allow, staff require fit-tested respirators and chemical splash PPE, raising training costs. Corrosivity toward soft metals demands polymer or stainless piping, adding to retrofit expenses. Although automatic dosing systems reduce direct handling, insurers still impose higher premiums until multi-year incident rates prove favorable.
Other drivers and restraints analyzed in the detailed report include:
- Growth in Low-temperature Sterilization of Medical Devices
- Shift From Chlorine to Eco-friendly Pulp-bleaching Agents
- High Cost Versus Chlorine-based Substitutes
For complete list of drivers and restraints, kindly check the Table Of Contents.
Segment Analysis
Liquid solutions represented 68.17% of the peracetic acid market in 2024, equivalent to more than 255 kilo tons. Reliability, supply familiarity, and low formulation complexity sustain this lead. The peracetic acid market size for liquid products is projected to climb steadily as municipalities, dairies, and beverage lines stick with established feed systems. However, aqueous blends are scaling fastest at a 5.98% CAGR. Suppliers now formulate buffered peracetic acid with hydrogen peroxide and stabilizers that extend shelf life up to 12 months, slashing disposal costs. Blends are shipped at lower concentrations, qualifying for less stringent transport codes that widen rural reach. Equipment makers are pairing these blends with inline dilution modules that trim worker exposure, stoking adoption across craft breweries and decentralized water reuse units. Powder and granule formats occupy niche hygiene needs where long storage or zero-spill transport is vital, such as remote mines and military kitchens.
Technological progress supports form diversification. Foam-stabilized sprays cling to vertical surfaces, giving longer contact time in hatcheries and slaughterhouses. Dry-blended sachets dissolve on-site and generate targeted strengths for produce washes, reducing weight and freight. Suppliers claim 20% lower carbon footprints for dry product distribution. Over the forecast window, rising energy costs and net-zero goals should push users toward concentrated dry forms despite reconstitution steps. Overall, form variety strengthens supplier resilience and encourages customization, yet liquids will likely retain bulk dominance until regulatory moves or insurance premiums decisively penalize high-strength storage.
The peracetic acid market reported 54.17% share for the medium (5-15%) range in 2024, roughly 200 kilo tons. This span delivers six-log microbial kill while staying below thresholds that demand explosion-proof storage, giving users the best cost-to-compliance ratio. Demand stems from beverage fillers, cheese wheels, and spray chillers in poultry plants where operators sanitize every shift. The medium segment is set for a 6.02% CAGR through 2030 as new entrants in Southeast Asia choose mid-strength packages that match imported equipment specs. Low ranges under 5% serve ready-to-use niche packs for restaurant chains and medical surface wipes. High ranges above 15% feed bulk sterilizers for flexible endoscope reprocessing and pharmaceutical clean rooms but face handling premiums that limit broad uptake.
Formulators are engineering medium-grade blends with anti-corrosive additives, allowing contact with aluminum conveyors and dosing pumps. This compatibility saves clients from costly stainless upgrades. In parallel, cloud-connected meters log concentration data for audit trails, easing FDA and EU hygiene record mandates. These enhancements raise switching costs and foster supplier lock-in. Although feedstock volatility can squeeze margins, producers hedge with dual acetic acid sourcing and forward contracts. Competitive price visibility keeps medium-grade spreads within sustainable bands, preserving its anchor position in coming years.
The Peracetic Acid Market Report Segments the Industry by Product Form (Liquid Solutions, Powder/Granules, and Aqueous Blends), Concentration Grade (Less Than 5 % PAA (Low), and More), Application (Disinfectant, Oxidizer, and More), End-User Industry (Food and Beverage, Water Treatment, Pulp and Paper, Chemical, and More), and Geography (Asia-Pacific, North America, Europe, South America, and Middle-East and Africa).
Geography Analysis
Asia-Pacific generated 38.24% of global revenue in 2024, led by China, India, and Thailand. Rising disposable incomes spur packaged food demand, while stringent rules such as China's GB 31604.1 food-contact material standard are nudging processors toward chlorine alternatives. Japan's sole producer leverages chlorine-free technology that appeals to high-purity electronics and pharmaceutical clients. Government investments in smart water grids also pull peracetic acid into tertiary disinfection stages. The region's forecast 6.75% CAGR is further backed by hospital construction in India and Indonesia, where low-temperature sterilizers suit power-constrained facilities.
North America remains a mature but sizable market. The 2024 PFAS rule and the EPA's steam sterilization emission proposals are pushing utilities and hospitals to consider peracetic acid for compliance. Meat and poultry exports rely on USDA-approved sanitizers, and large processors often pair the chemistry with automated spray cabinets. Innovation clusters in the United States Midwest house multiple formulation specialists that supply dry or buffered grades. Adoption in municipal reuse schemes like California's Pure Water San Diego project boosts baseline demand. Overall regional growth runs near the global average thanks to retrofit activity and product diversification.
Europe demonstrates stable expansion anchored by sustainability mandates. Scandinavian pulp mills deploy peracetic acid bleaching to secure eco-label status, and breweries in Germany and Belgium integrate low foaming blends for line cleaning. The EU Employment Safety Directive caps operator exposure, encouraging closed-feed systems. Emerging Eastern European members are upgrading municipal treatment works with support from cohesion funds, inserting peracetic acid into secondary disinfection. Although volume gains are moderate at present, tight carbon and chlorine discharge limits provide a long runway for additional uptake through 2030.
- ACURO ORGANICS LIMITED
- Aditya Birla Chemicals
- Airedale Group
- Biosan
- Brainerd Chemical
- Christeyns
- Diversey, Inc
- Ecolab
- Enviro Tech Chemical Services, Inc.
- Evonik Industries AG
- Hydrite Chemical
- Jubilant Pharmova Limited
- Kemira
- MITSUBISHI GAS CHEMICAL COMPANY, INC.
- Solvay
- STOCKMEIER Group
Additional Benefits:
- The market estimate (ME) sheet in Excel format
- 3 months of analyst support
TABLE OF CONTENTS
1 Introduction
- 1.1 Study Assumptions and Market Definition
- 1.2 Scope of the Study
2 Research Methodology
3 Executive Summary
4 Market Landscape
- 4.1 Market Overview
- 4.2 Market Drivers
- 4.2.1 Growing Demand From Water Treatment Industry
- 4.2.2 Food-safety regulations boosting Food and Beverage sanitation
- 4.2.3 Growth in low-temperature sterilization of medical devices
- 4.2.4 Shift from chlorine to eco-friendly pulp-bleaching agents
- 4.2.5 Increasing Usage as A Disinfectant Across Various Industries
- 4.3 Market Restraints
- 4.3.1 Occupational hazards and handling challenges
- 4.3.2 High cost versus chlorine-based substitutes
- 4.3.3 Precursor acetic-anhydride price volatility
- 4.4 Value Chain Analysis
- 4.5 Porter's Five Forces
- 4.5.1 Bargaining Power of Suppliers
- 4.5.2 Bargaining Power of Buyers
- 4.5.3 Threat of New Entrants
- 4.5.4 Threat of Substitute Products and Services
- 4.5.5 Degree of Competition
5 Market Size and Growth Forecasts (Volume)
- 5.1 By Product Form
- 5.1.1 Liquid Solutions
- 5.1.2 Powder/Granules
- 5.1.3 Aqueous Blends
- 5.2 By Concentration Grade
- 5.2.1 Less than 5 % PAA (Low)
- 5.2.2 5-15 % PAA (Medium)
- 5.2.3 More than 15 % PAA (High)
- 5.3 By Application
- 5.3.1 Disinfectant
- 5.3.2 Oxidizer
- 5.3.3 Sterilant
- 5.3.4 Other Apllications (Bleaching Agent, Sanitizer, etc.)
- 5.4 By End-user Industry
- 5.4.1 Food and Beverage Processing
- 5.4.2 Water Treatment
- 5.4.3 Pulp and Paper
- 5.4.4 Healthcare (inc. Pharmaceutical)
- 5.4.5 Chemical
- 5.4.6 Other End-user Industries (Agriculture and Aquaculture, etc.)
- 5.5 By Geography (Volume)
- 5.5.1 Asia-Pacific
- 5.5.1.1 China
- 5.5.1.2 India
- 5.5.1.3 Japan
- 5.5.1.4 South Korea
- 5.5.1.5 Rest of Asia-Pacific
- 5.5.2 North America
- 5.5.2.1 United States
- 5.5.2.2 Canada
- 5.5.2.3 Mexico
- 5.5.3 Europe
- 5.5.3.1 Germany
- 5.5.3.2 United Kingdom
- 5.5.3.3 France
- 5.5.3.4 Italy
- 5.5.3.5 Rest of Europe
- 5.5.4 South America
- 5.5.4.1 Brazil
- 5.5.4.2 Argentina
- 5.5.4.3 Rest of South America
- 5.5.5 Middle East and Africa
- 5.5.5.1 Saudi Arabia
- 5.5.5.2 South Africa
- 5.5.5.3 Rest of Middle-East and Africa
- 5.5.1 Asia-Pacific
6 Competitive Landscape
- 6.1 Market Concentration
- 6.2 Strategic Moves
- 6.3 Market Share(%)/Ranking Analysis
- 6.4 Company Profiles (includes Global level Overview, Market level overview, Core Segments, Financials as available, Strategic Information, Market Rank/Share for key companies, Products and Services, and Recent Developments)
- 6.4.1 ACURO ORGANICS LIMITED
- 6.4.2 Aditya Birla Chemicals
- 6.4.3 Airedale Group
- 6.4.4 Biosan
- 6.4.5 Brainerd Chemical
- 6.4.6 Christeyns
- 6.4.7 Diversey, Inc
- 6.4.8 Ecolab
- 6.4.9 Enviro Tech Chemical Services, Inc.
- 6.4.10 Evonik Industries AG
- 6.4.11 Hydrite Chemical
- 6.4.12 Jubilant Pharmova Limited
- 6.4.13 Kemira
- 6.4.14 MITSUBISHI GAS CHEMICAL COMPANY, INC.
- 6.4.15 Solvay
- 6.4.16 STOCKMEIER Group
7 Market Opportunities and Future Outlook
- 7.1 White-space and Unmet-Need Assessment
- 7.2 Increasing Usage In Aseptic Packaging Applications
 过氧乙酸市场:全球市场按等级、形态、浓度、包装、应用和分销管道分類的预测-2026-2032年
 过氧乙酸市场分析及预测(至2035年):类型、产品、应用、终端用户、形态、技术、製程、材料类型、功能、设备
 过氧乙酸市场报告:依等级、应用、终端用户产业及地区划分(2026-2034年)
 2026年过氧乙酸全球市场报告
 过氧乙酸市场 - 全球产业规模、份额、趋势、机会及预测(按等级、应用、最终用途产业、地区和竞争格局划分,2021-2031年)
 过氧乙酸市场机会、成长要素、产业趋势分析及2026年至2035年预测日本过氧乙酸市场报告:依等级、应用、终端用户产业及地区划分(2026-2034年)
 过氧乙酸市场规模、份额及成长分析(按等级、应用、最终用途及地区划分)-2026-2033年产业预测
 全球过氧乙酸市场(按等级、应用、最终用途产业、形式和地区划分)- 预测至 2030 年
 过氧乙酸市场,规模,占有率,趋势,产业分析报告:各等级,各用途,各最终用途,各地区,2025年~2034年的市场预测