


 |
市场调查报告书
商品编码
1851166
智慧插座:市场占有率分析、产业趋势、统计数据和成长预测(2025-2030 年)Smart Plug - Market Share Analysis, Industry Trends & Statistics, Growth Forecasts (2025 - 2030) |
||||||
※ 本网页内容可能与最新版本有所差异。详细情况请与我们联繫。
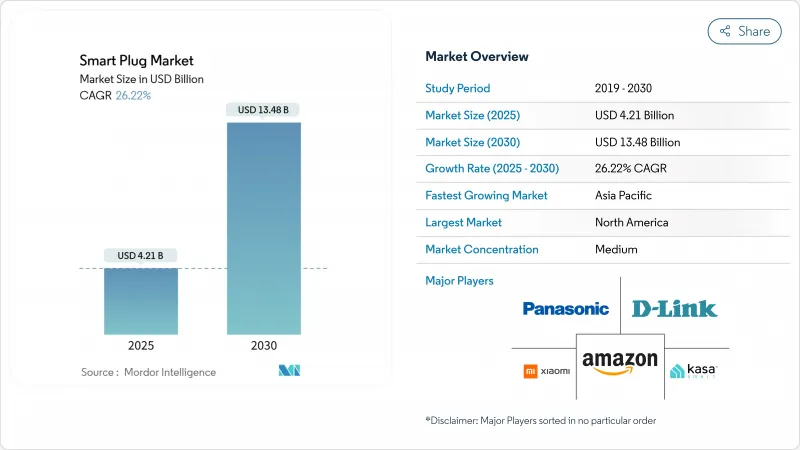
预计到 2025 年,智慧插座市场规模将达到 42.1 亿美元,到 2030 年将达到 134.8 亿美元,复合年增长率为 26.22%。
这项加速发展得益于以下因素:强制性能效法规将插座负载控制纳入建筑规范标准;Wi-Fi晶片组价格迅速下降,使得零售标籤价格低于10美元;以及Matter 1.3互通性标准打破了长期存在的生态系统壁垒。超低功耗的Wi-Fi 6微控制器(MCU)也将待机功耗降低至微安培级,从而实现了长达数年的电池寿命。审核显示,每个设施每年浪费的插座负载高达36.8千瓦,这进一步激发了业界对智慧插座的兴趣,使其成为领先的节能维修。亚太地区在印度的Alexa设备连接数量增加了三倍,而本地晶片组供应商正在降低本土品牌的材料成本。
全球智慧插座市场趋势与洞察
语音助理生态系统正在迅速扩展
亚马逊报告称,未来三年内,印度的智慧家居设备销售将成长200%。其将于2025年推出的Alexa+人工智慧服务,每月收费19.99美元,并与亚马逊Prime会员捆绑销售,这将重新定义智慧家庭的价值提案,使其不再局限于简单的开关功能,而是能够实现多设备场景的编配。订阅模式鼓励用户更深入参与,并将智慧插座定位为基础节点,从而将语音助理的功能扩展到传统家电。 Alexa产品目录中拥有超过14万种相容设备,其网路效应降低了用户接受智慧家庭的门槛,并提高了各个收入阶层的用户使用率。谷歌和苹果也采取了类似的策略,它们越来越意识到,语音控制已成为所有新型插电设备的基本功能。
Wi-Fi晶片组ASP下降
Silicon Labs 的 SiWx917 MCU 将连接睡眠电流降低至 22 微安培,Synaptics降低了物料成本,并使其零售价低于 15 美元,同时又不牺牲能耗报告功能。 Synaptics 和中国新晋厂商 AIC Micro 正在进入价值 32 亿美元的超低功耗物联网 SoC 市场,加剧了价格竞争,并扩大了供应商选择。大规模生产使得 ODM 厂商能够在紧凑的机壳中整合双 Wi-Fi/BLE 模组,同时保留支援 Matter 的韧体。新兴市场将从中受益最多,因为该产品的经济性使其更符合中等收入家庭的需求,从而扩大了装置量,使其不再局限于早期用户。
持久性设备网路安全漏洞
预计到2024年,针对智慧型装置的网路攻击将增加一倍以上,各大品牌都面临严重的安全漏洞,损害了消费者的信任。 TP-Link揭露的本地通讯漏洞以及Mars Hydro事件(该事件导致27亿个物联网记录外洩)凸显了系统性风险。美国通讯委员会(FCC)在亚马逊和谷歌的支持下,计划设立「网路信任标誌」(Cybertrust Mark),并承诺提供更清晰的标籤,但最终规则尚未实施。产品召回事件,例如Emporia Energy因触电危险召回8万个智慧插头,显示了安全管理不善造成的经济损失。在认证成为强制性要求之前,挥之不去的疑虑可能会推迟消费者的首次购买,尤其是在拥有严格IT政策的专业管理机构中。
细分市场分析
儘管蓝牙在2024年仍将以31.7%的市占率保持智慧插座市场最大份额,但受Matter认证的推动,Zigbee/Thread通讯协定正以26.8%的复合年增长率加速成长。随着Thread 1.4增强的凭证共用支援企业级部署,支援Thread的智慧插座市场规模预计将呈指数级增长。涂鸦智慧的15天承包模组专案展示了标准化如何加快产品上市速度并降低工程难度。 Wi-Fi主导优势实现了普及,并在频宽密集型应用场景(例如高分辨率电能计量)中表现出色,而Z-Wave在美国的传统安防系统中仍然占据重要地位。随着消费者寻求跨平台购买,专有协定堆迭面临被淘汰的风险。
Thread 的即时能源彙报为公用事业公司在需量反应方面提供了明显的优势。透过 Matter 1.3,智慧插座现在可以将即时能耗数据传输到更广泛的家庭能源管理仪表板中。因此,公用事业公司的补贴开始倾向于支持 Thread 的硬件,这促使安装商放弃仅支援 Wi-Fi 的产品。在 Thread 的低延迟网状网路之上迭加能源分析功能的供应商可以收取更高的平均售价,从而缓解同质化产品类别中利润率下降的困境。
到2024年,住宅建筑仍将占据智慧插座市场56.2%的份额,这主要得益于语音助理和DIY便利性的普及。然而,随着设施管理人员追求量化收益,工业和商业建筑预计将以27.7%的复合年增长率成长。实地研究表明,应用物联网调度技术后,每个场所每年可节省36.8千瓦的插座负载。Honeywell面向企业楼宇管理系统的插座负载模组体现了向数据主导能源合规的转变。
在工厂和仓库中,工业级智慧插座具备住宅设备所不具备的热过载保护和过电流分析功能。医院和养老机构也开始部署智慧插座,用于监测医疗设备的运作,防止意外断电,这得益于政府针对老龄化社会远端监控的补贴计画。商业性对具备服务等级协定(SLA)保障的硬体的需求推高了价格分布,并扩大了专业OEM厂商可触及的智慧插座市场。
智慧插座市场按技术(蓝牙、Wi-Fi、其他)、应用(住宅、商业、其他)、销售管道(线上、线下)、插头外形(墙壁插座适配器、墙内插座、其他)和地区进行细分。市场预测以美元计价。
区域分析
北美地区将在2024年继续维持32.1%的领先地位,这主要得益于能源之星安全、健康、环境和管理系统(SHEMS)法规以及宽频的广泛普及。该地区语音助理的成熟应用将增强生态系统的稳定性,降低客户流失率,并促进全屋维修。加拿大能源效率法规的更新与美国标准接轨,为製造商提供了统一的北美认证蓝图。
亚太地区预计将以28.3%的复合年增长率成长,成为智慧插座市场成长最快的地区。自2022年以来,在地化的语音助理方言支援和具有竞争力的价格,使得印度Alexa设备的数量增加了两倍。中国自主研发的晶片组降低了物料清单的差异性,并促进了白牌产品的普及。日本和韩国政府资助的智慧城市试点项目,正在将插座级能源监测整合到区域碳排放仪錶板中,推动了机构对Thread Mesh部署的需求。
在欧洲,情况则是喜忧参半。 WEEE指令2024/884规定了淘汰旧设备的成本,挤压了製造商的毛利率。另一方面,英国2025年智慧家电法规要求设备具备电网感知能力,扩大了可受惠于加装Matter智慧插头的设备范围。涂鸦智慧伦敦改装论坛强调了低成本插头在老旧住宅存量实现净零排放目标方面所能发挥的作用。
南美洲、中东和非洲的5G装机量虽然落后,但随着5G网路部署改善延迟和覆盖范围,这些地区的成长率已达两位数。高额进口关税仍然是一大障碍,促使当地企业组装合资企业,利用该地区的自由贸易区。开发商正与波湾合作理事会的连锁饭店合作,试验集中式能源控制面板,展示智慧插座如何作为更广泛的物联网基础设施的闸道产品。
其他福利:
- Excel格式的市场预测(ME)表
- 3个月的分析师支持
目录
第一章 引言
- 研究假设和市场定义
- 调查范围
第二章调查方法
第三章执行摘要
第四章 市场情势
- 市场概览
- 市场驱动因素
- 语音助理生态系统采用率激增
- Wi-Fi晶片组ASP下降
- 政府强制推行插电式负载控制能效
- 事项 1.3 促进互通性
- 老年人护理远端监测补助计划
- 对户外防风雨插头的需求不断增长
- 市场限制
- 持久性设备网路安全漏洞
- 新兴市场射频频谱碎片化
- 欧盟废弃电子电气设备回收成本对利润率造成压力。
- 不准确的能量测量读数会引发回忆
- 供应链分析
- 监管环境
- 技术展望
- 波特五力分析
- 供应商的议价能力
- 买方的议价能力
- 新进入者的威胁
- 替代品的威胁
- 竞争对手之间的竞争
- 评估市场宏观经济趋势
第五章 市场规模与成长预测
- 透过技术
- Wi-Fi
- Bluetooth
- Zigbee/Thread
- Z-Wave
- 其他的
- 透过使用
- 住房
- 商业的
- 工业
- 其他(旅馆业、医疗保健业)
- 按销售管道
- 在线的
- 离线
- 按插头外形规格
- 墙插转接器
- 壁挂式插座
- 电源分接头
- 其他的
- 按地区
- 北美洲
- 美国
- 加拿大
- 墨西哥
- 南美洲
- 巴西
- 阿根廷
- 其他南美洲
- 欧洲
- 德国
- 英国
- 法国
- 义大利
- 其他欧洲地区
- 亚太地区
- 中国
- 日本
- 韩国
- 印度
- 亚太其他地区
- 中东和非洲
- GCC
- 土耳其
- 南非
- 其他中东和非洲地区
- 北美洲
第六章 竞争情势
- 市场集中度
- 策略趋势
- 市占率分析
- 公司简介
- TP-Link Technologies
- Belkin(WeMo)
- Xiaomi
- D-Link
- Panasonic
- Amazon(First-Party)
- Broadlink
- Ankuoo
- EDIMAX
- Vesync(Etekcity, Levoit, Cosori)
- Lenovo
- Leviton
- Wipro
- Sariana(Satechi)
- Sonoff(ITEAD)
- Shelly
- Gosund/Nooie
- Eve Systems
- Aeotec
- Sengled
- Wyze Labs
第七章 市场机会与未来展望
The smart plug market stands at USD 4.21 billion in 2025 and is on course to reach USD 13.48 billion in 2030, charting a 26.22% CAGR.
This acceleration stems from mandatory energy-efficiency rules that make plug-load controls a building-code staple, the rapid decline of Wi-Fi chipset prices that brings sub-USD 10 retail tags into play, and the Matter 1.3 interoperability standard that dissolves long-standing ecosystem silos. Voice-assistant ecosystems now anchor purchasing decisions, while ultra-low-power Wi-Fi 6 MCUs shrink standby draw to micro-amp levels and enable multi-year battery use. Rising industrial interest, driven by audits showing up to 36.8 kW in annual plug-load waste per facility, positions smart plugs as a frontline efficiency retrofit. Regional momentum tilts toward Asia Pacific, where Alexa device connections have tripled in India and local chipset suppliers cut bill-of-materials costs for domestic brands.
Global Smart Plug Market Trends and Insights
Soaring Adoption of Voice-Assistant Ecosystems
Voice control has shifted from novelty to necessity as Amazon reports a 200% jump in connected smart-home devices in India within three years. The 2025 debut of the USD 19.99-per-month Alexa+ generative-AI service, bundled into Prime, redefines the value proposition from simple on/off switching to multi-device scene orchestration. Subscription economics incentivize deeper engagement, positioning smart plugs as foundational nodes that extend voice-assistant reach to legacy appliances. With more than 140,000 compatible devices in the Alexa catalogue, network effects reduce adoption friction and lift attach rates across income bands. Comparable strategies from Google and Apple reinforce the perception that voice-ready control is now the baseline expectation for every new plug-in device.
Falling ASPs of Wi-Fi Chipsets
Silicon Labs' SiWx917 MCU trims connected-sleep current to 22 micro amp, slicing component costs and enabling sub-USD 15 retail pricing without sacrificing energy reporting features. Synaptics and Chinese newcomer AIC Micro have entered the USD 3.2 billion ultra-low-power IoT SoC arena, intensifying price competition and widening vendor choice. Mass-market volumes allow ODMs to package dual Wi-Fi/BLE modules inside compact casings while retaining Matter-ready firmware. Emerging economies benefit most, as unit economics now align with middle-income household budgets, expanding the install base beyond early adopters.
Persistent Device Cybersecurity Breaches
Smart-device cyberattacks more than doubled in 2024, eroding consumer trust as high-profile flaws surfaced in major brands. TP-Link's exposure of local-communication vulnerabilities and the Mars Hydro incident that leaked 2.7 billion IoT records underscore systemic risk. The U.S. FCC's upcoming Cyber Trust Mark, backed by Amazon and Google, promises clearer labeling but final rules are not yet in force. Product recalls such as Emporia Energy's withdrawal of 80,000 smart plugs due to shock hazards illustrate the financial toll of insufficient security controls. Until certification regimes become mandatory, lingering doubts may slow first-time purchases, especially in professionally managed facilities with stricter IT policies.
Other drivers and restraints analyzed in the detailed report include:
- Government Energy-Efficiency Mandates for Plug-Load Control
- Matter 1.3 Interoperability Push
- Fragmented RF Spectrum in Emerging Markets
For complete list of drivers and restraints, kindly check the Table Of Contents.
Segment Analysis
Bluetooth retained the largest 31.7% slice of smart plug market share in 2024, but Zigbee/Thread protocols are accelerating at a 26.8% CAGR on the back of Matter certification momentum. The smart plug market size for Thread-enabled models is projected to swell sharply as enhanced credential-sharing in Thread 1.4 unlocks enterprise-grade deployments. Tuya's 15-day turnkey module program signals how standardization compresses time-to-market and lowers engineering hurdles. Wi-Fi enjoys cost-led ubiquity and excels in bandwidth-heavy use-cases such as high-resolution energy metering, while Z-Wave remains entrenched in legacy US security systems. Proprietary stacks risk obsolescence as consumers align around cross-platform purchase assurance.
Thread's real-time energy-reporting offers clear advantages in utility demand-response. Matter 1.3 now lets smart plugs feed instantaneous consumption data to broader home-energy-management dashboards. Consequently, utility rebates are beginning to single out Thread-capable hardware, incentivizing installers to pivot away from Wi-Fi-only SKUs. Vendors that overlay energy analytics atop Thread's low-latency mesh can charge premium ASPs, cushioning margin erosion in a commoditizing category.
Residential premises still represent 56.2% of the 2024 smart plug market size, buoyed by voice-assistant bundling and DIY convenience. Yet industrial and commercial buildings are set to expand at a 27.7% CAGR as facility managers chase quantified returns; field studies show 36.8 kW of annual plug-load savings per site when IoT scheduling is applied. Honeywell's plug-load module for enterprise building-management systems exemplifies the pivot to data-driven energy compliance.
In factories and warehouses, skinned industrial-grade smart plugs add thermal-overload protection and over-current analytics that residential units lack. Hospitals and elder-care facilities deploy smart plugs to verify medical-device uptime and prevent unplanned disconnection, aided by subsidy programs for remote monitoring in aging societies. The commercial appetite for SLA-backed hardware supports higher price points, widening the total addressable smart plug market for specialist OEMs.
Smart Plug Market is Segmented by Technology (Bluetooth, Wi-Fi, and More), Application (Residential, Commercial, and More), Sales Channel (Online and Offline), Plug Form Factor (Wall-Plug Adapter, In-Wall Outlet, and More), and by Geography. The Market Forecasts are Provided in Terms of Value (USD).
Geography Analysis
North America retained 32.1% leadership in 2024 on the strength of Energy Star SHEMS rules and broadband ubiquity, with utilities offering rebates for demand-response-certified plugs. The region's mature voice-assistant penetration fosters ecosystem lock-in that reduces churn and encourages whole-home retrofits. Canada's updated Energy Efficiency Regulations mirror U.S. standards, giving manufacturers a unified North American certification roadmap.
Asia Pacific is projected to clock a 28.3% CAGR, making it the fastest-expanding territory of the smart plug market. Localized voice-assistant dialect support and competitive pricing have tripled the Alexa device count in India since 2022. China's domestic chipset output curbs BOM volatility and allows white-label brands to proliferate. Government-funded smart-city pilots in Japan and South Korea integrate plug-level energy monitoring into district-wide carbon dashboards, seeding institutional demand for Thread-mesh deployments.
Europe presents a mixed picture. WEEE Directive 2024/884 places full end-of-life costs on manufacturers, pressuring gross margins. Conversely, the UK's 2025 smart-appliance rules require grid-aware functionality, widening the pool of devices that can benefit from retrofitting with Matter-ready smart plugs. Tuya's London retrofit forum underscored the role that low-cost plugs play in hitting net-zero targets for aging housing stock.
South America and the Middle East-Africa trail in installed base but register double-digit growth as 5G rollouts improve latency and coverage. High import duties remain a hurdle, prompting local assembly joint ventures that leverage regional free-trade zones. Developers tapped into hotel chains in the Gulf Cooperation Council to trial centralized energy dashboards, illustrating how smart plugs serve as a gateway product for broader IoT infrastructure.
- TP-Link Technologies
- Belkin (WeMo)
- Xiaomi
- D-Link
- Panasonic
- Amazon (First-Party)
- Broadlink
- Ankuoo
- EDIMAX
- Vesync (Etekcity, Levoit, Cosori)
- Lenovo
- Leviton
- Wipro
- Sariana (Satechi)
- Sonoff (ITEAD)
- Shelly
- Gosund / Nooie
- Eve Systems
- Aeotec
- Sengled
- Wyze Labs
Additional Benefits:
- The market estimate (ME) sheet in Excel format
- 3 months of analyst support
TABLE OF CONTENTS
1 INTRODUCTION
- 1.1 Study Assumptions and Market Definition
- 1.2 Scope of the Study
2 RESEARCH METHODOLOGY
3 EXECUTIVE SUMMARY
4 MARKET LANDSCAPE
- 4.1 Market Overview
- 4.2 Market Drivers
- 4.2.1 Soaring adoption of voice-assistant ecosystems
- 4.2.2 Falling ASPs of Wi-Fi chipsets
- 4.2.3 Government energy-efficiency mandates for plug-load control
- 4.2.4 Matter 1.3 interoperability push
- 4.2.5 Subsidy programs for senior-care tele-monitoring
- 4.2.6 Rising demand for outdoor weather-proof plugs
- 4.3 Market Restraints
- 4.3.1 Persistent device cybersecurity breaches
- 4.3.2 Fragmented RF spectrum in emerging markets
- 4.3.3 EU WEEE recycling costs hitting margins
- 4.3.4 Inaccurate energy-metering claims triggering recalls
- 4.4 Supply-Chain Analysis
- 4.5 Regulatory Landscape
- 4.6 Technological Outlook
- 4.7 Porter's Five Force Analysis
- 4.7.1 Bargaining Power of Suppliers
- 4.7.2 Bargaining Power of Buyers
- 4.7.3 Threat of New Entrants
- 4.7.4 Threat of Substitutes
- 4.7.5 Intensity of Competitive Rivalry
- 4.8 Assesment of Macroeconomic Trends on Market
5 MARKET SIZE AND GROWTH FORECASTS
- 5.1 By Technology
- 5.1.1 Wi-Fi
- 5.1.2 Bluetooth
- 5.1.3 Zigbee / Thread
- 5.1.4 Z-Wave
- 5.1.5 Others
- 5.2 By Application
- 5.2.1 Residential
- 5.2.2 Commercial
- 5.2.3 Industrial
- 5.2.4 Others (Hospitality, Healthcare)
- 5.3 By Sales Channel
- 5.3.1 Online
- 5.3.2 Offline
- 5.4 By Plug Form Factor
- 5.4.1 Wall-Plug Adapter
- 5.4.2 In-Wall Outlet
- 5.4.3 Power Strip
- 5.4.4 Others
- 5.5 By Geography
- 5.5.1 North America
- 5.5.1.1 United States
- 5.5.1.2 Canada
- 5.5.1.3 Mexico
- 5.5.2 South America
- 5.5.2.1 Brazil
- 5.5.2.2 Argentina
- 5.5.2.3 Rest of South America
- 5.5.3 Europe
- 5.5.3.1 Germany
- 5.5.3.2 United Kingdom
- 5.5.3.3 France
- 5.5.3.4 Italy
- 5.5.3.5 Rest of Europe
- 5.5.4 Asia-Pacific
- 5.5.4.1 China
- 5.5.4.2 Japan
- 5.5.4.3 South Korea
- 5.5.4.4 India
- 5.5.4.5 Rest of Asia-Pacific
- 5.5.5 Middle East and Africa
- 5.5.5.1 GCC
- 5.5.5.2 Turkey
- 5.5.5.3 South Africa
- 5.5.5.4 Rest of Middle East and Africa
- 5.5.1 North America
6 COMPETITIVE LANDSCAPE
- 6.1 Market Concentration
- 6.2 Strategic Moves
- 6.3 Market Share Analysis
- 6.4 Company Profiles (includes Global level Overview, Market level overview, Core Segments, Financials as available, Strategic Information, Market Rank/Share for key companies, Products and Services, and Recent Developments)
- 6.4.1 TP-Link Technologies
- 6.4.2 Belkin (WeMo)
- 6.4.3 Xiaomi
- 6.4.4 D-Link
- 6.4.5 Panasonic
- 6.4.6 Amazon (First-Party)
- 6.4.7 Broadlink
- 6.4.8 Ankuoo
- 6.4.9 EDIMAX
- 6.4.10 Vesync (Etekcity, Levoit, Cosori)
- 6.4.11 Lenovo
- 6.4.12 Leviton
- 6.4.13 Wipro
- 6.4.14 Sariana (Satechi)
- 6.4.15 Sonoff (ITEAD)
- 6.4.16 Shelly
- 6.4.17 Gosund / Nooie
- 6.4.18 Eve Systems
- 6.4.19 Aeotec
- 6.4.20 Sengled
- 6.4.21 Wyze Labs
7 MARKET OPPORTUNITIES AND FUTURE OUTLOOK
- 7.1 White-space and Unmet-Need Assessment
 智慧插座市场:按类型、插座类型、额定功率、应用和销售管道划分-2026-2032年全球市场预测
 智慧插头市场:全球2025-2029
 智慧插头市场规模、份额及成长分析(按连接类型、插头类型、额定功率、应用、附加功能和地区)-2025 年至 2032 年产业预测