


 |
市场调查报告书
商品编码
1851174
变数施肥技术:市场占有率分析、产业趋势、统计和成长预测(2025-2030 年)Variable Rate Technology - Market Share Analysis, Industry Trends & Statistics, Growth Forecasts (2025 - 2030) |
||||||
※ 本网页内容可能与最新版本有所差异。详细情况请与我们联繫。
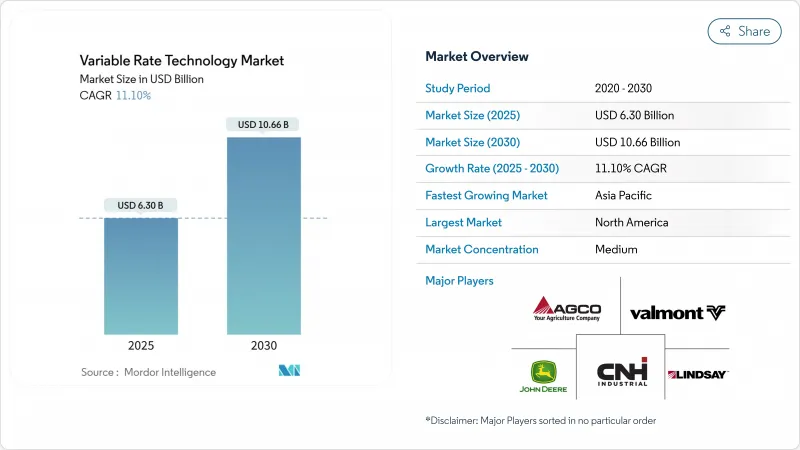
预计到 2025 年,可变施肥技术市场规模将达到 63 亿美元,到 2030 年将达到 106.6 亿美元,预测期内复合年增长率为 11.10%。
在资源日益匮乏的情况下生产更多粮食的压力不断增加,加上对化肥和农药使用的监管审查日益严格,使得可变施肥技术市场成为精准投入管理的关键推动因素。农业数位化、人工智慧在设备中的应用以及优惠的补贴政策提升了该技术的吸引力,而设备製造商的整合则加速了平台创新。北美仍然是收入的主要驱动力,但随着现代化计画的扩展,亚太地区对成长的贡献最大。价值创造仍然主要依赖硬体销售,但以服务为中心的经营模式正在迅速发展,这预示着行业正在向以结果为导向的模式转变。
全球变速施肥技术市场趋势与洞察
农场快速数位化
美国已有61%的农场依赖精准农业硬件,将即时农艺数据传输到云端平台。设备製造商正投入数十亿美元研发自动化解决方案,以减少劳动力投入并提高施肥精度,约翰迪尔公司推出的十年200亿美元国内製造计划便体现了这一点。欧洲的政策也同样优先考虑农业的未来数位化策略,并确保对连网型设备的持续投入。人工智慧主导的封闭式创造了闭环回馈系统,不断调整处方笺,推动可变施肥技术市场从静态地图转向自学习系统。然而,大型农场和小型农场之间日益扩大的数位落差威胁着科技的公平普及。
政府补贴和激励措施
政策制定者正透过补贴、退税和生态计画来承担实施成本。美国农业部的「气候智慧型商品倡议」承诺投入31亿美元,用于需要精细化生产数据并最终实现精准投入工具的计划。澳洲的「农场互联互通计画」承担了智慧灌溉设备一半的成本,而印度的「数位农业使命」已累计600亿卢比(约7.2289亿美元)用于互联基础建设。欧洲通用农业政策将至少25%的直接支付用于奖励可变施肥的生态计画。这些补贴降低了准入门槛,尤其对那些先前因高科技支出而现金流受限的中型农场而言更是如此。
具备VRT功能的机器需要高额的资本支出。
通常情况下,当农场经济规模超过10万欧元(约114,923.51美元)时,才能达到盈利平衡点,这使得规模较小的农场无力负担设备购置费用。虽然像AgDirect这样的贷款机构提供针对特定行业的贷款,但对于资产负债表薄弱的家庭农场来说,抵押品往往难以获得。为了解决这个问题,出现了设备即服务(EaaS)合同,这种合约将成本分摊到所服务的农田上,而不是分摊到拥有的设备上。
细分市场分析
2024年,谷物和谷类将占总收入的37.60%,巩固其作为可变施肥技术市场基础的地位。这些大面积种植的作物受惠于数十年的配方测绘,能够精准地调整大片土地上的氮、磷和播种密度。棉花、烟草和特种纤维等经济作物预计将以14.80%的复合年增长率快速增长,因为更高的净利率使其能够负担得起高端传感器和设备端人工智能。随着与品质挂钩的定价机制的实施,商业作物可变施肥技术市场规模预计将会扩大,该机制奖励精准的马克隆值或叶片等级。利用频谱相机对植物压力进行持续监测,并将数据输入即时模型,在几分钟内启动钾肥或叶面施肥干预措施。这种快速响应能力使种植者能够获得合约奖金并减少因等级问题导致的降级。虽然谷类预计将保持其现有装机量,但特种作物领域将在采用先进技术方面引领潮流。
第二代土壤光谱技术现在可以测量养分释放曲线,从而支持油籽和豆类轮作中的微量施肥。这项技术在巴西和印度的应用尤其广泛,因为这两个国家的蛋白质和油脂含量直接影响农产品价格。随着水果出口商对糖度和颜色容差要求越来越高,可变施肥技术市场正进一步渗透到果园和葡萄园的运作中。供应商将树液分析和灌溉控制打包成订阅服务,使即使是小面积果园也能获得高端分析服务,而无需购买必要的设备。
2024年,化肥市场占有率将达到31.70%,因为氮肥利用效率的提昇在大多数气候带都能带来快速的投资回报。预计到2030年,变数灌溉将以17.20%的复合年增长率成长,这反映了日益严重的水资源短缺以及对季节性取水量的监管限制。在加州的一项试验中,精准中心支轴式喷灌在不损失产量的情况下减少了25%的用水量,证明了其在杏仁和开心果种植中的经济效益。预计到2030年,灌溉设备中变数施肥技术的市场销售额将增加10亿美元,主要得益于一项旨在补偿低压喷嘴维修的补助计划。作物保护喷洒技术也备受关注,因为基于电脑视觉的杂草辨识技术可减少高达80%的除草剂用量。除了这些优势之外,产量监测应用还有助于改进未来的配方,并完善数据回馈循环,从而支援分析软体的续订。
无线土壤探针和云端仪錶板的集成,使得灌溉决策能够将蒸散量预测和未来降雨机率纳入考虑。这种预测能力延长了水泵寿命,降低了能源需求,并提升了资源利用效率的提案。肥料施用方面,可携式实验室套件可与施肥速率控制器同步,利用即时组织检测技术,将静态地图转换为动态的季内施肥计画。生物作物保护投入品的创新进一步凸显了精准微量施肥的需求,而精准微量施肥依赖于感测器驱动的变数施肥演算法。
区域分析
2024年,北美占据了可变施肥技术市场39%的份额。强劲的设备普及、优惠的融资政策以及美国农业部气候智慧型采购规则支撑了市场需求。补贴机制奖励有据可查的养分减量,促进了能够采集喷嘴级数据的智慧型装置的普及。中西部和草原地区的部分农村宽频网路覆盖落后,但预计到2026年,卫星链路的部署将扩大覆盖范围。俄亥俄州的一项试验表明,当可变氮肥施用和无人机植株数量相结合时,作物产量提高了6%。经销商体系提供经过认证的技术人员来维护设备并解读数据,凸显了服务业的成长动能。
亚太地区经济成长最快,预计2030年年均复合成长率将达14.1%。中国最新的五年计画倡导低碳高效农业,并辅以精准的投入品供应。印度的农民登记系统与Aadhaar(印度居民身分识别系统)关联,简化了感测器套件补贴的发放流程;日本食品农业省联合资助了一项针对水稻田的变数播种试验。该地区的小块农地结构催生了许多创新解决方案,例如由乡村创业家营运的共享无人机服务。澳洲和中国北方地区的水资源短缺正在加速推广可变水量灌溉技术,并促进跨境知识转移和硬体进口。
在欧洲,可变施肥技术的应用将被纳入全面的气候变迁政策。 2023-2027年通用农业政策拨款2,695亿欧元(3,124亿美元),其中近一半将用于应对气候变迁的措施,例如减少化肥径流和农药漂移。每个成员国必须将至少25%的直接支付用于生态计画。像荷兰这样的国家正在透过资助数位化津贴来加速推广,这些补助金可以报销高达40%的感测器安装费用。资料主权规则提高了平台遵守《一般资料保护规则)义务的合规成本。儘管如此,像德国5G农业试验平台这样的联盟计划正在提高安全连接的可靠性,而欧洲范围内的碳排放倡议也依赖收费管理机构产生的可追溯的投入数据。
其他福利:
- Excel格式的市场预测(ME)表
- 3个月的分析师支持
目录
第一章 引言
- 研究假设和市场定义
- 调查范围
第二章调查方法
第三章执行摘要
第四章 市场情势
- 市场概览
- 市场驱动因素
- 农场快速数位化
- 政府补贴和奖励
- 农业劳动力短缺日益严重
- 利用卫星窄带物联网技术进行亚英亩级施肥
- 碳信用货币化需要投入可追溯性。
- 用于离线VRT分析的设备端AI晶片
- 市场限制
- VRT相容机器的高额资本投入
- 农村地区网路连接基础设施薄弱
- 资料所有权和共用模糊不清
- 缺乏VRT熟练农艺服务提供者
- 监管环境
- 技术展望
- 波特五力分析
- 新进入者的威胁
- 买方的议价能力
- 供应商的议价能力
- 替代品的威胁
- 竞争对手之间的竞争
第五章 市场规模与成长预测
- 按作物类型
- 谷物和谷类
- 水果和蔬菜
- 油籽和豆类
- 经济作物
- 透过使用
- 肥料
- 作物保护化学品
- 土壤感
- 产量监测
- 灌溉
- 其他(可变施肥播种/种植、可变施用石灰和土壤改良剂)
- 报价
- 硬体
- 软体
- 服务
- 透过实施方法
- 基于地图的VRT
- 基于感测器的VRT
- 按农场规模
- 大型农场(超过1000公顷)
- 中型农场(200-1000公顷)
- 小型农场(小于200公顷)
- 按地区
- 北美洲
- 美国
- 加拿大
- 墨西哥
- 北美其他地区
- 欧洲
- 德国
- 法国
- 英国
- 义大利
- 西班牙
- 俄罗斯
- 其他欧洲地区
- 亚太地区
- 中国
- 日本
- 印度
- 韩国
- 澳洲
- 亚太其他地区
- 中东
- 土耳其
- 沙乌地阿拉伯
- 阿拉伯聯合大公国
- 其他中东地区
- 非洲
- 南非
- 埃及
- 奈及利亚
- 其他非洲地区
- 北美洲
第六章 竞争情势
- 市场集中度
- 策略趋势
- 市占率分析
- 公司简介
- Deere & Company
- AGCO Corporation
- CNH Industrial NV
- Valmont Industries, Inc.
- Lindsay Corporation
- EarthOptics
- Hexagon AB
- CropX Technologies
- TeeJet Technologies(Spraying Systems)
- DJI
- DroneDeploy
- The Climate Corporation(Bayer AG)
- EOS Data Analytics,Inc
- SoilOptix
- Frontier Agriculture Ltd
第七章 市场机会与未来展望
The Variable Rate Technology Market size is estimated at USD 6.30 billion in 2025 and is projected to reach USD 10.66 billion by 2030, at a CAGR of 11.10% during the forecast period.
Rising pressure to produce more food with fewer resources, combined with regulatory scrutiny over fertilizer and pesticide use, positions the variable rate technology market as a pivotal enabler of precision input management. Wider farm digitalization, embedded on-equipment AI, and favorable subsidy programs strengthen technology appeal, while consolidation among equipment makers accelerates platform innovation. North America remains the revenue anchor, yet Asia-Pacific contributes the most incremental growth as modernization schemes expand. Hardware sales still dominate value creation, but service-centric business models scale quickly, signaling an industry shift toward outcome-based offerings.
Global Variable Rate Technology Market Trends and Insights
Rapid Digitalization of Farms
Sixty-one percent of United States farms already rely on precision hardware that feeds real-time agronomic data into cloud platforms. Equipment makers allocate multibillion-dollar budgets to autonomous solutions that lower labor needs and refine application accuracy, illustrated by John Deere's decade-long USD 20 billion domestic manufacturing plan. European policy likewise prioritizes an upcoming digital strategy for agriculture, ensuring sustained funding for connected devices. Closed feedback loops created by AI-driven algorithms continuously adjust prescriptions, moving the variable rate technology market beyond static maps toward self-learning systems. Yet a widening digital divide between large and small farms threatens equitable technology uptake.
Government Subsidies and Incentive Schemes
Policymakers use grants, rebates, and eco-schemes to underwrite adoption costs. The USDA Climate-Smart Commodities initiative channels USD 3.1 billion into projects that necessitate granular production data and, by extension, precision input tools. Australia's On-Farm Connectivity Program covers half the cost of smart irrigation devices, while India's Digital Agriculture Mission earmarks INR 6,000 crore (USD 722.89 million) for connected infrastructure. Europe's Common Agricultural Policy directs at least 25% of direct payments toward eco-schemes that reward variable-rate fertilization. These subsidies lower entry barriers, especially for mid-size farms whose cash flows were once restricted by high-tech spending.
High Capital Expenditure of VRT-Ready Machinery
Profitability breakeven often starts at economic farm sizes above EUR 100,000 (USD 114,923.51), leaving smaller operations priced out of equipment purchases. Lenders such as AgDirect offer sector-specific loans, yet collateral hurdles persist for family farms with thin balance sheets. As a workaround, equipment-as-a-service contracts spread costs across acres serviced rather than units owned.
Other drivers and restraints analyzed in the detailed report include:
- Rising Agricultural Labor Shortage
- Satellite NB-IoT-Enabled Sub-Acre Prescriptions
- Patchy Rural Connectivity Infrastructure
For complete list of drivers and restraints, kindly check the Table Of Contents.
Segment Analysis
In 2024, cereals and grains represented 37.60% of revenues, cementing their role as the foundation of the variable rate technology market. These broad-acre crops benefit from decades of prescription mapping that fine-tunes nitrogen, phosphorus, and seeding density across large tracts. Commercial crops such as cotton, tobacco, and specialty fibers deliver the fastest gains with a 14.80% CAGR outlook, as higher margins justify premium sensors and on-equipment AI. Variable rate technology market size for commercial crops is anticipated to climb in tandem with quality-linked pricing schemes that reward precise micronaire or leaf grade. Continuous monitoring of plant stress via multispectral cameras feeds real-time models that initiate potassium or foliar-feed interventions within minutes. This responsiveness helps producers capture contract bonuses and reduce grade-related downgrades. Cereals will keep anchoring installed base volumes, yet specialty segments set the pace for advanced feature uptake.
Second-generation soil spectroscopy now measures nutrient release curves that underpin fertilizer micro-dosing in oilseed and pulse rotations. Adoption is especially strong in Brazil and India, where protein and oil content directly influence farm-gate prices. The variable rate technology market further penetrates orchard and vineyard operations as fruit exporters demand tighter Brix and color tolerances. Providers bundle sap analysis and irrigation rate control into subscription services so smaller acreage fruit farms can access high-end analytics without outright equipment purchases.
Fertilizers held a 31.70% market share in 2024 because nitrogen efficiency improvements deliver quick paybacks in most climatic zones. Variable-rate irrigation is poised for a 17.20% CAGR by 2030, reflecting escalating water scarcity and regulatory caps on seasonal withdrawals. In California trials, precision pivots cut water use by 25% with no yield penalty, validating the economics for almond and pistachio groves. The variable rate technology market size for irrigation equipment is forecast to add USD 1 billion in incremental sales by 2030, buoyed by subsidy programs that reimburse low-pressure nozzle retrofits. Crop-protection spraying follows close behind as computer-vision weed identification slashes herbicide volumes by up to 80%. Added to these gains, yield monitoring applications complete the data feedback loop that refines future prescriptions and anchors subscription renewals for analytics software.
Integration of wireless soil probes with cloud dashboards enables irrigation decisions that account for evapotranspiration forecasts and future rainfall probability. This predictive capability extends pump life and trims energy demand, reinforcing the resource-efficiency value proposition. Fertilizer applications now leverage real-time tissue testing via portable lab kits that sync to rate controllers, converting static maps into season-long dynamic schedules. Product innovation in biological crop-protection inputs further amplifies the need for precise micro-dosing that hinges on sensor-driven variable rate algorithms.
The Variable Rate Technology Market Report is Segmented by Crop Type (Cereals and Grains and More), by Application (Fertilizers, Crop-Protection Chemicals, and More), by Offering (Hardware and More), by Implementation Method (Map-Based VRT and More), by Farm Size (Large Farms and More) and by Geography (North America, Europe, and More). The Market Forecasts are Provided in Terms of Value (USD).
Geography Analysis
North America generated 39% of 2024 revenue for the variable rate technology market. Strong machinery penetration, supportive financing, and USDA climate-smart procurement rules anchor demand. Subsidy frameworks reward documented nutrient reductions, spurring the adoption of smart implements that capture nozzle-level logs. Rural broadband lags in parts of the Midwest and Prairie provinces, yet satellite link rollouts promise coverage boosts by 2026. Ohio State trials show a 6% yield lift when VR nitrogen intersects with drone stand counts, proof points that validate ongoing investment. Dealer ecosystems supply certified technicians who maintain fleets and interpret data, underscoring the service growth narrative.
Asia-Pacific is the fastest climber, tracking a 14.1% CAGR to 2030 as governments attach digital farming clauses to modernization spending. China's latest Five-Year Plan promotes low-carbon, high-efficiency agriculture that dovetails with targeted input delivery. India's Aadhaar-linked Farmer Registry simplifies subsidy disbursement for sensor kits, while Japan's Food and Agriculture Ministry co-funds paddy-specific variable rate seeding trials. The region's small-plot structure sparks creative solutions, including shared-service drones operated by village entrepreneurs. Water scarcity across Australia and Northern China accelerates variable-rate irrigation uptake, driving cross-border knowledge transfer and hardware imports.
Europe embeds variable rate technology adoption within sweeping climate policy. The Common Agricultural Policy for 2023-27 allocates EUR 269.5 billion (USD 312.4 billion), nearly half aimed at climate objectives that include reduced fertilizer leaching and pesticide drift. Each member state must earmark at least 25% of direct payments for eco-schemes, many of which list precision application as a qualifying practice. Countries such as the Netherlands fund digitization grants that reimburse up to 40% of sensor installations, hastening implementation. Data sovereignty rules raise compliance costs as platforms adapt to General Data Protection Regulation obligations. Nonetheless, consortium projects like Germany's 5G Testbed Agriculture expedite confidence in secure connectivity, and Pan-European carbon initiatives depend on traceable input data generated by rate controllers.
- Deere & Company
- AGCO Corporation
- CNH Industrial N.V.
- Valmont Industries, Inc.
- Lindsay Corporation
- EarthOptics
- Hexagon AB
- CropX Technologies
- TeeJet Technologies (Spraying Systems)
- DJI
- DroneDeploy
- The Climate Corporation (Bayer AG)
- EOS Data Analytics,Inc
- SoilOptix
- Frontier Agriculture Ltd
Additional Benefits:
- The market estimate (ME) sheet in Excel format
- 3 months of analyst support
TABLE OF CONTENTS
1 Introduction
- 1.1 Study Assumptions and Market Definition
- 1.2 Scope of the Study
2 Research Methodology
3 Executive Summary
4 Market Landscape
- 4.1 Market Overview
- 4.2 Market Drivers
- 4.2.1 Rapid digitalization of farms
- 4.2.2 Government subsidies and incentive schemes
- 4.2.3 Rising agriculture labour shortage
- 4.2.4 Satellite NB-IoT-enabled sub-acre prescriptions
- 4.2.5 Carbon credit monetization demanding input traceability
- 4.2.6 On-equipment AI chips for offline VRT analytics
- 4.3 Market Restraints
- 4.3.1 High capital expenditure of VRT-ready machinery
- 4.3.2 Patchy rural connectivity infrastructure
- 4.3.3 Data ownership and sharing ambiguities
- 4.3.4 Shortage of VRT skilled agronomic service providers
- 4.4 Regulatory Landscape
- 4.5 Technological Outlook
- 4.6 Porter's Five Forces Analysis
- 4.6.1 Threat of New Entrants
- 4.6.2 Bargaining Power of Buyers
- 4.6.3 Bargaining Power of Suppliers
- 4.6.4 Threat of Substitutes
- 4.6.5 Intensity of Competitive Rivalry
5 Market Size and Growth Forecasts (Value)
- 5.1 By Crop Type
- 5.1.1 Cereals and Grains
- 5.1.2 Fruits and Vegetables
- 5.1.3 Oilseeds and Pulses
- 5.1.4 Commercial Crops
- 5.2 By Application
- 5.2.1 Fertilizers
- 5.2.2 Crop-protection Chemicals
- 5.2.3 Soil Sensing
- 5.2.4 Yield Monitoring
- 5.2.5 Irrigation
- 5.2.6 Others (variable-rate seeding/planting, variable-rate lime and soil-amendment application)
- 5.3 By Offering
- 5.3.1 Hardware
- 5.3.2 Software
- 5.3.3 Services
- 5.4 By Implementation Method
- 5.4.1 Map-based VRT
- 5.4.2 Sensor-based VRT
- 5.5 By Farm Size
- 5.5.1 Large Farms (greater than 1,000 ha)
- 5.5.2 Medium Farms (200-1,000 ha)
- 5.5.3 Small Farms (less than 200 ha)
- 5.6 By Geography
- 5.6.1 North America
- 5.6.1.1 United States
- 5.6.1.2 Canada
- 5.6.1.3 Mexico
- 5.6.1.4 Rest of North America
- 5.6.2 Europe
- 5.6.2.1 Germany
- 5.6.2.2 France
- 5.6.2.3 United Kingdom
- 5.6.2.4 Italy
- 5.6.2.5 Spain
- 5.6.2.6 Russia
- 5.6.2.7 Rest of Europe
- 5.6.3 Asia-Pacific
- 5.6.3.1 China
- 5.6.3.2 Japan
- 5.6.3.3 India
- 5.6.3.4 South Korea
- 5.6.3.5 Australia
- 5.6.3.6 Rest of Asia-Pacific
- 5.6.4 Middle East
- 5.6.4.1 Turkey
- 5.6.4.2 Saudi Arabia
- 5.6.4.3 United Arab Emirates
- 5.6.4.4 Rest of Middle East
- 5.6.5 Africa
- 5.6.5.1 South Africa
- 5.6.5.2 Egypt
- 5.6.5.3 Nigeria
- 5.6.5.4 Rest of Africa
- 5.6.1 North America
6 Competitive Landscape
- 6.1 Market Concentration
- 6.2 Strategic Moves
- 6.3 Market Share Analysis
- 6.4 Company Profiles (includes Global level Overview, Market level overview, Core Segments, Financials as available, Strategic Information, Market Rank/Share, Products and Services, Recent Developments)
- 6.4.1 Deere & Company
- 6.4.2 AGCO Corporation
- 6.4.3 CNH Industrial N.V.
- 6.4.4 Valmont Industries, Inc.
- 6.4.5 Lindsay Corporation
- 6.4.6 EarthOptics
- 6.4.7 Hexagon AB
- 6.4.8 CropX Technologies
- 6.4.9 TeeJet Technologies (Spraying Systems)
- 6.4.10 DJI
- 6.4.11 DroneDeploy
- 6.4.12 The Climate Corporation (Bayer AG)
- 6.4.13 EOS Data Analytics,Inc
- 6.4.14 SoilOptix
- 6.4.15 Frontier Agriculture Ltd


