


 |
市场调查报告书
商品编码
1851186
排放监测系统:市场占有率分析、产业趋势、统计数据和成长预测(2025-2030 年)Emission Monitoring Systems - Market Share Analysis, Industry Trends & Statistics, Growth Forecasts (2025 - 2030) |
||||||
※ 本网页内容可能与最新版本有所差异。详细情况请与我们联繫。
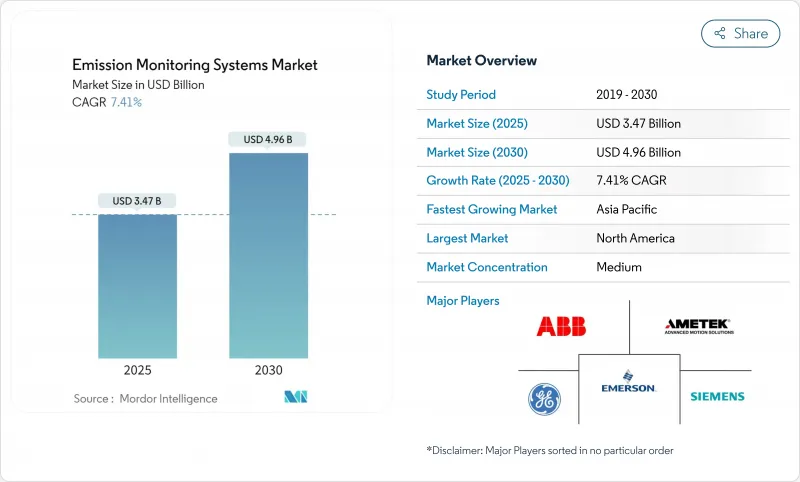
预计到 2025 年,排放监测系统市场价值将达到 34.7 亿美元,到 2030 年将达到 49.6 亿美元,年复合成长率为 7.41%。
更严格的空气污染法规以及欧盟排放交易体系第四阶段的直接碳货币化政策,推动了对更精确烟囱监测器的需求,同时,混合型、连续型和预测型架构的转变正在重塑供应商的策略。儘管硬体仍然是最大的收入来源,占2024年收入的46%,但服务业务的成长速度最快,复合年增长率达7.7%,因为用户需要校准、认证和资料管理方面的支援。北美地区的装机量领先,而亚太地区则以10%的最高成长率成长,这主要得益于中国和印度实施了新的工厂级限制措施。原位雷射分析仪,尤其是TDLS,正迅速取代垃圾焚化发电发电厂的抽吸系统,从而降低约30%的生命週期成本。同时,人工智慧软体模组正在将合规资料转化为预测性维护和流程优化工具,从而降低15-20%的营业成本。
全球排放监测系统市场趋势与洞察
从资本支出密集型CEMS到混合型CEMS-PEMS架构过渡
混合配置将来自复合迴圈监测系统 (CEMS) 硬体的直接读数与基于软体的排放模型相结合,在将初始投资成本降低 25% 至 30% 的同时,实现了相对于参考设备低于 3% 的误差率。在美国环保署 (EPA)核准后,美国炼油厂和联合循环燃气发电厂正将预测模组视为一种替代二次污染物排放合规方案。美国平台供应商整合了机器学习演算法,可即时自动校准模型,从而缩短检验週期。云端託管消除了本地 IT 开销,降低了软体价格,并将混合配置方案扩展到中型设施。分析师预测,到 2027 年,这种配置将占据新型排放监测系统市场约四分之一的份额。
欧盟排放交易体系第四阶段碳价格强制令推动烟囱级监测
2025年碳排放权价格超过每吨80欧元的预期,并将排放数据转换为金融变数。为了最大限度地减少碳信用的过度购买,电力、水泥和废弃物管理运营商正在增设高精度分析仪,与之前的型号相比,精度提高了2-3个百分点。随着覆盖范围扩大到航运和小型工业场所,东欧地区订单激增,自2023年以来,安装量增加了35%。工厂现在将监测器直接整合到製程控制迴路中,以便根据实际碳成本调整产量。能够将监测硬体与自动化交易仪表板结合的供应商正在占据更大的排放监测系统市场份额。
欧洲因TUV和MCERTS认证技术人员短缺而导致试运行延误
欧洲合规要求由经TUV或MCERTS认证的技术人员进行现场审核。劳动力短缺高达40%,导致计划启动平均延迟长达六个月,尤其是在波兰、罗马尼亚和保加利亚。预计从2023年起,服务费用将上涨25%至30%,这将促使用户转向拥有内部服务部门的供应商。原始设备製造商(OEM)正在透过远端协助套件来应对这项挑战,这些工具包利用排放扩增实境(AR)头戴设备来指导现场工作人员进行校准程序。儘管采取了这些变通方法,但在培训管道扩大之前,技术人员短缺仍将限制排放监测系统市场的短期成长。
细分市场分析
到2024年,CEMS将占该细分市场收入的71%。然而,由于云端运算费用下降以及监管机构对预测演算法的支持,PEMS将以8.4%的复合年增长率超越CEMS。预计到2027年,与混合部署相关的排放监测系统市场规模将超过10亿美元。炼油厂、燃气涡轮机和石化裂解装置是主要目标应用场景,因为这些设施的温度、氧气和污染物排放量之间存在密切关联。由于许多工厂工程师缺乏建模方面的专业知识,因此提供承包资料科学支援的供应商将成为宝贵的资源。此外,不断增长的软体订阅收入为供应商提供了稳定的年金收入,并促使其摆脱一次性硬体销售的模式。
对于二氧化硫和颗粒物等主要污染物,由于法规要求直接测量,连续排放监测系统(CEMS)仍不可取代。因此,将用于关键气体的小型分析仪与用于二次流的预测排放监测系统(PEMS)相结合的混合配置方案在新竞标中越来越普遍。这种方法使营运商能够在满足合规要求和预算之间取得平衡,既能节省PEMS的成本,还能保持CEMS的完整性。在这种模式下,到2030年,纯粹的预测型排放监测系统市场份额将不超过10%,但随着人工智慧工具的改进和现场数据可靠性的提高,混合型系统的价值将稳步增长。
2024年,气体分析仪、流量感测器和探头将占全球收入的46%,其中以多组分傅立叶变换红外光谱仪(FTIR)和热扩散雷射光谱仪(TDLS)为主导,这些仪器在水泥、钢铁和废弃物等行业享有高价。同时,定期服务合约(校准、认证和数据检验)目前正以7.7%的复合年增长率成长。加拿大和韩国等国家碳市场等新的交易机制提高了数据准确性的重要性,并鼓励进行年度或半年度审核。没有内部测量团队的终端使用者正在将合规性保证外包,这使得服务专家在整个排放监测系统市场中至关重要。
云端原生软体模组是另一大成长驱动力。供应商正在将自动化合规报告打包,这些报告可直接对应到欧盟和美国环保署的模板,从而减轻行政负担。订阅收入正以每年 18% 的速度成长,并正在重塑财务模式。一些原始设备製造商 (OEM) 正在推出排放监测即服务 (EMaaS) 计划,将硬体租赁与全方位维护相结合,从而简化客户的现金支出。这种循环模式应能逐步减少对一次性硬体付款的依赖,并使排放排放气体系统产业的收入来源多元化。
区域分析
北美地区在2024年的排名中占39%的收入,这主要得益于电力和炼油业安装的约15,000套连续排放监测系统(CEMS)。 《通货膨胀控制法案》的激励措施鼓励电力公司更新其分析设备,而加拿大基于产量的定价结构则促进了中型製造商订单。由于许多在2015年之前安装的设备已接近使用寿命终点,改装计划占据了订单的大部分。将合规数据与维护计划关联起来,并与云端仪錶板集成,如今已成为标准做法,这种数位整合对大多数竞标都产生了影响。
亚太地区是成长最快的地区,年复合成长率达10%。中国的「十四五」规划要求在约8万家工厂安装排放监测设备,其中许多工厂直接采用原位雷射技术。印度的国家清洁空气计画要求到2026年,在200多个燃煤电厂安装连续烟囱,从而缩短采购週期。先进的分析仪供应商正与当地系统整合合作,以弥补采购规则和服务覆盖范围的不足。日本和韩国已运作成熟的排放监测系统,但仍在不断升级到TDLS和量子连锁平台,尤其是在垃圾焚化发电排放监测系统市场的装机安装基础。
由于欧盟排放交易体系(EU-ETS)下碳定价和资料品质要求的提高,欧洲占全球整体的25%。东欧成员国的扩张推动了初始部署,而西欧用户则专注于提高执行时间和降低拥有成本。强制性年度校准和并行采样测试带来了相应比例更高的服务收入。中东和非洲地区虽然处于发展阶段,但前景广阔:沙乌地阿拉伯的「2030愿景」将排放目标与产业多元化挂钩,南非的碳排放税正在加速采矿和电力产业监测技术的应用。对于寻求这些前沿机会的供应商而言,能够耐受恶劣环境(例如,灰尘、高温、盐碱)是一项关键的技术优势。
其他福利:
- Excel格式的市场预测(ME)表
- 3个月的分析师支持
目录
第一章 引言
- 研究假设和市场定义
- 调查范围
第二章调查方法
第三章执行摘要
第四章 市场情势
- 市场概览
- 市场驱动因素
- 欧洲从资本支出密集型CEMS转型为混合CEMS-PEMS架构
- 欧盟碳排放交易体系第四阶段碳定价强制令促进烟囱级监测(欧洲)
- 检验《通货膨胀削减法案》税额扣抵如何推动美国发电厂CEMS改装激增
- 原位雷射感测器可将亚太地区垃圾焚化发电发电厂的生命週期成本降低30%。
- 印度国家清洁空气计画旨在加速燃煤连续排放管理系统(CEMS)。
- 国际海事组织2023年EEXI和CII法规促进船舶安全管理系统(SEMS)的采用(全球海事部门)
- 市场限制
- 欧洲因TUV和MCERTS认证技术人员短缺而导致试运行延误
- 热带地区高湿度偏差会增加违规的风险
- 美国公共产业传统DCS-DAQ互通性差距导致改装成本上升
- 长期CEMS租赁模式(MEA)中的资本锁定阻碍了PEMS的引进。
- 产业生态系分析
- 技术展望
- 波特五力分析
- 供应商的议价能力
- 买方的议价能力
- 新进入者的威胁
- 替代品的威胁
- 竞争对手之间的竞争
第五章 市场规模与成长预测
- 依系统类型
- 连续排放监测系统(CEMS)
- 预测性排放监测系统(PEMS)
- 按组件
- 硬体
- 气体分析仪
- 流量不透明度监测仪
- 数据采集系统(DAS)
- 软体
- 独立的
- 云端託管
- 服务
- 安装与部署
- 校准和认证
- 支援与维护
- 硬体
- 透过监测技术
- 提炼
- 湿热
- 冷干
- 稀释
- In-situ
- 可调谐二极体雷射光谱(TDLS)
- 提炼
- 按最终用户行业划分
- 发电
- 燃煤发电
- 复合迴圈燃气涡轮机
- 石油和天然气
- 上游
- 中产阶级
- 下游炼油厂
- 金属和采矿
- 化工/石油化工
- 製药
- 水泥和骨材
- 纸浆
- 垃圾焚化发电和焚烧
- 海事(船舶)
- 发电
- 按地区
- 北美洲
- 美国
- 加拿大
- 墨西哥
- 欧洲
- 德国
- 英国
- 法国
- 义大利
- 西班牙
- 其他欧洲地区
- 亚太地区
- 中国
- 日本
- 韩国
- 印度
- 东南亚
- 亚太其他地区
- 南美洲
- 巴西
- 其他南美洲
- 中东和非洲
- 中东
- 阿拉伯聯合大公国
- 沙乌地阿拉伯
- 其他中东地区
- 非洲
- 南非
- 其他非洲地区
- 北美洲
第六章 竞争情势
- 市场集中度
- 策略趋势
- 市占率分析
- 公司简介
- ABB Ltd.
- Siemens AG
- Emerson Electric Co.
- Thermo Fisher Scientific Inc.
- AMETEK Inc.
- Honeywell International Inc.
- Teledyne Technologies Inc.
- HORIBA Ltd.
- SICK AG
- Rockwell Automation Inc.
- General Electric Company
- Fuji Electric Co. Ltd.
- Advanced Emissions Solutions Inc.
- ENVEA Global SAS
- Parker Hannifin Corp.
- Baker Hughes Co.
- Cemtrex Inc.
- Babcock and Wilcox Enterprises Inc.
- Opsis AB
- Altech Environment USA
第七章 市场机会与未来展望
The emission monitoring systems market is valued at USD 3.47 billion in 2025 and is forecast to reach USD 4.96 billion by 2030, advancing at a 7.41% CAGR.
Stricter air-pollution rules and the direct monetization of carbon under the EU Emissions Trading System Phase IV are raising demand for higher-accuracy stack monitors, while the shift toward hybrid continuous-predictive architectures is redefining vendor strategies. Hardware still generates the largest revenue stream, holding 46% of 2024 sales, yet services are expanding fastest at a 7.7% CAGR as users seek calibration, certification, and data-management support. North America leads in installed base, but Asia Pacific records the highest 10% regional growth as China and India impose new plant-level limits. In-situ laser analyzers, particularly TDLS, are rapidly displacing extractive systems in waste-to-energy plants, lowering lifecycle outlays by roughly 30%. Simultaneously, AI-enabled software modules are turning compliance data into predictive-maintenance and process-optimization tools that trim operating costs by 15-20%.
Global Emission Monitoring Systems Market Trends and Insights
Transition from CAPEX-heavy CEMS to Hybrid CEMS-PEMS Architectures
Hybrid configurations blend direct readings from CEMS hardware with software-based emission models, lowering upfront expenditure by 25-30% while keeping error rates below 3% against reference instruments. Early adopters in U.S. refineries and combined-cycle gas plants now treat predictive modules as a compliance-accepted alternative for secondary pollutants after U.S. EPA approval. Global platform vendors embed machine-learning algorithms that auto-calibrate models in real time, shrinking validation cycles. As cloud hosting removes local IT overhead, software pricing is falling, opening the hybrid option to mid-sized facilities. Analysts expect this configuration to represent roughly one-quarter of all new emission monitoring systems market installations by 2027.
Mandatory EU-ETS Phase IV Carbon Pricing Driving Stack-Level Monitoring
Allowance prices above EUR 80 per tonne in 2025 have turned emissions data into a line-item financial variable. Operators in power, cement, and waste management have added high-precision analyzers that improve accuracy by 2-3 percentage points versus prior models, minimizing over-purchasing of carbon credits. Expansion of scope to maritime and small industrial sites has boosted new system orders across Eastern Europe, where installations jumped 35% since 2023. Plants now integrate monitors directly with process-control loops to throttle output against live carbon costs. Vendors able to pair monitoring hardware with automated trading dashboards have gained share in the emission monitoring systems market.
Scarcity of TUV & MCERTS-Certified Technicians Delaying European Commissioning
Compliance in Europe obliges on-site audits by technicians accredited under TUV or MCERTS frameworks. A 40% workforce shortfall has extended average project start-ups by up to six months, particularly in Poland, Romania, and Bulgaria. Hourly service rates have escalated 25-30% since 2023, pushing users toward vendors with in-house service arms. OEMs respond with remote-assistance toolkits that guide local staff through calibration sequences via augmented-reality headsets. Despite these work-arounds, the technician bottleneck trims near-term growth for the emission monitoring systems market until training pipelines expand.
Other drivers and restraints analyzed in the detailed report include:
- Inflation Reduction Act Tax-Credit Verification Creating Surge in U.S. Power-Plant CEMS Retrofits
- In-situ Laser-Based Sensors Cutting Lifecycle Cost by 30% in APAC Waste-to-Energy Plants
- Legacy DCS-DAQ Inter-operability Gaps Inflating Retrofit Costs in U.S. Utilities
For complete list of drivers and restraints, kindly check the Table Of Contents.
Segment Analysis
The segment opened 2024 with CEMS owning 71% of revenue thanks to universal regulatory acceptance. However, PEMS is outpacing at an 8.4% CAGR as cloud compute charges fall and regulators endorse predictive algorithms. The emission monitoring systems market size linked to hybrid deployments is projected to cross USD 1 billion by 2027, reflecting steadily rising adoption where processes run under steady-state conditions. Oil refineries, gas turbines, and petrochemical crackers see tight correlations between temperature, O2, and pollutant outputs, making them prime candidates. Vendors that package turnkey data-science support gain leverage, because many plant engineers lack modeling expertise. Incremental software subscriptions also give suppliers annuity revenue, shifting away from lumpy hardware sales.
CEMS remains irreplaceable for primary pollutants such as SO2 and particulate matter where laws demand direct readings. As a result, hybrid configurations that pair a compact analyzer for critical gases with PEMS for secondary streams dominate new bids. The approach lets operators balance compliance rigor and budget, preserving CEMS integrity while harvesting PEMS cost savings. Within this model, the emission monitoring systems market share of pure predictive installations is unlikely to top 10% by 2030, yet hybrid value will mount steadily as AI tools improve and field data builds confidence.
Gas analyzers, flow sensors, and probes generated 46% of global turnover in 2024, led by multi-component FTIR and TDLS instruments that command premium pricing in cement, steel, and waste-to-energy. Nevertheless, recurring service contracts-calibration, certification, and data validation-now advance at a 7.7% CAGR. New trading schemes such as national carbon markets in Canada and South Korea raise the stakes for data accuracy, prompting annual or semi-annual audits. End-users lacking internal metrology teams outsource compliance assurance, making service specialists pivotal across the emission monitoring systems market.
Cloud-native software modules add another growth lever. Suppliers bundle automated compliance reports that map directly to EU or EPA templates, cutting administrative workload. Subscription revenue is rising 18% annually, reshaping financial models. Some OEMs have introduced emissions-monitoring-as-a-service plans that combine hardware leases with full-scope maintenance, smoothing customer cash out-flows. This recurring model should gradually dilute lump-sum hardware dependence and diversify income streams in the emission monitoring systems industry.
The Emission Monitoring Market Report is Segmented by System Type (Continuous Emission Monitoring Systems (CEMS), and Predictive Emission Monitoring Systems (PEMS)), Component (Hardware, Software, and Services), Monitoring Technology (Extractive, Dilution, and In-Situ), End-User Industry (Power Generation, Oil and Gas, Metals and Mining, and More), and Geography. The Market Forecasts are Provided in Terms of Value (USD).
Geography Analysis
North America headed the 2024 rankings with 39% revenue, anchored by roughly 15,000 installed CEMS units across power and refining. Inflation Reduction Act incentives prompt utilities to modernize analyzers, while Canada's output-based pricing system spreads monitoring into mid-size manufacturing. Retrofit projects dominate order books because many units installed before 2015 reach end-of-life. Integration with cloud dashboards that link compliance data to maintenance planning is now standard practice, and this digital overlay influences most competitive bids.
Asia Pacific is the fastest-growing region at a 10% CAGR. China's 14th Five-Year Plan compels around 80,000 plants to install monitors, often leapfrogging directly to in-situ lasers. India's National Clean Air Programme mandates continuous stacks at more than 200 coal stations by 2026, compressing buying cycles. Advanced analyzer vendors partner with local system integrators to navigate procurement rules and service coverage gaps. Japan and South Korea already operate mature fleets but continue to upgrade to TDLS and quantum-cascade platforms, especially in waste-to-energy. Southeast Asia mirrors Chinese standards; Vietnam and Indonesia published guidelines modeled on GB standards in 2024, widening the install base for the emission monitoring systems market.
Europe represents 25% of global value, uniquely shaped by carbon-price exposure under the EU-ETS, which elevates data-quality requirements. Eastern-member expansion drives first-install volumes, while Western-EU users focus on uptime and cost-of-ownership gains. Service revenue is proportionally higher because annual calibrations and parallel-sampling tests are mandatory. The Middle East and Africa are nascent but promising: Saudi Arabia's Vision 2030 ties emissions targets to industrial diversification, and South Africa's carbon tax accelerates monitoring adoption in mining and power. Harsh-environment resilience-high dust, heat, and salinity-forms a technical differentiator for vendors chasing these frontier opportunities
- ABB Ltd.
- Siemens AG
- Emerson Electric Co.
- Thermo Fisher Scientific Inc.
- AMETEK Inc.
- Honeywell International Inc.
- Teledyne Technologies Inc.
- HORIBA Ltd.
- SICK AG
- Rockwell Automation Inc.
- General Electric Company
- Fuji Electric Co. Ltd.
- Advanced Emissions Solutions Inc.
- ENVEA Global SAS
- Parker Hannifin Corp.
- Baker Hughes Co.
- Cemtrex Inc.
- Babcock and Wilcox Enterprises Inc.
- Opsis AB
- Altech Environment U.S.A.
Additional Benefits:
- The market estimate (ME) sheet in Excel format
- 3 months of analyst support
TABLE OF CONTENTS
1 INTRODUCTION
- 1.1 Study Assumptions and Market Definition
- 1.2 Scope of the Study
2 RESEARCH METHODOLOGY
3 EXECUTIVE SUMMARY
4 MARKET LANDSCAPE
- 4.1 Market Overview
- 4.2 Market Drivers
- 4.2.1 Transition from CAPEX-heavy CEMS to Hybrid CEMS-PEMS Architectures in Europe
- 4.2.2 Mandatory EU-ETS Phase-IV Carbon Pricing Driving Stack-Level Monitoring (Europe)
- 4.2.3 Inflation Reduction Act Tax-Credit Verification Creating Surge in United States Power-Plant CEMS Retrofits
- 4.2.4 In-situ Laser-Based Sensors Cutting Lifecycle Cost by 30 % in Asia-Pacific Waste-to-Energy Plants
- 4.2.5 National Clean Air Programme Accelerating Coal-Fired CEMS Roll-outs (India)
- 4.2.6 IMO 2023 EEXI and CII Rules Triggering Ship-board SEMS Installations (Global Maritime)
- 4.3 Market Restraints
- 4.3.1 Scarcity of TUV and MCERTS-Certified Technicians Delaying European Commissioning
- 4.3.2 High Humidity Bias in Tropical Regions Raising False-Compliance Risk
- 4.3.3 Legacy DCS-DAQ Inter-operability Gaps Inflating Retrofit Costs in United States Utilities
- 4.3.4 Capital Lock-In from Long-Term CEMS Leasing Models Hindering PEMS Adoption (MEA)
- 4.4 Industry Ecosystem Analysis
- 4.5 Technological Outlook
- 4.6 Porter's Five Forces Analysis
- 4.6.1 Bargaining Power of Suppliers
- 4.6.2 Bargaining Power of Buyers
- 4.6.3 Threat of New Entrants
- 4.6.4 Threat of Substitutes
- 4.6.5 Intensity of Competitive Rivalry
5 MARKET SIZE AND GROWTH FORECASTS (VALUES)
- 5.1 By System Type
- 5.1.1 Continuous Emission Monitoring Systems (CEMS)
- 5.1.2 Predictive Emission Monitoring Systems (PEMS)
- 5.2 By Component
- 5.2.1 Hardware
- 5.2.1.1 Gas Analyzers
- 5.2.1.2 Flow and Opacity Monitors
- 5.2.1.3 Data Acquisition Systems (DAS)
- 5.2.2 Software
- 5.2.2.1 Stand-alone
- 5.2.2.2 Cloud-Hosted
- 5.2.3 Services
- 5.2.3.1 Installation and Deployment
- 5.2.3.2 Calibration and Certification
- 5.2.3.3 Support and Maintenance
- 5.2.1 Hardware
- 5.3 By Monitoring Technology
- 5.3.1 Extractive
- 5.3.1.1 Hot-Wet
- 5.3.1.2 Cold-Dry
- 5.3.2 Dilution
- 5.3.3 In-situ
- 5.3.3.1 Tunable Diode Laser Spectroscopy (TDLS)
- 5.3.1 Extractive
- 5.4 By End-User Industry
- 5.4.1 Power Generation
- 5.4.1.1 Coal-Fired
- 5.4.1.2 Combined-cycle Gas Turbines
- 5.4.2 Oil and Gas
- 5.4.2.1 Upstream
- 5.4.2.2 Midstream
- 5.4.2.3 Downstream and Refineries
- 5.4.3 Metals and Mining
- 5.4.4 Chemicals and Petrochemicals
- 5.4.5 Pharmaceuticals
- 5.4.6 Cement and Aggregates
- 5.4.7 Pulp and Paper
- 5.4.8 Waste-to-Energy and Incineration
- 5.4.9 Maritime (Ship-board)
- 5.4.1 Power Generation
- 5.5 By Geography
- 5.5.1 North America
- 5.5.1.1 United States
- 5.5.1.2 Canada
- 5.5.1.3 Mexico
- 5.5.2 Europe
- 5.5.2.1 Germany
- 5.5.2.2 United Kingdom
- 5.5.2.3 France
- 5.5.2.4 Italy
- 5.5.2.5 Spain
- 5.5.2.6 Rest of Europe
- 5.5.3 Asia-Pacific
- 5.5.3.1 China
- 5.5.3.2 Japan
- 5.5.3.3 South Korea
- 5.5.3.4 India
- 5.5.3.5 South East Asia
- 5.5.3.6 Rest of Asia-Pacific
- 5.5.4 South America
- 5.5.4.1 Brazil
- 5.5.4.2 Rest of South America
- 5.5.5 Middle East and Africa
- 5.5.5.1 Middle East
- 5.5.5.1.1 United Arab Emirates
- 5.5.5.1.2 Saudi Arabia
- 5.5.5.1.3 Rest of Middle East
- 5.5.5.2 Africa
- 5.5.5.2.1 South Africa
- 5.5.5.2.2 Rest of Africa
- 5.5.1 North America
6 COMPETITIVE LANDSCAPE
- 6.1 Market Concentration
- 6.2 Strategic Moves
- 6.3 Market Share Analysis
- 6.4 Company Profiles (includes Global level Overview, Market level overview, Core Segments, Financials as available, Strategic Information, Market Rank/Share for key companies, Products and Services, and Recent Developments)
- 6.4.1 ABB Ltd.
- 6.4.2 Siemens AG
- 6.4.3 Emerson Electric Co.
- 6.4.4 Thermo Fisher Scientific Inc.
- 6.4.5 AMETEK Inc.
- 6.4.6 Honeywell International Inc.
- 6.4.7 Teledyne Technologies Inc.
- 6.4.8 HORIBA Ltd.
- 6.4.9 SICK AG
- 6.4.10 Rockwell Automation Inc.
- 6.4.11 General Electric Company
- 6.4.12 Fuji Electric Co. Ltd.
- 6.4.13 Advanced Emissions Solutions Inc.
- 6.4.14 ENVEA Global SAS
- 6.4.15 Parker Hannifin Corp.
- 6.4.16 Baker Hughes Co.
- 6.4.17 Cemtrex Inc.
- 6.4.18 Babcock and Wilcox Enterprises Inc.
- 6.4.19 Opsis AB
- 6.4.20 Altech Environment U.S.A.
7 MARKET OPPORTUNITIES AND FUTURE OUTLOOK
- 7.1 White-space and Unmet-Need Assessment
 排放气体监测系统市场(按类型、组件、部署模式和最终用户划分)—全球预测,2025-2032
 2025年全球排放气体监测系统市场报告2025年全球连续排放监测系统市场报告
 排放气体监测系统市场规模、份额和成长分析(按产品、排放类型、系统类型、垂直和地区)- 产业预测 2025-2032
 排放监测系统市场规模和预测、全球和区域份额、趋势和成长机会分析报告范围:按功能、技术、类型、最终用户和地理位置
 排放监测系统市场 - 按排放类型、监测技术、最终用户产业、地区和竞争细分的全球产业规模、份额、趋势、机会和预测,2019-2029F预测排放监测系统市场 - 全球产业规模、份额、趋势、机会和预测,按行业、组件、部署、地区、竞争细分,2019-2029F排放监测系统市场(技术:预测排放监测系统和连续排放监测系统)- 2024-2034 年全球产业分析、规模、份额、成长、趋势和预测
 到 2030 年排放监测系统的全球市场预测:按系统类型、排放类型、组件、应用、最终用户和地区进行的全球分析
 排放监测系统市场 - 按组件、按系统类型、按技术、垂直领域和预测 2024 - 2032 年