


 |
市场调查报告书
商品编码
1851189
商业温室:市场份额分析、行业趋势、统计数据和成长预测(2025-2030 年)Commercial Greenhouse - Market Share Analysis, Industry Trends & Statistics, Growth Forecasts (2025 - 2030) |
||||||
※ 本网页内容可能与最新版本有所差异。详细情况请与我们联繫。
预计到 2025 年,商业温室市场规模将达到 467 亿美元,到 2030 年将达到 685 亿美元,预测期内复合年增长率为 7.9%。
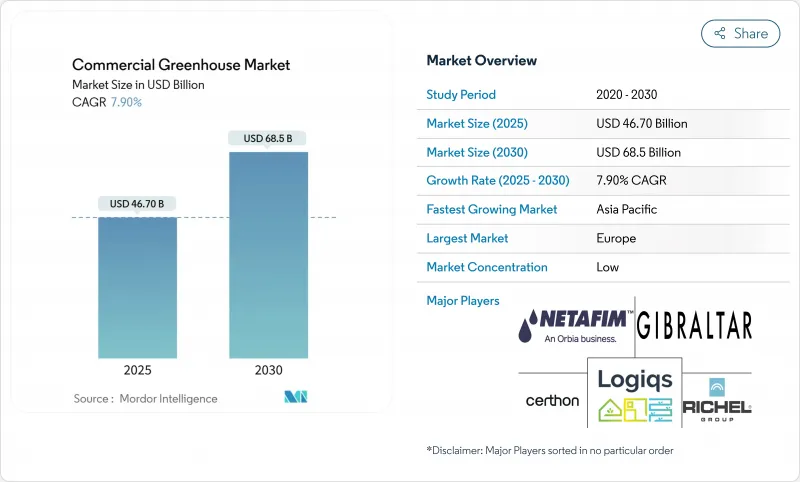
随着适宜露天种植的土地日益减少、极端天气影响产量稳定性以及零售商要求每週交付无农药农产品,商业温室市场正在迅速扩张。种植者正用气候密封设施取代单层层级构造,这些设施动力来源自发电、人工智慧引导灌溉和高效LED照明,从而降低营运成本和碳排放。温室即服务合约将一次性建造成本转化为可预测的费用,使此前难以获得大规模融资的中型农民也能进入商业温室市场。虽然欧洲目前占据最大的市场份额,但亚太地区正受到都市化和粮食安全奖励的推动,快速增长。随着暖气、照明和灌溉供应商将产品整合到统一的平台上,分散的竞争格局正在转向平台化模式。
全球商业温室市场趋势与洞察
耕地面积减少,城市扩张
每年约有1200万公顷可耕地流失,而预计到2030年,城市用地面积将增加三倍。多元化的商业温室市场营运商正透过保护性栽培系统应对此一压力,该系统每平方公尺的产量是露天栽培的10到15倍。中国拥有超过400万公顷的保护性栽培面积,约占全球总量的80%,这充分证明了该模式的扩充性。资本密集设施采用三层堆迭式苗床、附输送带的窄通道以及人工智慧调度系统,可将可用空间提高40%。过去十年,城市附近的土地价格上涨了200%至300%。因此,儘管建设成本不断上涨,种植者仍认为商业温室市场具有经济吸引力。
全年对新鲜农产品的需求
大型连锁超市希望货架上的商品供应稳定,不受季节影响。沃尔玛已与多个州的温室供应商建立了合作关係,这表明零售商对商业温室市场充满信心。随着Z世代消费者为200公里以内种植的1月上市的番茄支付20%至40%的溢价,采用先进技术的农场正在扩大净利率伙伴关係。佛罗里达大学IFAS的水耕温室每公顷可产生3.3万美元的现金流。稳定的品质也使得全年生产成为可能,同时减少了损耗并延长了保质期。
高初始投资
入门级薄膜温室的成本为每平方公尺250至400美元,而高规格玻璃或聚碳酸酯温室的成本则为每平方公尺800至1200美元,这使得许多小农户无力承担商业温室市场。为了达到收支平衡,计划必须达到30%至40%的毛利率和10%至15%的利润率,这需要製定积极的种植计划和较高的定价策略。目前,专业贷款机构提供7至10年的贷款,但自2022年起信贷环境收紧,利率已上涨200至300个基点,增加了偿债成本。温室即服务合约可以将资本成本分摊到10至15年,但租赁方仍需要签订明确的远期购买协议以满足承保人的要求。风暴多发地区较高的保险费进一步增加了固定成本,使得财务可行性更加依赖公用事业收费补贴和碳信用收入。因此,许多种植者采取分阶段建造的方式,先建造较小的模组,待现金流稳定后再扩大种植面积。
细分市场分析
到2024年,暖气仍将维持28%的最大市场份额,凸显其在气候控制领域的普遍作用。 LED阵列正以14.6%的复合年增长率快速成长,预计到2030年,照明市场规模将达到56亿美元。可变冷媒流量冷却器和智慧风门能够根据蒸腾作用调节气流,从而减少废热。灌溉软体,例如Netafim GrowSphere,整合了水力学和农艺数据,实现了营养液的自动施用。结构构件正逐渐转向多层聚碳酸酯,因为其隔热性能提高了20-30%,但对于价格敏感的农场来说,低成本薄膜仍然占据主导地位。控制面板是成长最快的细分市场,它将感测器、水泵和照明设备整合到一个类似平板电脑的介面中,从而节省了人力。
硬体製造商现在销售的捆绑式软体包包括预先安装太阳能逆变器的锅炉、与帘子网同步的LED灯以及为人工智慧作物模型供水的灌溉泵。设备生态系统正趋向于整合式即插即用套件,从而降低了新进入商业温室市场的企业的准入风险。
水果和蔬菜将占商业温室市场的64%,预计到2024年销售额将超过290亿美元。大麻和特种作物的复合年增长率(CAGR)为15%。美国大麻种植者协会(BDSA)估计,到2028年,合法大麻的销售额将达到580亿美元,占美国总销售额的80%。种植者透过维持远高于叶菜类蔬菜利润率的批发价格来证明其高资本支出的合理性。微型菜苗苗盘可在14天内完成生长,每公斤可产生25-40美元的收入,带来快速的现金回报。育种者正与温室所有者合作,培育LED优化品种,以缩短10-12%的种植週期。
高价值作物需要精确的蒸气压差(VPD)、高效能空气过滤(HEPA)和冗余电源,这推动了对整合安防和暖通空调(HVAC)套件的需求。垂直育苗架可将幼苗密度提高200-300%,而檯面育苗则可降低电费。
区域分析
到2024年,欧洲将占商业温室市场31%的份额。荷兰1万公顷的高科技玻璃温室和西班牙2.6万公顷的塑胶温室为全年供应提供了保障。欧盟绿色新政的补贴鼓励使用生质锅炉、地热钻井和LED照明昇级,从而减缓了能源价格的上涨。自动化消除了劳动力瓶颈,如今移动机器人可以在夜间采摘葡萄。
亚太地区是成长最快的地区,复合年增长率达11.6%。中国400万公顷耕地支撑全球粮食生产。日本2024年水稻歉收引发了对封闭式绿色农场的新一轮投资。印度为儿童游乐场资本支出提供高达50%的补贴,韩国则在改进半封闭式草莓种植系统以出口。城市消费者收入不断增长,对食品安全的要求也越来越高,他们正将资金投入更干净、可追溯的农产品。
北美地区呈现持续成长态势。美国新建蔬菜温室面积超过1.12亿平方英尺,较2017年成长19%。安大略省利明顿丛集利用低成本的水力发电和工业二氧化碳,为中西部地区的杂货店供货。墨西哥利用政府对节水技术的支持,扩大网室番茄的种植规模,供应国内和美国市场。连锁餐厅的ESG(环境、社会和治理)承诺进一步提振了国内对生菜的需求,强化了商业温室产业在区域粮食安全中的作用。
其他福利:
- Excel格式的市场预测(ME)表
- 3个月的分析师支持
目录
第一章 引言
- 研究假设和市场定义
- 调查范围
第二章调查方法
第三章执行摘要
第四章 市场情势
- 市场概览
- 市场驱动因素
- 耕地面积减少,城市扩张
- 全年对新鲜农产品的需求
- 气候变迁导致天气变化
- LED和HVAC控制技术的进步
- 低碳农产品的碳信用货币化
- 温室即服务租赁模式
- 市场限制
- 高初始资本支出
- 照明和空调能源成本不断上涨
- 受控环境农业中的人力资源差距
- 深入探讨塑胶废弃物和体积碳排放
- 监管环境
- 技术展望
- 波特五力模型
- 供应商的议价能力
- 买方的议价能力
- 新进入者的威胁
- 替代品的威胁
- 竞争对手之间的竞争
第五章 市场规模与成长预测
- 透过装置
- 暖气系统
- 冷却和通风系统
- LED发光照明
- 灌溉和施肥
- 控制和自动化软体
- 结构构件(嵌装玻璃、框架)
- 按作物类型
- 水果和蔬菜
- 花朵
- 香草和微型菜苗
- 大麻和特种作物
- 按温室类型
- 玻璃温室
- 温室
- 硬质聚碳酸酯温室
- 透过技术
- 水耕
- 非水耕(土壤/基材)
- 混合型和垂直整合型
- 最终用户
- 商业生产者
- 研究和教育机构
- 园艺中心和苗圃
- 地区
- 北美洲
- 美国
- 加拿大
- 墨西哥
- 北美其他地区
- 南美洲
- 巴西
- 阿根廷
- 其他南美洲
- 欧洲
- 德国
- 英国
- 法国
- 西班牙
- 俄罗斯
- 其他欧洲地区
- 亚太地区
- 中国
- 日本
- 印度
- 韩国
- 亚太其他地区
- 中东
- 沙乌地阿拉伯
- 阿拉伯聯合大公国
- 土耳其
- 中东其他地区
- 非洲
- 南非
- 埃及
- 肯亚
- 其他非洲地区
- 北美洲
第六章 竞争情势
- 市场集中度
- 策略趋势
- 市占率分析
- 公司简介
- Richel Group
- Certhon
- Gibraltar Industries(RBI)
- Logiqs BV
- Agra-Tech Inc.
- Van Wingerden Greenhouse Company
- Texas Greenhouse Company
- Harnois Industries
- Ceres Greenhouse Solutions
- Netafim
- Van der Hoeven Horticultural Projects
第七章 市场机会与未来展望
The commercial greenhouse market size reached USD 46.7 billion in 2025 and is projected to reach USD 68.5 billion by 2030, advancing at a 7.9% CAGR throughout the forecast period.
The commercial greenhouse market is scaling swiftly as land suited for open-field cultivation dwindles, extreme weather undermines yield reliability, and retailers seek pesticide-free produce that arrives every week of the year. Growers are replacing single-layer structures with climate-tight facilities powered by on-site renewables, AI-guided fertigation, and high-efficacy LEDs that cut operating costs and carbon footprints. Greenhouse-as-a-service contracts convert lump-sum construction bills into predictable fees, opening the commercial greenhouse market to mid-sized farmers who previously lacked collateral for large loans. Europe currently accounts for the largest share, yet Asia-Pacific's urbanization and food-security incentives make it the fastest-growing territory. Fragmented competition is giving way to platform plays, as heating, lighting, and irrigation suppliers merge portfolios into single dashboards.
Global Commercial Greenhouse Market Trends and Insights
Shrinking Arable Land and Urban Expansion
Roughly 12 million hectares of productive soil disappear every year, while urban surfaces are projected to triple by 2030. Diversified commercial greenhouse market operators answer that squeeze with protected cultivation systems that deliver 10-15 times the yield per square meter of open fields. China manages more than 4 million hectares of protected cropping, about 80% of the planet's total, showcasing the model's scalability. Capital-intensive facilities now stack benches three high, run conveyors through narrow aisles, and rely on AI scheduling to boost usable space by 40%. Peri-urban land prices have jumped 200-300% over the last decade; growers, therefore, find the commercial greenhouse market economically superior despite higher construction costs.
Demand for Year-Round Fresh Produce
Big-box grocers want steady shelves regardless of season. Walmart's multi-state partnerships with controlled-environment suppliers illustrate retailer confidence in the commercial greenhouse market, Local Bounti. Generation Z shoppers pay 20-40% premiums for January tomatoes grown within 200 km, widening margins for tech-enabled farms. Net cash flow can reach USD 33,000 per ha in well-run hydroponic houses at the University of Florida IFAS. Consistent caliber also trims shrinkage and lifts shelf life, reinforcing the case for year-round output.
High Up-Front Capital Expenditure
Entry-level film houses cost USD 250-400/m2, while high-spec glass or polycarbonate structures reach USD 800-1,200/m2, locking many smallholders out of the commercial greenhouse market size. To break even, projects must secure gross margins of 30-40% and profit margins of 10-15%, a hurdle that demands tight crop scheduling and premium price realization. Specialized lenders now offer 7-10-year loans, yet monetary tightening since 2022 has pushed interest rates 200-300 bp higher, inflating debt service. Greenhouse-as-a-service contracts spread capital costs over 10-15 years, but lessees still need solid forward-purchase agreements to satisfy underwriters. Higher insurance premiums for storm-prone zones add another layer of fixed cost, making financial viability sensitive to utility rebates and carbon credit revenue. As a result, many growers phase construction in small modules, scaling acreage only after proven cash flow.
Other drivers and restraints analyzed in the detailed report include:
- Climate-Change-Induced Weather Volatility
- Advances in LED and Climate-Control Technology
- Rising Energy Costs for Lighting and HVAC
For complete list of drivers and restraints, kindly check the Table Of Contents.
Segment Analysis
Heating retained the largest share at 28% in 2024, underscoring climate control's universal role. LED arrays are the fastest growers at a 14.6% CAGR, with the lighting slice of the commercial greenhouse market size projected to top USD 5.6 billion by 2030. Variable-refrigerant-flow coolers and smart dampers now align airflow with transpiration rates, trimming waste heat. Irrigation software exemplified by Netafim GrowSphere unifies hydraulic and agronomic data, automating nutrient dosing. Structural parts shift toward multi-wall polycarbonate for 20-30% better insulation, but the low-cost film still dominates price-sensitive farms. Control dashboards are the fastest-expanding subsegment, consolidating sensors, pumps, and lights into one tablet view that saves labor.
Hardware makers now market bundled packages: boilers pre-wired to solar inverters, LEDs synchronized with shade screens, and fertigation pumps that feed AI crop models. The equipment ecosystem is converging on integrated, plug-and-play kits that de-risk adoption for newcomers to the commercial greenhouse market.
Fruits and vegetables led revenue with 64% of the commercial greenhouse market in 2024, translating to more than USD 29 billion. Cannabis and specialty crops are advancing at a 15% CAGR. BDSA sees legal cannabis sales hitting USD 58 billion by 2028, 80% of the United States. Producers justify high CAPEX with wholesale prices that remain several multiples above leafy-green margins. Micro-green trays finish in under 14 days and earn USD 25-40/kg, delivering swift cash recovery. Breeders collaborate with greenhouse owners to spawn LED-optimised cultivars that shave grow cycles by 10-12%.
High-value crops need precise VPD, HEPA filtration, and redundant power, fuelling demand for integrated security and HVAC kits. Vertical propagation racks raise seedling density by 200-300%, while bench-level finishing cuts electricity bills, illustrating the hybrid strategies permeating the commercial greenhouse market.
The Greenhouse Market Report is Segmented by Equipment Type (Heating Systems, and More), by Crop Type (Fruits and Vegetables, and More), by Greenhouse Type (Glass Greenhouse, Plastic-Film Greenhouse, and More), by Technology (Hydroponic, Non-Hydroponic, and More), by End-Use (Commercial Growers, and More) and Geography (North America, Europe, and More). The Market Forecasts are Provided in Terms of Value (USD).
Geography Analysis
Europe commanded 31% of the commercial greenhouse market in 2024. The Netherlands' 10,000 ha of high-tech glasshouses and Spain's 26,000 ha plastic-house cluster underpin year-round supply. EU Green Deal subsidies fuel biomass boilers, geothermal drills, and LED upgrades that blunt high energy prices. Automation addresses labor bottlenecks, as mobile robots pick vine crops during night shifts.
Asia-Pacific is the fastest-rising region at an 11.6% CAGR. China's 4 million ha footprint anchors global volume. Japan's 2024 rice shock triggered fresh funding for sealed green farms. India subsidizes up to 50% of playhouse CAPEX, while South Korea refines semi-closed strawberry systems for export. Urban consumers with rising incomes and food-safety expectations are steering capital toward cleaner, traceable produce.
North America shows durable growth. The United States hosts more than 112 million ft2 of vegetable greenhouses, up 19% since 2017. Ontario's Leamington cluster taps low-cost hydropower and industrial CO2 to supply Midwest grocers. Mexico expands net-house tomatoes for both domestic and US markets, leveraging government support for water-efficient tech. ESG pledges from restaurant chains further lift domestic demand for low-mile lettuce, consolidating the commercial greenhouse industry's role in regional food security.
- Richel Group
- Certhon
- Gibraltar Industries (RBI)
- Logiqs B.V.
- Agra-Tech Inc.
- Van Wingerden Greenhouse Company
- Texas Greenhouse Company
- Harnois Industries
- Ceres Greenhouse Solutions
- Netafim
- Van der Hoeven Horticultural Projects
Additional Benefits:
- The market estimate (ME) sheet in Excel format
- 3 months of analyst support
TABLE OF CONTENTS
1 Introduction
- 1.1 Study Assumptions and Market Definition
- 1.2 Scope of the Study
2 Research Methodology
3 Executive Summary
4 Market Landscape
- 4.1 Market Overview
- 4.2 Market Drivers
- 4.2.1 Shrinking arable land and urban expansion
- 4.2.2 Demand for year-round fresh produce
- 4.2.3 Climate-change-induced weather volatility
- 4.2.4 Advances in LED and climate-control technology
- 4.2.5 Carbon-credit monetization for low-footprint produce
- 4.2.6 Greenhouse-as-a-Service leasing models
- 4.3 Market Restraints
- 4.3.1 High up-front capital expenditure
- 4.3.2 Rising energy costs for lighting and HVAC
- 4.3.3 The talent gap in controlled-environment agronomy
- 4.3.4 Plastic waste and embodied carbon scrutiny
- 4.4 Regulatory Landscape
- 4.5 Technological Outlook
- 4.6 Porter's Five Forces
- 4.6.1 Bargaining Power of Suppliers
- 4.6.2 Bargaining Power of Buyers
- 4.6.3 Threat of New Entrants
- 4.6.4 Threat of Substitutes
- 4.6.5 Intensity of Competitive Rivalry
5 Market Size and Growth Forecasts (Value, USD)
- 5.1 By Equipment Type
- 5.1.1 Heating Systems
- 5.1.2 Cooling and Ventilation Systems
- 5.1.3 LED Grow-Lighting
- 5.1.4 Irrigation and Fertigation
- 5.1.5 Control and Automation Software
- 5.1.6 Structural Components (Glazing, Frames)
- 5.2 By Crop Type
- 5.2.1 Fruits and Vegetables
- 5.2.2 Flowers and Ornamentals
- 5.2.3 Herbs and Micro-greens
- 5.2.4 Cannabis and Specialty Crops
- 5.3 By Greenhouse Type
- 5.3.1 Glass Greenhouses
- 5.3.2 Plastic-film Greenhouses
- 5.3.3 Rigid Polycarbonate Greenhouses
- 5.4 By Technology
- 5.4.1 Hydroponic
- 5.4.2 Non-hydroponic (Soil/Substrate)
- 5.4.3 Hybrid and Vertical Integration
- 5.5 By End-user
- 5.5.1 Commercial Growers
- 5.5.2 Research and Educational Institutes
- 5.5.3 Retail Garden Centres and Nurseries
- 5.6 Geography
- 5.6.1 North America
- 5.6.1.1 United States
- 5.6.1.2 Canada
- 5.6.1.3 Mexico
- 5.6.1.4 Rest of North America
- 5.6.2 South America
- 5.6.2.1 Brazil
- 5.6.2.2 Argentina
- 5.6.2.3 Rest of South America
- 5.6.3 Europe
- 5.6.3.1 Germany
- 5.6.3.2 United Kingdom
- 5.6.3.3 France
- 5.6.3.4 Spain
- 5.6.3.5 Russia
- 5.6.3.6 Rest of Europe
- 5.6.4 Asia-Pacific
- 5.6.4.1 China
- 5.6.4.2 Japan
- 5.6.4.3 India
- 5.6.4.4 South Korea
- 5.6.4.5 Rest of Asia-Pacific
- 5.6.5 Middle East
- 5.6.5.1 Saudi Arabia
- 5.6.5.2 United Arab Emirates
- 5.6.5.3 Turkey
- 5.6.5.4 Rest of the Middle East
- 5.6.6 Africa
- 5.6.6.1 South Africa
- 5.6.6.2 Egypt
- 5.6.6.3 Kenya
- 5.6.6.4 Rest of Africa
- 5.6.1 North America
6 Competitive Landscape
- 6.1 Market Concentration
- 6.2 Strategic Moves
- 6.3 Market Share Analysis
- 6.4 Company Profiles (includes Global Level Overview, Market Level Overview, Core Segments, Financials as available, Strategic Information, Market Rank / Share for key companies, Products and Services, and Recent Developments)
- 6.4.1 Richel Group
- 6.4.2 Certhon
- 6.4.3 Gibraltar Industries (RBI)
- 6.4.4 Logiqs B.V.
- 6.4.5 Agra-Tech Inc.
- 6.4.6 Van Wingerden Greenhouse Company
- 6.4.7 Texas Greenhouse Company
- 6.4.8 Harnois Industries
- 6.4.9 Ceres Greenhouse Solutions
- 6.4.10 Netafim
- 6.4.11 Van der Hoeven Horticultural Projects
7 Market Opportunities and Future Outlook
 商业温室市场按结构类型、作物类型、系统类型、能源来源和最终用途划分-全球预测,2025-2032智慧温室市场:按产品、技术、自动化程度、应用和最终用户划分-2025-2032年全球预测高科技温室市场(按作物类型、栽培系统、温室技术、最终用途和建筑类型划分)—全球预测,2025-2032 年
 2025年全球商业温室市场报告
 全球高端温室市场
 智慧温室市场-2025年至2030年的预测
 商业温室市场:依类型、依温室类型、按地区
 智慧温室:市场占有率分析、产业趋势与统计、成长预测(2025-2030 年)
 2025 年至 2033 年商业温室市场报告(按类型、所用材料、技术、作物和地区)
 商业温室市场 - 全球产业规模、份额、趋势、机会和预测,按产品类型、类型、设备、地区和竞争细分,2020-2030 年