


 |
市场调查报告书
商品编码
1939041
建筑资讯模型(BIM):市场占有率分析、产业趋势与统计数据、成长预测(2026-2031)Building Information Modeling - Market Share Analysis, Industry Trends & Statistics, Growth Forecasts (2026 - 2031) |
||||||
※ 本网页内容可能与最新版本有所差异。详细情况请与我们联繫。
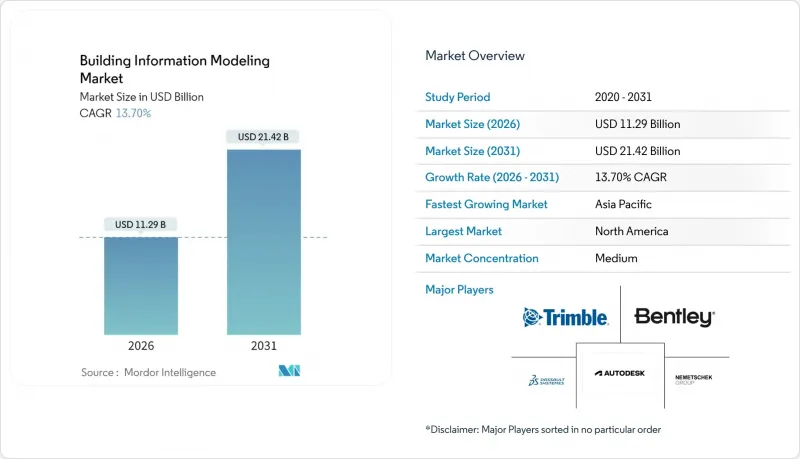
建筑资讯模型(BIM)市场预计将从 2025 年的 99.3 亿美元成长到 2026 年的 112.9 亿美元,预计到 2031 年将达到 214.2 亿美元,2026 年至 2031 年的复合年增长率为 13.7%。
建筑、工程、施工和营运领域的快速数位转型,使得BIM从简单的视觉化工具发展成为云端协作平台。政府监管的日益严格、人工智慧和数数位双胞胎的整合,以及SaaS模式的广泛应用(降低了中小企业的初期成本),都推动了BIM的成长。供应商正将4D进度安排、5D成本估算和永续性分析等功能作为标准配置,使得用户转换的门槛居高不下。激烈的市场竞争推动BIM不断升级,提升互通性和工作流程自动化水平,也使得使用者在整个计划生命週期中更加依赖订阅生态系统。
全球BIM市场趋势与洞察
数位化要求和 ISO 19650 合规性加速了全球 BIM 的普及应用。
在公共工程领域强制使用BIM正在推动成熟建筑经济体数位化交货工作流程的标准化。英国要求到2025年,所有超过500万英镑的公共工程都必须采用3级BIM,透过促进结构化资料交换来降低采购风险。超过60%的欧洲公共机构已发布正式的BIM策略,鼓励私人开发商遵循类似的标准。美国多个州和加拿大省份的类似政策也产生了类似的连锁反应。基于ISO 19650的标准化简化了跨国合作,消除了合约歧义,并缩短了新相关人员的上手时间,从而直接推动了建筑资讯模型市场的普及。
数位双胞胎驱动的资产生命週期管理的兴起
业主们正越来越多地将BIM模型与物联网感测器连接起来,创建即时数位双胞胎模型,从而优化维护并减少停机时间。采用感测器驱动孪生模型的建筑报告称,年度营运成本降低了5%,维护响应时间缩短了35%。营运阶段(占拥有成本的80%)的量化节省正促使设施营运商将其传统模型升级为数据丰富的孪生模型,从而推动BIM市场在营运阶段的软体和业务收益成长。
中小型承包商面临高昂的许可证和培训成本
初始授权费用可能超过1万美元,而年度续约和硬体升级又会增加总拥有成本,这令许多中小企业望而却步。新加坡的生产力解决方案补助金等财政援助计画(可补贴高达50%的软体成本)在一定程度上减轻了负担,但在可预见的未来,成本敏感度可能仍将是BIM市场发展的限制因素。
细分市场分析
软体收入占比高达67.30%(价值66.8亿美元)。 Revit和Archicad等设计套件是模型创建的入门级工具,其整合的4D和5D功能如今已被视为基本功能,而非高级附加元件。持续更新并融入人工智慧驱动的碰撞侦测功能,有效降低了客户流失率,并推动了BIM市场的发展。
随着业主和承包商将模型开发、协调和分析外包,BIM业务收益正以15.6%的复合年增长率成长。外包使公司能够在无需承担固定薪资负担的情况下利用稀缺人才。在欧洲和亚洲,专业的BIM顾问公司经常被聘请参与复杂的公共交通项目,这扩大了BIM服务市场的潜在规模。
到2025年,本地部署将占总收入的71.10%,即70.6亿美元。大型设计公司更倾向于使用符合严格资料主权法规的本地伺服器。虽然FedRAMP和ISO 27001等安全认证正在逐步缓解人们的担忧,但根深蒂固的工作流程却阻碍了迁移进程。
云采用率正以18.1%的复合年增长率成长。订阅授权模式降低了资本支出,并实现了即时扩展,使分散的企划团队能够即时协作处理模式。疫情证明了远距办公的可行性后,许多公司将SaaS视为面向未来的工作方式,BIM市场的重点也正稳步转向託管解决方案。
区域分析
预计到2025年,北美地区将创造37.1亿美元的收入,占全球收入的37.40%。联邦政府的基础设施支出以及数位化交货的需求正在推动交通运输和公共产业领域的广泛应用。美国BIM市场规模的成长得益于标准化物件库,这些物件库简化了采购和生命週期管理。
欧洲则位居第二,这得益于英国和德国的强制性政策,预计到 2025 年,该地区的收入将达到 31.2 亿美元,到 2033 年将翻倍。像 Nemec 这样的区域软体领导者利用其与学术研究的紧密联繫,保持强大的技能供应,并提高 BIM 市场的竞争力。
亚太地区是成长最快的地区,复合年增长率达14.6%。中国的智慧城市计画、日本为解决劳动力短缺问题而大力推动自动化以及印度不断扩展的交通走廊,都显着推动了市场需求。新加坡政府对软体支出的补贴计画是区域内政策主导发展的标桿,进一步促进了BIM市场的扩张。
儘管中东和非洲地区面积不大,但海湾国家展现出强劲的成长动能。沙乌地阿拉伯的NEOM等大型企划正在采用全面的数位双胞胎策略,树立了新的区域标准。各国正在进行能力建设项目,提升本地人才技能,逐步减少对进口技术的依赖。
其他福利:
- Excel格式的市场预测(ME)表
- 3个月的分析师支持
目录
第一章 引言
- 研究假设和市场定义
- 调查范围
第二章调查方法
第三章执行摘要
第四章 市场情势
- 市场概览
- 市场驱动因素
- 强制数位化和与 ISO 19650 标准的接轨将加速 BIM 在全球的普及。
- 数位双胞胎驱动的资产生命週期管理的兴起
- 绿建筑和净零排放合规压力
- 模组化/异地施工中无缝预製协调的必要性
- 云端采用和SaaS定价降低了进入门槛。
- 透过人工智慧驱动的衍生设计和预测分析提高生产力
- 市场限制
- 中小型承包商面临高昂的许可证和培训成本
- 编写工具与开放标准之间的互通性
- 云端工作流程中网路安全和智慧财产权保护的担忧
- 老牌企业对流程再造存在文化抵触情绪
- 价值/价值链分析
- 监理与技术展望
- 波特五力分析
- 供应商的议价能力
- 买方的议价能力
- 新进入者的威胁
- 替代品的威胁
- 竞争对手之间的竞争
第五章 市场规模与成长预测
- 按解决方案类型
- 软体
- 方面
- 3D
- 4D
- 5D
- 6D
- 7天或以上
- 方面
- 服务
- 咨询顾问
- 部署与集成
- 培训和支持
- 託管服务
- 软体
- 透过部署模式
- 本地部署
- 云
- 计划生命週期阶段
- 施工前期(规划与设计)
- 施工(现场施工)
- 建设后(营运/维护)
- 透过使用
- 商业建筑
- 住宅建筑
- 工业和製造设施
- 基础建设(公路、铁路、机场、港口、桥樑)
- 机构(医疗保健、教育、政府)
- 其他用途
- 最终用户
- 建筑师和设计师
- 工程师(结构、机电)
- 承包商和建设公司
- 业主和开发人员
- 设施和资产管理
- 顾问和计划经理
- 按地区
- 北美洲
- 我们
- 加拿大
- 墨西哥
- 南美洲
- 巴西
- 阿根廷
- 其他南美洲
- 欧洲
- 德国
- 英国
- 法国
- 义大利
- 北欧国家
- 其他欧洲地区
- 中东
- 阿拉伯聯合大公国
- 沙乌地阿拉伯
- 土耳其
- 其他中东地区
- 非洲
- 南非
- 其他非洲地区
- 亚太地区
- 中国
- 日本
- 印度
- 韩国
- 东南亚
- 亚太其他地区
- 北美洲
第六章 竞争情势
- 市场集中度
- 策略性倡议(併购、资金筹措、合作)
- 市占率分析
- 公司简介
- Autodesk Inc.
- Nemetschek SE
- Bentley Systems Inc.
- Trimble Inc.
- Dassault Systemes SE
- Hexagon AB
- AVEVA Group PLC
- Asite Solutions Ltd
- RIB Software GmbH
- Graphisoft SE
- Allplan GmbH
- Topcon Positioning Systems Inc.
- Procore Technologies Inc.
- ACCA Software SPA
- Revizto SA
- CMiC Inc.
- Beck Technology Ltd
- Vectorworks Inc.
- Tekla Corporation(Trimble)
- Bimeye Inc.
第七章 市场机会与未来展望
The building information modeling market is expected to grow from USD 9.93 billion in 2025 to USD 11.29 billion in 2026 and is forecast to reach USD 21.42 billion by 2031 at 13.7% CAGR over 2026-2031.
Rapid digital transformation across architecture, engineering, construction and operations is expanding BIM from a visualization tool into a cloud-enabled collaboration platform. Growth is reinforced by tighter government mandates, integration with artificial intelligence and digital twins, and wider SaaS availability that lowers up-front costs for smaller firms. Vendors are also embedding 4D scheduling, 5D cost estimation and sustainability analytics as default capabilities, which keeps switching barriers high. Intense competition is prompting continuous upgrades that improve interoperability and workflow automation, deepening user reliance on subscription ecosystems throughout the project lifecycle.
Global Building Information Modeling Market Trends and Insights
E-mandates and ISO 19650 alignment accelerating global BIM uptake
Mandated BIM use on public projects is normalizing digital delivery workflows across mature construction economies. The United Kingdom's requirement for Level 3 BIM on public projects above GBP 5 million by 2025 encourages structured data exchanges that lower procurement risk. More than 60% of European public agencies now publish formal BIM strategies, which pushes private developers to follow the same standards. Comparable policies in several US states and provinces in Canada have the same cascading effect. Standardization around ISO 19650 simplifies cross-border collaboration, reduces contractual ambiguity and shortens onboarding time for new stakeholders, directly lifting adoption rates for the building information modeling market.
Rise of digital-twin-enabled asset lifecycle management
Owners increasingly connect BIM models with IoT sensors to generate live digital twins that optimize maintenance and reduce downtime. Buildings equipped with sensor-linked twins have reported 5% annual operating cost cuts and 35% faster maintenance response times. The promise of quantified savings during the 80% cost-of-ownership phase is compelling facility operators to upgrade legacy models into data-rich twins, which lifts software and service revenues throughout the operational stage of building information modeling market adoption.
High Licensing & Training Costs for SME Contractors
Initial seat licenses can exceed USD 10,000 while annual renewals and hardware upgrades increase total cost of ownership, causing many small firms to defer adoption. Funding programs such as Singapore's Productivity Solutions Grant that reimburses up to 50% of software expenses partially mitigate the burden, yet cost sensitivity remains a near-term drag on the building information modeling market.
Other drivers and restraints analyzed in the detailed report include:
- Green-building and net-zero compliance pressures
- Modular or off-site construction demanding seamless prefab coordination
- Interoperability & open-standards gaps across authoring tools
For complete list of drivers and restraints, kindly check the Table Of Contents.
Segment Analysis
Software holds a 67.30% revenue share worth USD 6.68 billion. Authoring suites such as Revit and Archicad remain the entry point for model creation, with integrated 4D and 5D functions now interpreted as table stakes rather than premium add-ons. Continuous updates that incorporate AI-driven clash detection keep customer churn low, anchoring the building information modeling market.
Service revenue is rising at a 15.6% CAGR as owners and contractors outsource model development, coordination and analytics. Outsourcing gives firms access to scarce talent without fixed payroll commitments. Complex public-transportation schemes in Europe and Asia commonly appoint specialist BIM consultancies, expanding the addressable building information modeling market size for services.
On-premises installations represent USD 7.06 billion and 71.10% of 2025 revenue. Large design houses favor local servers that align with strict data-sovereignty rules. Security certifications such as FedRAMP and ISO 27001 are gradually easing those concerns, yet entrenched workflows slow migration.
Cloud deployments are growing at 18.1% CAGR. Subscription licensing lowers capital expenditure and delivers instant scalability, letting dispersed project teams co-author models in real time. After pandemic-driven remote work proved viable, many firms adopted SaaS to future-proof operations, steadily shifting the center of gravity of the building information modeling market toward hosted solutions.
The Building Information Modeling Market Report is Segmented by Solution (Software, Services), Deployment Mode (On-Premises, Cloud), Project Lifecycle Stage (Pre-Construction, Construction, Post-Construction), Application (Commercial Buildings, Residential Buildings, and More), End User (Architects and Designers, Engineers, and More), and Geography. The Market Forecasts are Provided in Terms of Value (USD).
Geography Analysis
North America generated USD 3.71 billion and 37.40% of global revenue in 2025. Federal infrastructure spending tied to digital-delivery requirements fuels broad adoption across transportation and utilities. The building information modeling market size in the United States benefits from standardized object libraries that simplify procurement and lifecycle management.
Europe ranks second, anchored by mandates in the United Kingdom and Germany. The continent's 2025 revenue reached USD 3.12 billion and is on course to double by 2033. Regional software champions such as Nemetschek leverage close ties to academic research, which sustains a robust skills pipeline and keeps the building information modeling market competitive.
Asia-Pacific is the fastest-growing region at 14.6% CAGR. China's smart-city initiatives, Japan's automation push to counter labor shortages, and India's expanding transport corridors create substantial volume. Government incentives in Singapore that cover a portion of software expenditure make it the region's benchmark for policy-led progress, further enlarging the building information modeling market.
The Middle East and Africa remain smaller but exhibit strong momentum in Gulf states. Mega-projects like NEOM in Saudi Arabia adopt full digital-twin strategies, setting new regional standards. Capacity-building programs are underway to upskill local talent, gradually reducing reliance on imported expertise.
- Autodesk Inc.
- Nemetschek SE
- Bentley Systems Inc.
- Trimble Inc.
- Dassault Systemes SE
- Hexagon AB
- AVEVA Group PLC
- Asite Solutions Ltd
- RIB Software GmbH
- Graphisoft SE
- Allplan GmbH
- Topcon Positioning Systems Inc.
- Procore Technologies Inc.
- ACCA Software SPA
- Revizto SA
- CMiC Inc.
- Beck Technology Ltd
- Vectorworks Inc.
- Tekla Corporation (Trimble)
- Bimeye Inc.
Additional Benefits:
- The market estimate (ME) sheet in Excel format
- 3 months of analyst support
TABLE OF CONTENTS
1 INTRODUCTION
- 1.1 Study Assumptions and Market Definition
- 1.2 Scope of the Study
2 RESEARCH METHODOLOGY
3 EXECUTIVE SUMMARY
4 MARKET LANDSCAPE
- 4.1 Market Overview
- 4.2 Market Drivers
- 4.2.1 E-mandates and ISO 19650 Alignment Accelerating Global BIM Uptake
- 4.2.2 Rise of Digital-Twin-enabled Asset Lifecycle Management
- 4.2.3 Green-Building and Net-Zero Compliance Pressures
- 4.2.4 Modular / Off-site Construction Demanding Seamless Prefab Coordination
- 4.2.5 Cloud adoption and SaaS pricing lowering entry barriers
- 4.2.6 AI-driven generative design and predictive analytics boosting productivity
- 4.3 Market Restraints
- 4.3.1 High Licensing and Training Costs for SME Contractors
- 4.3.2 Interoperability and Open-Standards Gaps Across Authoring Tools
- 4.3.3 Cyber-security and IP Protection Concerns in Cloud Workflows
- 4.3.4 Cultural Resistance to Process Re-engineering in Legacy Firms
- 4.4 Value/Supply-Chain Analysis
- 4.5 Regulatory and Technological Outlook
- 4.6 Porter's Five Forces Analysis
- 4.6.1 Bargaining Power of Suppliers
- 4.6.2 Bargaining Power of Buyers
- 4.6.3 Threat of New Entrants
- 4.6.4 Threat of Substitutes
- 4.6.5 Intensity of Competitive Rivalry
5 MARKET SIZE AND GROWTH FORECASTS (VALUE)
- 5.1 By Solution Type
- 5.1.1 Software
- 5.1.1.1 Dimension
- 5.1.1.1.1 3D
- 5.1.1.1.2 4D
- 5.1.1.1.3 5D
- 5.1.1.1.4 6D
- 5.1.1.1.5 7D and Beyond
- 5.1.1.1 Dimension
- 5.1.2 Services
- 5.1.2.1 Consulting and Advisory
- 5.1.2.2 Implementation and Integration
- 5.1.2.3 Training and Support
- 5.1.2.4 Managed Services
- 5.1.1 Software
- 5.2 By Deployment Mode
- 5.2.1 On-premises
- 5.2.2 Cloud
- 5.3 By Project Lifecycle Stage
- 5.3.1 Pre-construction (Planning and Design)
- 5.3.2 Construction (Site Execution)
- 5.3.3 Post-construction (Operations and Maintenance)
- 5.4 By Application
- 5.4.1 Commercial Buildings
- 5.4.2 Residential Buildings
- 5.4.3 Industrial and Manufacturing Facilities
- 5.4.4 Infrastructure (Roads, Rail, Airports, Ports, Bridges)
- 5.4.5 Institutional (Healthcare, Education, Government)
- 5.4.6 Other Applications
- 5.5 By End User
- 5.5.1 Architects and Designers
- 5.5.2 Engineers (Structural, MEP)
- 5.5.3 Contractors and Builders
- 5.5.4 Owners and Developers
- 5.5.5 Facilities and Asset Managers
- 5.5.6 Consultants and Project Managers
- 5.6 By Geography
- 5.6.1 North America
- 5.6.1.1 United States
- 5.6.1.2 Canada
- 5.6.1.3 Mexico
- 5.6.2 South America
- 5.6.2.1 Brazil
- 5.6.2.2 Argentina
- 5.6.2.3 Rest of South America
- 5.6.3 Europe
- 5.6.3.1 Germany
- 5.6.3.2 United Kingdom
- 5.6.3.3 France
- 5.6.3.4 Italy
- 5.6.3.5 Nordics
- 5.6.3.6 Rest of Europe
- 5.6.4 Middle East
- 5.6.4.1 United Arab Emirates
- 5.6.4.2 Saudi Arabia
- 5.6.4.3 Turkey
- 5.6.4.4 Rest of Middle East
- 5.6.5 Africa
- 5.6.5.1 South Africa
- 5.6.5.2 Rest of Africa
- 5.6.6 Asia-Pacific
- 5.6.6.1 China
- 5.6.6.2 Japan
- 5.6.6.3 India
- 5.6.6.4 South Korea
- 5.6.6.5 Southeast Asia
- 5.6.6.6 Rest of Asia-Pacific
- 5.6.1 North America
6 COMPETITIVE LANDSCAPE
- 6.1 Market Concentration
- 6.2 Strategic Moves (M&A, Funding, Partnerships)
- 6.3 Market Share Analysis
- 6.4 Company Profiles (includes Global-level Overview, Market-level Overview, Core Segments, Financials as available, Strategic Information, Market Rank/Share, Products and Services, Recent Developments)
- 6.4.1 Autodesk Inc.
- 6.4.2 Nemetschek SE
- 6.4.3 Bentley Systems Inc.
- 6.4.4 Trimble Inc.
- 6.4.5 Dassault Systemes SE
- 6.4.6 Hexagon AB
- 6.4.7 AVEVA Group PLC
- 6.4.8 Asite Solutions Ltd
- 6.4.9 RIB Software GmbH
- 6.4.10 Graphisoft SE
- 6.4.11 Allplan GmbH
- 6.4.12 Topcon Positioning Systems Inc.
- 6.4.13 Procore Technologies Inc.
- 6.4.14 ACCA Software SPA
- 6.4.15 Revizto SA
- 6.4.16 CMiC Inc.
- 6.4.17 Beck Technology Ltd
- 6.4.18 Vectorworks Inc.
- 6.4.19 Tekla Corporation (Trimble)
- 6.4.20 Bimeye Inc.
7 MARKET OPPORTUNITIES AND FUTURE OUTLOOK
- 7.1 White-space and Unmet-need Assessment
 建筑资讯模型(BIM)市场:依组件、部署类型、专案生命週期、建筑类型、应用和最终用户划分 - 全球预测至2036年
 建筑资讯模型 (BIM) 市场分析及至 2035 年预测:按类型、产品类型、服务、技术、组件、应用、流程、部署类型、最终用户和阶段划分
 建筑资讯模型市场-全球产业规模、份额、趋势、机会及预测(按组件、计划阶段、应用、最终用户、地区和竞争格局划分,2021-2031年)
 工程资讯管理软体市场:按组件、最终用户产业、应用、组织规模和部署模式划分,全球预测(2026-2032年)建筑声学软体市场按实施类型、授权类型、组织规模、应用、最终用户和分销管道划分-2026-2032年全球预测
 日本建筑资讯模型市场报告(按产品类型、部署模式、应用、最终用户产业、最终用户和地区划分,2026-2034 年)
 建筑资讯模型(BIM)市场规模、份额和成长分析(按组件、功能、公司类型、技术、部署模式、最终用户和地区划分)-2026-2033年产业预测5D建筑资讯模型市场按组件、应用、最终用户、部署和计划类型划分-全球预测,2025-2032年
 2025年全球建筑资讯模型市场报告建筑资讯模型市场:按组件、部署类型、计划规模、应用程式和最终用户 - 2025-2030 年全球预测