


 |
市场调查报告书
商品编码
1851375
电动车充电站:市场份额分析、行业趋势、统计数据和成长预测(2025-2030 年)Electric Vehicle Charging Station - Market Share Analysis, Industry Trends & Statistics, Growth Forecasts (2025 - 2030) |
||||||
※ 本网页内容可能与最新版本有所差异。详细情况请与我们联繫。
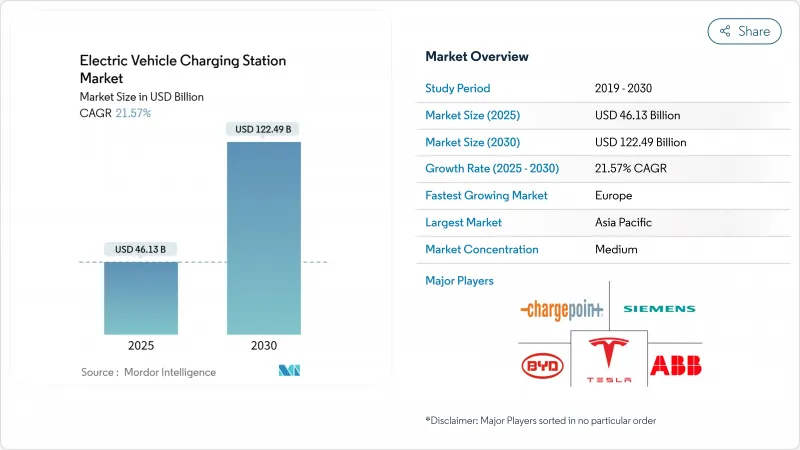
预计到 2025 年,电动车充电站市场规模将达到 461.3 亿美元,到 2030 年将达到 1,224.9 亿美元,在预测期(2025-2030 年)内,复合年增长率将达到 21.57%。
持续的政策压力促使内燃机汽车逐步淘汰,电池成本的快速下降推动了电动车和电动车的普及,高速公路快速充电走廊的建设也缓解了里程焦虑,这些都是推动电动车需求飙升的核心因素。大型车队营运商正在製定多年电气化目标,以确保充电桩的高运作,而Vehicle-to-Grid)经营模式正在创造新的收入来源,从而提高计划回报。虽然亚太地区仍占大部分的安装量,但欧洲目前正经历最快的成长,这主要得益于跨境网路合作。在北美,NEVI Formula计画以及特斯拉向其他品牌开放其超级充电系统正在加速电动车的普及,并提高了人们对基准技术的期望。同时,壳牌等能源巨头正在关闭加油站,并将资金转向高功率充电桩,这标誌着策略转变,将加剧市场竞争。
全球电动车充电站市场趋势与洞察
政府零排放指令和内燃机禁令时间表
随着各国政府实施具有约束力的零排放车辆强制规定,并明确规定了具体的充电容量要求,监管正在加速充电基础设施的部署。欧盟的《替代燃料基础设施法规》要求成员国根据註册电动车的数量按比例增加充电容量。同时,加州的《先进清洁车队规则》要求公共和私营车队营运商在各自规定的期限内过渡到零排放车辆。中国国家发展和改革委员会计划在2024年之前,透过在高速公路服务区新增3000个充电桩和5000个停车位来扩大充电基础设施,从而助力中国占40.9%的新能源汽车市场发展。沙乌地阿拉伯承诺在2025年建成5万个充电站,而阿联酋则设定了2050年实现50%的电动或混合动力汽车保有量的目标。这些强制性规定创造了可预测的需求讯号,为私人资本投资充电基础设施提供了合理性,从而降低了投资风险并加速了市场扩张。
电池价格/千瓦时下跌推动整体拥有成本与市场持平
随着电动车的总拥有成本逐渐接近与内燃机汽车持平的关键阈值,电池成本的下降正在推动对充电基础设施的需求。目前,主要采购合约中锂离子电池组的价格已低于100美元/千瓦时,这有助于电动车在用车量较大的细分市场实现与汽油动力汽车的成本持平。诸如碳化硅逆变器等组件创新提高了充电效率,减少了能量损耗,并使营运商能够以每千瓦的装置容量服务更多车辆。更便宜的电池也使得换电站模式成为可能,从而可以将资本投资分散到各个车队,并扩展电动车充电站产业的业务范围。电池成本下降和充电效率提高的共同作用,缩短了充电时间,降低了对基础设施利用率的要求,加速了部署的经济效益。这是因为电池成本的下降使得更小的充电量和更频繁的充电成为可能,从而优化了营运灵活性。
功率超过150千瓦的充电桩需要较高的初始投资。
高功率充电基础设施所需的资本支出是其部署的一大障碍,尤其对于独立营运商和新兴市场而言更是如此。 P3集团对欧洲电动卡车充电基础设施的分析预测,到2030年,欧洲需要4.5万个公共充电桩和23.5万个停车场充电桩,并指出高昂的初始资本支出和漫长的电网扩建核准流程是主要挑战。加州能源委员会的一项研究表明,直流快速充电站面临巨大的资金筹措挑战,需要透过降低需求电费每年节省4300美元,并透过太阳能併网每年节省4780至6000美元,才能提高其可行性。部署能够为重型车辆输出高达3.75兆瓦功率的兆瓦级充电系统,需要对电力基础设施进行大规模维修,每个安装项目的成本将超过100万美元。高额的资本支出尤其限制了农村和欠发达地区的部署,这些地区的利用率可能不足以抵消投资,从而造成充电基础设施可用性的地理差异。
细分市场分析
2024年,乘用车占据了电动车充电站市场份额的89.10%,而商用车将以55.47%的复合年增长率(CAGR)实现最快增长,直至2030年,这反映了车辆电气化强制要求的基础设施需求。公车是电气化进程中的关键商用领域,由于都市区空气品质法规和可预测的路线模式,其充电基础设施的最佳化部署将加速发展。两轮车在新兴市场,尤其是印度,正获得越来越多的关注,电池更换模式已被证明在经济上可行。卡车由于重量限制和营运需求,需要最先进的充电基础设施,这推动了高功率充电系统和基于站点的充电解决方案的创新。
商用车电气化为车队营运商创造了稳定的需求,使其充电基础设施投资更具合理性,因为商用车的使用模式可预测,且功率需求高于乘用车。 CharIN 在奥斯陆举行的 EVS35 大会上正式发布了其兆瓦级充电系统,为高达 3.75 兆瓦的充电容量树立了新标准,使商用车能够与柴油动力车辆并驾齐驱。商用车的普及也惠及乘用车基础设施,因为共用充电走廊可以降低每辆车的基础设施成本,并提高各类车辆的网路利用率。
至2024年,直流充电站将维持78.70%的电动车充电站市场份额,并在预测期内以56.29%的复合年增长率加速成长。橡树岭国家实验室在无线充电技术领域取得了突破性进展,成功实现了透过5吋(约12.7公分)的空气间隙向乘用车传输100千瓦的功率,效率高达96%,展现了颠覆传统连接器式充电模式的潜力。 22千瓦以下的交流充电主要用于家庭和职场,可以适应更长的充电时间和更慢的充电速度。商用车兆瓦级充电系统的出现将催生一个独立的超高高功率类别,需要专门的电力基础设施和冷却系统。
SAE International 发布了一项新的小型电动车无线充电标准,其中包括一种差分感应定位系统,可实现不同供应商硬体之间的互通性,效率高达 93%。无线充电技术解决了用户对便利性的担忧,并透过消除易磨损和人为破坏的实体连接器,降低了基础设施维护需求。向高功率充电系统的过渡反映了营运商的经济效益:更短的充电时间可提高充电站利用率并提升投资回报率,尤其是在交通繁忙、土地成本足以支撑高速充电的地区。
区域分析
亚太地区将在2024年以60.70%的市场份额引领电动车充电站市场,这主要得益于中国1,282万个公共充电桩的建设以及每年25%的新增装置成长。目前,中国已在6000个高速公路服务区设立了国家级充电站,确保了远距覆盖,这与中国新能源汽车40.9%的销售构成比相符。日本正在为重型卡车率先开发兆瓦级充电系统,而印度的两轮车换电中心则展现了低成本出行需求将如何加速充电桩的普及。在贸易摩擦的背景下,韩国正努力成为电池材料的替代供应商,而澳洲则在偏远走廊地带投资建造充电站,以连接遥远的城市间。
欧洲的成长速度最快,到2030年复合年增长率将达到42.68%。 Spark联盟在25个国家整合了11,000个高功率充电桩,提供透明的价格和100%可再生电力。德国计划在2030年建成超过100万个充电桩,符合欧盟将基础设施分配与电动车註册挂钩的规定。挪威仍然是人均充电桩安装数量的世界领导者,法国则透过低利率贷款鼓励私人用户使用充电桩。英国的政策将从2035年起禁止销售大多数新的汽油动力汽车,并强制要求公共充电桩支持支付卡互通性,这进一步增强了消费者的信心。
在北美,NEVI Formula的50亿美元资金筹措20.4万个公共充电桩。由七家汽车製造商组成的IONNA合资企业将新增3万个高功率连接器,并对特斯拉超级充电桩维修,使其能够兼容多个品牌,预计到2030年将创造60亿至120亿美元的额外收入。跨产业合作将把充电设施与零售配套设施连接起来,并效仿欧洲的服务站模式。
其他福利:
- Excel格式的市场预测(ME)表
- 3个月的分析师支持
目录
第一章 引言
- 研究假设和市场定义
- 调查范围
第二章调查方法
第三章执行摘要
第四章 市场情势
- 市场概览
- 市场驱动因素
- 政府零排放指令和内燃机禁令时间表
- 电池价格(每度)的下降将有助于降低总拥有成本。
- 全球高速公路快速充电走廊发展现状
- 主要物流公司对车辆电气化的承诺迅速增加
- 网格服务货币化(V2G/V2X)经营模式
- 人工智慧优化的充电器安装提高了使用率
- 市场限制
- 功率超过150千瓦的充电桩需要大量的初始投资。
- 不均衡的授权和公用设施併网时间表
- SiC MOSFET原料瓶颈
- 连网充电器的网路安全漏洞
- 监管环境
- 波特五力模型
- 新进入者的威胁
- 买方的议价能力
- 供应商的议价能力
- 替代品的威胁
- 竞争对手之间的竞争
第五章 市场规模与成长预测
- 按车辆类型
- 搭乘用车
- 商用车辆
- 公车和长途客车
- 按充电器类型
- 交流充电站
- 直流充电站
- 自有车型
- 公共
- 私人住宅
- 平民 - 舰队/职场
- 按安装位置
- 自己的家
- 外出/零售
- 公路/交通
- 舰队仓库
- 依连接器标准
- CCS
- CHAdeMO
- GB/T
- 特斯拉 NACS
- 无线的
- 按地区
- 北美洲
- 美国
- 加拿大
- 北美其他地区
- 南美洲
- 巴西
- 智利
- 其他南美洲国家
- 欧洲
- 德国
- 英国
- 法国
- 挪威
- 义大利
- 西班牙
- 荷兰
- 波兰
- 奥地利
- 俄罗斯
- 其他欧洲地区
- 亚太地区
- 中国
- 日本
- 印度
- 韩国
- 印尼
- 越南
- 菲律宾
- 澳洲
- 纽西兰
- 亚太其他地区
- 中东和非洲
- 沙乌地阿拉伯
- 阿拉伯聯合大公国
- 埃及
- 土耳其
- 南非
- 其他中东和非洲地区
- 北美洲
第六章 竞争情势
- 市场集中度
- 策略趋势
- 市占率分析
- 公司简介
- ABB Ltd.
- ChargePoint Inc.
- Tesla Inc.
- Siemens AG
- Schneider Electric Corporation
- Shell Plc.
- ENGIE SA(EVBox)
- BYD Motors Inc.
- Tritium Charging Inc.
- Blink Charging o.
- Delta Electronics Inc.
- Kempower Oyj
- Electrify America, LLC
- IONITY GmbH
- Leviton Manufacturing Co. Inc.
第七章 市场机会与未来展望
The electric vehicle charging station market generated USD 46.13 billion in 2025 and is forecast to reach USD 122.49 billion by 2030, registering a 21.57% CAGR during the forecast period (2025-2030).
Continuous policy pressure to phase out internal-combustion engines, steep battery cost declines that bring total ownership parity forward, and the roll-out of highway fast-charging corridors that neutralize range anxiety are the core forces keeping demand on a steep climb. Large fleet operators are locking in multi-year electrification targets, guaranteeing high charger utilization, while vehicle-to-grid business models create additional revenue layers that lift project returns. Asia-Pacific still accounts for most installations, but Europe now supplies the fastest incremental growth on the back of cross-border network alliances. In North America, the NEVI Formula Program and the opening of Tesla's Supercharger system to other brands accelerate deployment while raising baseline technology expectations. Meanwhile, energy majors like Shell are closing petroleum stations and reallocating capital toward high-power chargers, signaling a strategic shift that tightens competitive intensity.
Global Electric Vehicle Charging Station Market Trends and Insights
Government-backed Zero-emission Mandates and ICE-ban Timelines
Regulatory momentum accelerates charging infrastructure deployment as governments implement binding zero-emission vehicle mandates with specific charging capacity requirements. The EU's Alternative Fuels Infrastructure Regulation mandates that member states increase charging capacity proportionally to EV registrations. At the same time, California's Advanced Clean Fleets Rule requires public and private fleet operators to transition to zero-emission vehicles by sector-specific deadlines. China's National Development and Reform Commission expanded highway service area charging infrastructure by adding 3,000 charging piles and 5,000 parking spaces in 2024, supporting the country's 40.9% new energy vehicle market penetration. Saudi Arabia's commitment to 50,000 charging stations by 2025 and the UAE's target of 50% electric or hybrid vehicles by 2050 extend regulatory pressure to emerging markets. These mandates create predictable demand signals that justify private capital deployment in charging infrastructure, reducing investment risk and accelerating market expansion.
Falling Battery $/kWh Driving TCO Parity
Battery cost reductions approach the critical threshold where electric vehicles achieve total cost of ownership parity with internal combustion engines, catalyzing charging infrastructure demand. Lithium-ion pack prices now edge below USD 100/kWh in leading procurement contracts, helping electric cars reach cost parity with petrol equivalents in usage-heavy segments. Component innovations such as silicon-carbide inverters raise charging efficiency and lower energy losses, allowing operators to serve more vehicles per installed kilowatt. Cheaper batteries also enable swap-station models that spread capex across fleets, broadening service formats within the electric vehicle charging station industry. The convergence of falling battery costs and improved charging efficiency creates a compounding effect where reduced charging times and lower infrastructure utilization requirements accelerate deployment economics. Commercial fleet operators particularly benefit from this dynamic, as reduced battery costs enable smaller, more frequent charging sessions that optimize operational flexibility.
High Upfront CAPEX for More Than 150 kW Chargers
Capital expenditure requirements for high-power charging infrastructure create deployment barriers, particularly for independent operators and emerging markets. The P3 Group analysis of European eTruck charging infrastructure forecasts 45,000 public and 235,000 depot charging points needed by 2030, with high initial capital expenditures and lengthy approval processes for grid expansions identified as primary challenges. The California Energy Commission research demonstrated that DC fast charging stations face significant financing challenges, with potential annual savings of USD 4,300 from demand charge mitigation and USD 4,780 to USD 6,000 from solar integration required to improve viability. The deployment of megawatt charging systems, capable of delivering up to 3.75 MW for heavy-duty vehicles, requires substantial electrical infrastructure upgrades exceeding USD 1 million per installation site. High CAPEX requirements particularly constrain deployment in rural and underserved areas where utilization rates may not justify investment, creating geographic disparities in charging infrastructure availability.
Other drivers and restraints analyzed in the detailed report include:
- Global Build-out of Highway Fast-charging Corridors
- Surging Fleet-Electrification Commitments from Logistics Giants
- Uneven Permitting and Utility Interconnection Timelines
For complete list of drivers and restraints, kindly check the Table Of Contents.
Segment Analysis
Passenger cars commanded 89.10% of the electric vehicle charging station market share in 2024, yet commercial vehicles exhibit the fastest growth at 55.47% CAGR through 2030, reflecting the infrastructure requirements for fleet electrification mandates. Buses represent a critical commercial segment where electrification accelerates due to urban air quality mandates and predictable route patterns that enable optimized charging infrastructure deployment. Two-wheelers gain traction in emerging markets where battery swapping models prove economically viable, particularly in India. Trucks require the most sophisticated charging infrastructure due to weight constraints and operational demands, driving innovation in high-power charging systems and depot-based solutions.
Commercial vehicle electrification creates anchor demand that justifies charging infrastructure investment, as fleet operators provide predictable utilization patterns and higher power requirements than passenger vehicles. CharIN officially launched the Megawatt Charging System at EVS35 in Oslo, establishing standards for charging capacities up to 3.75 MW that enable commercial vehicles to achieve operational parity with diesel counterparts. Passenger car infrastructure benefits from commercial vehicle deployment as shared charging corridors reduce per-unit infrastructure costs and improve network utilization rates across vehicle categories.
DC charging station maintained 78.70% of the electric vehicle charging station market share in 2024, while it accelerated at 56.29% CAGR during the forecast period, driven by operator strategies to reduce charging session duration and increase throughput. Oak Ridge National Laboratory achieved a breakthrough in wireless charging technology, demonstrating 100-kW power transfer to passenger vehicles with 96% efficiency across a five-inch air gap, potentially disrupting traditional connector-based charging. AC charging below 22 kW serves primarily residential and workplace applications where longer dwell times accommodate slower charging speeds, while maintaining cost advantages for installations with lower utilization requirements. The emergence of megawatt charging systems for commercial vehicles creates a distinct ultra-high-power category that requires specialized electrical infrastructure and cooling systems.
SAE International published new standards for wireless light-duty EV charging, including the Differential Inductive Positioning System that enables cross-compatibility among different suppliers' hardware with up to 93% efficiency. Wireless charging technology addresses user convenience concerns and reduces infrastructure maintenance requirements by eliminating physical connectors that experience wear and vandalism. The transition toward higher-power charging systems reflects operator economics. Reduced charging times enable higher station utilization and improved return on investment, particularly in high-traffic locations where land costs justify premium charging speeds.
The Electric Vehicle Charging Station Market Report is Segmented by Vehicle Type (Passenger Cars, Commercial Vehicles, and More), Charger Type (AC Charging Station, and DC Charging Station), Ownership Model (Public, and More), Installation Site (Home, and More), Connector Standard (CCS, and More), and Geography. The Market Forecasts are Provided in Terms of Value (USD).
Geography Analysis
Asia-Pacific leads the electric vehicle charging station market with a 60.70% share in 2024, supported by China's 12.82 million public connectors and a 25% annual installation increase. National programs now equip 6,000 highway service areas, ensuring long-distance coverage mirrors the country's 40.9% new-energy vehicle sales mix. Japan pioneers megawatt systems for heavy trucks, while India's two-wheeler battery-swapping hubs show how low-cost mobility needs can accelerate charger density. South Korea is positioning itself as an alternative battery-material supplier amid trade tensions, and Australia funds remote-area corridor sites to bridge its vast intercity distances.
Europe shows the fastest regional growth at 42.68% CAGR to 2030. The Spark Alliance integrates 11,000 high-power connectors across 25 countries, offering transparent pricing and 100% renewable electricity. Germany's plan for more than 1 million new charging points by 2030 aligns with EU regulations that tie infrastructure quotas to EV registrations. Norway retains the world's highest per-capita charger count, while France uses low-interest loans to spur private deployments. UK policy bans sales of most new petrol cars from 2035 and now mandates payment-card interoperability at public chargers, further strengthening consumer confidence.
North America accelerates through the NEVI Formula's USD 5 billion funding, enabling 204,000 public ports. The seven-automaker IONNA venture will add 30,000 high-power connectors, and the retrofitting of Tesla Superchargers for multi-brand use could generate USD 6-12 billion in additional revenue by 2030. Cross-industry alliances link charging to retail amenities, mirroring European service-station strategies.
- ABB Ltd.
- ChargePoint Inc.
- Tesla Inc.
- Siemens AG
- Schneider Electric Corporation
- Shell Plc.
- ENGIE SA (EVBox)
- BYD Motors Inc.
- Tritium Charging Inc.
- Blink Charging o.
- Delta Electronics Inc.
- Kempower Oyj
- Electrify America, LLC
- IONITY GmbH
- Leviton Manufacturing Co. Inc.
Additional Benefits:
- The market estimate (ME) sheet in Excel format
- 3 months of analyst support
TABLE OF CONTENTS
1 Introduction
- 1.1 Study Assumptions and Market Definition
- 1.2 Scope of the Study
2 Research Methodology
3 Executive Summary
4 Market Landscape
- 4.1 Market Overview
- 4.2 Market Drivers
- 4.2.1 Government-backed zero-emission mandates and ICE-ban timelines
- 4.2.2 Falling battery $/kWh driving TCO parity
- 4.2.3 Global build-out of highway fast-charging corridors
- 4.2.4 Surging fleet-electrification commitments from logistics giants
- 4.2.5 Grid-services monetisation (V2G/V2X) business models
- 4.2.6 AI-optimised charger siting improving utilisation rates
- 4.3 Market Restraints
- 4.3.1 High upfront CAPEX for More Than 150 kW chargers
- 4.3.2 Uneven permitting and utility interconnection timelines
- 4.3.3 Raw-material bottlenecks for SiC MOSFETs
- 4.3.4 Cyber-security vulnerabilities in networked chargers
- 4.4 Regulatory Landscape
- 4.5 Porter's Five Forces
- 4.5.1 Threat of New Entrants
- 4.5.2 Bargaining Power of Buyers
- 4.5.3 Bargaining Power of Suppliers
- 4.5.4 Threat of Substitutes
- 4.5.5 Competitive Rivalry
5 Market Size and Growth Forecasts (Value (USD))
- 5.1 By Vehicle Type
- 5.1.1 Passenger Cars
- 5.1.2 Commercial Vehicles
- 5.1.3 Buses and Coaches
- 5.2 By Charger Type
- 5.2.1 AC Charging Station
- 5.2.2 DC Charging Station
- 5.3 By Ownership Model
- 5.3.1 Public
- 5.3.2 Private - Residential
- 5.3.3 Private - Fleet/Workplace
- 5.4 By Installation Site
- 5.4.1 Home
- 5.4.2 Destination/Retail
- 5.4.3 Highway/Transit
- 5.4.4 Fleet Depot
- 5.5 By Connector Standard
- 5.5.1 CCS
- 5.5.2 CHAdeMO
- 5.5.3 GB/T
- 5.5.4 Tesla NACS
- 5.5.5 Wireless
- 5.6 By Geography
- 5.6.1 North America
- 5.6.1.1 United States
- 5.6.1.2 Canada
- 5.6.1.3 Rest of North America
- 5.6.2 South America
- 5.6.2.1 Brazil
- 5.6.2.2 Chile
- 5.6.2.3 Rest of South America
- 5.6.3 Europe
- 5.6.3.1 Germany
- 5.6.3.2 United Kingdom
- 5.6.3.3 France
- 5.6.3.4 Norway
- 5.6.3.5 Italy
- 5.6.3.6 Spain
- 5.6.3.7 Netherlands
- 5.6.3.8 Poland
- 5.6.3.9 Austria
- 5.6.3.10 Russia
- 5.6.3.11 Rest of Europe
- 5.6.4 Asia-Pacific
- 5.6.4.1 China
- 5.6.4.2 Japan
- 5.6.4.3 India
- 5.6.4.4 South Korea
- 5.6.4.5 Indonesia
- 5.6.4.6 Vietnam
- 5.6.4.7 Philippines
- 5.6.4.8 Australia
- 5.6.4.9 New Zealand
- 5.6.4.10 Rest of Asia-Pacific
- 5.6.5 Middle East and Africa
- 5.6.5.1 Saudi Arabia
- 5.6.5.2 United Arab Emirates
- 5.6.5.3 Egypt
- 5.6.5.4 Turkey
- 5.6.5.5 South Africa
- 5.6.5.7 Rest of Middle East and Africa
- 5.6.1 North America
6 Competitive Landscape
- 6.1 Market Concentration
- 6.2 Strategic Moves
- 6.3 Market Share Analysis
- 6.4 Company Profiles (includes Global level Overview, Market level overview, Core Segments, Financials as available, Strategic Information, Market Rank/Share, Products and Services, and Recent Developments)
- 6.4.1 ABB Ltd.
- 6.4.2 ChargePoint Inc.
- 6.4.3 Tesla Inc.
- 6.4.4 Siemens AG
- 6.4.5 Schneider Electric Corporation
- 6.4.6 Shell Plc.
- 6.4.7 ENGIE SA (EVBox)
- 6.4.8 BYD Motors Inc.
- 6.4.9 Tritium Charging Inc.
- 6.4.10 Blink Charging o.
- 6.4.11 Delta Electronics Inc.
- 6.4.12 Kempower Oyj
- 6.4.13 Electrify America, LLC
- 6.4.14 IONITY GmbH
- 6.4.15 Leviton Manufacturing Co. Inc.
7 Market Opportunities and Future Outlook
- 7.1 White-space and Unmet-Need Assessment
 液冷式电动车充电线缆市场机会、成长驱动因素、产业趋势分析及预测(2025-2034年)
 动态电动车充电网路市场预测至2032年:按充电技术、车辆类型、部署环境、基础设施所有权模式、功率等级和区域分類的全球分析2032 年超快速电动车充电市场预测:按充电标准、部署模式、安装类型、技术、应用、最终用户和地区进行的全球分析
 商用车辆充电站市场按车辆类型、充电器输出功率、充电技术、终端用户产业和所有权类型划分-2025-2032年全球预测2032 年电动车充电站设备市场预测:按充电站类型、功率输出、组件、安装类型、供应商类型、连接器类型、最终用户和地区进行的全球分析电动车充电站市场(按充电类型、连接器类型、营运、经营模式和最终用途)—2025-2030 年全球预测电动车充电站软体市场(按软体类型、部署类型、充电站类型、最终用户和应用)—2025 年至 2030 年全球预测
 全球商用车充电桩市场全球直流电动车快速充电站市场全球交流电电动车充电站市场