


 |
市场调查报告书
商品编码
1851396
光学感测器:市场份额分析、行业趋势、统计数据和成长预测(2025-2030 年)Optical Sensor - Market Share Analysis, Industry Trends & Statistics, Growth Forecasts (2025 - 2030) |
||||||
※ 本网页内容可能与最新版本有所差异。详细情况请与我们联繫。
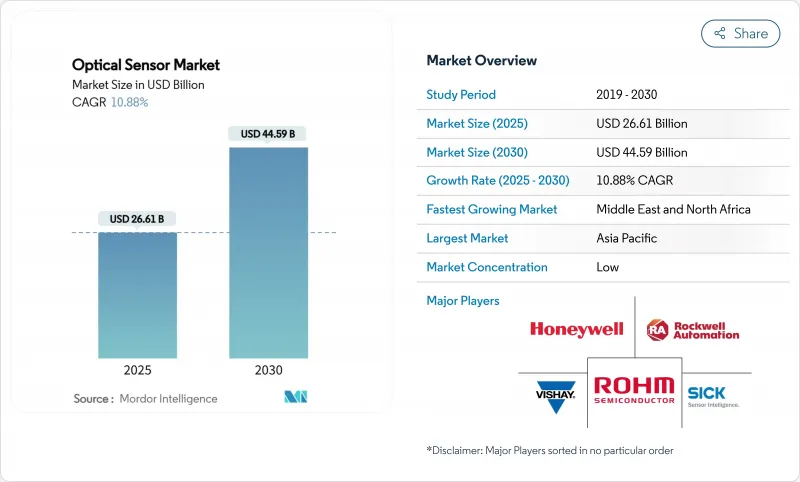
预计到 2025 年,光学感测器市场规模将达到 266.1 亿美元,到 2030 年将达到 445.9 亿美元,复合年增长率为 10.88%。
围绕汽车安全、环境监测和资料隐私的持续监管压力,推动了对整合化、高性价比硅光电设计的需求。晶圆级光电价格的下降以及网路边缘人工智慧工作负载的激增,正在加速5G基础设施、自动驾驶汽车和分散式光纤监测等领域对感测器的应用。高纯度二氧化硅和锗的供应风险凸显了多元化采购的必要性,而穿戴式装置和智慧型手机的小型化需求则持续推动大规模生产转移到亚太地区。随着小型公司部署光子整合技术并与老牌半导体製造商竞争,竞争日益激烈。
全球光学感测器市场趋势与洞察
亚太地区消费性电子产品对穿戴式光学器件小型化的需求
为了达到预期的发光效率目标,AR眼镜和智慧型穿戴装置需要亚毫米级的光学堆迭结构。由意法半导体(STMicroelectronics)推出的单层超构光学元件可将透镜高度降低70%,从而实现旗舰智慧型手机的萤幕下近距离感应功能。磷化铟垂直腔面发射雷射(VCSEL)取代了砷化镓(GaAs)发射器,为空间受限的装置提供了更小的光束发散角。亚太地区的契约製造製造商正利用这些技术发展赢得西方品牌的订单,巩固了在该地区33%的市场份额。
工业IoT的普及推动了光纤感测器在恶劣环境下的应用
分散式光纤感测技术可提供公里级的温度和应变数据,且不受电磁干扰,从而实现炼油厂、管道和高压变电站的预测性维护。罗克韦尔自动化指出,对这类数据进行早期预警分析,可将流程工业的非计画停机时间减少30%。基于人工智慧的模式辨识技术,结合连续的光学回馈,正成为北美和欧洲工业4.0策略的基石。
高纯度二氧化硅预製件的供应链限制
2024年的飓风造成的网路中断暴露了单一地区对光纤供应的限製作用。再加上中国对锗出口的限制,製造商们正以高价谈判长期合同,这延缓了分散式光纤解决方案的大规模部署。合成二氧化硅新兴企业正在涌现,但距离商业性规模应用仍需两到三年。
细分市场分析
受多相机智慧型手机和高级驾驶辅助系统(ADAS)部署的推动,影像感测器将在2024年保持42%的光学感测器市场份额。SONY的堆迭式CMOS技术将支援120帧/秒的4K影片拍摄,并满足工厂自动化所需的机器视觉精度要求。光纤感测器虽然目前绝对收入较小,但随着基础设施营运商转向公里级结构健康监测,预计将达到12.7%的最高复合年增长率。这一成长动能将推动光纤解决方案的光学感测器市场规模从2025年的47亿美元成长到2030年的86亿美元。分散式声学感测、管线安全和周界入侵侦测系统是推动市场成长的关键因素。
光电感测器、环境光感测器和接近感测器的多样化发展势头依然强劲,但平均售价的下降给组件製造商带来了压力。像Vishay公司厚度仅为0.5毫米的超紧凑型接近模组支援无边框行动电话设计,而全局百叶窗工业相机则消除了机器人取放应用中的运动模糊。其他频谱成像器则支援精密农业和食品安全萤光检测,并实现了两位数的成长。
儘管单光子Avalanche二极体 (SPAD) 和Avalanche光电二极体 (APD) 等尖端检测器的出货量低于标准光电二极体,但它们的售价却很高。 SPAD 阵列可提供皮秒级的飞行时间数据,雷射雷达系统正是利用这些数据为自动驾驶车辆提供精确的距离测量。在发射器方面,设计团队正从 LED 转向 VCSEL 和边发射雷射器,以提供更高的光输出和更精确的频谱控制。
光学元件和滤光片每克重量的价值最高,因为它们的精密镀膜和严格的公差对新参与企业构成了挑战。 MetaOptics 正在革新镜头设计,以单层图案化结构取代多元件堆迭,在保持性能的同时减少尺寸和重量。处理电子装置也在遵循同样的路径:更多功能被整合到感测器晶粒上,边缘人工智慧可以在本地运行,从而降低延迟并减轻频宽需求。
光学感测器市场按感测器类型(影像感测器、光纤感测器及其他)、感测技术(固有感测器及其他)、组件(光电探测器、光源及其他)、波长(紫外光、可见光及其他)、输出终端用户应用(家用电子电器、工业自动化与机器人及其他)以及地区进行细分。市场预测以美元计价。
区域分析
亚太地区将占2024年总营收的33%,这反映了元件工厂、模组组装和消费性电子品牌之间的紧密合作。中国和越南的代工製造商目前生产的接近感测器晶片平均售价低于0.09美元,进一步巩固了其在该地区的成本领先地位。日本的精密光学生态系统支援符合AEC-Q102标准的汽车雷射雷达模组,而韩国的晶圆代工厂正在挑战堆迭式影像感测器的产量比率极限。
法规主导的应用在欧洲市场占据主导地位。一家德国一级供应商已获得一份长期合同,为其提供符合欧洲新车安全评价协会(Euro NCAP)视觉系统指令的近红外线成像阵列。随着欧盟甲烷排放法规的日益严格,光纤气体洩漏监测在北海平台周围的应用也日益广泛。 GDPR合规性正推动原始设备製造商(OEM)转向设备端生物识别分析,从而促进内建感测器的应用。
北美在测试新概念方面继续保持领先地位。预计2024-2025年,光子学新兴企业的创业融资将超过7亿美元,其中边缘人工智慧光链路特别引人注目。环保机构正在部署分散式光纤网路用于甲烷定量分析,这些网路通常由绿色债券发行提供资金。同时,沙乌地阿拉伯和阿联酋正在智慧城市计划中部署高光谱遥测相机阵列,预计将推动中东地区实现13.6%的复合年增长率。
其他福利:
- Excel格式的市场预测(ME)表
- 3个月的分析师支持
目录
第一章 引言
- 研究假设和市场定义
- 调查范围
第二章调查方法
第三章执行摘要
第四章 市场情势
- 市场概览
- 市场驱动因素
- 亚太地区消费性电子市场对小型化穿戴光学元件的需求
- 工业IoT的普及推动了光纤感测器在恶劣环境下的应用
- 欧洲近红外线影像感测器加速了汽车ADAS和雷射雷达的整合。
- 快速部署 5G 和边缘资料中心需要高速光感
- 日益严格的环境监测法规推动北美分散式光纤感测技术的发展
- 硅光电的进步降低了整合光学感测器的物料清单成本
- 市场限制
- 高纯度二氧化硅预製件的供应链限制
- 低阶智慧型手机的价格敏感度限制了先进接近感测器。
- 频谱感测器校准的复杂性阻碍了中小企业的采用。
- 欧盟生物辨识光学感测器引发的资料隐私担忧
- 价值/供应链分析
- 监理与技术展望
- 波特五力分析
- 供应商的议价能力
- 买方的议价能力
- 新进入者的威胁
- 替代品的威胁
- 竞争对手之间的竞争
- 定价分析
- 投资和资金筹措趋势
第五章 市场规模与成长预测
- 依感测器类型
- 影像感测器
- 光纤感测器
- 光电感测器
- 环境光和接近感测器
- 其他(位置、触摸、频谱)
- 透过感测技术
- 外置光感测器
- 内建光感应器
- 按组件
- 光电探测器(光电二极体、雪崩光电二极体、单光子雪崩光电二极体)
- 光源(LED、VCSEL、雷射)
- 光学元件和滤波器
- 积体电路和过程电子
- 波长
- 紫外光(100-400奈米)
- 可见光(400-700奈米)
- 近红外线(700-1400奈米)
- 短波红外线/中红外线(波长大于1400奈米)
- 按产量计
- 模拟
- 数位的
- 透过最终用户使用
- 消费性电子产品
- 工业自动化与机器人
- 汽车/运输设备
- 医疗保健和医疗设备
- 生物辨识与安全
- 航太/国防
- 能源与环境监控
- 按地区
- 北美洲
- 美国
- 加拿大
- 墨西哥
- 欧洲
- 英国
- 德国
- 法国
- 义大利
- 其他欧洲地区
- 亚太地区
- 中国
- 日本
- 印度
- 韩国
- 亚太其他地区
- 中东
- 以色列
- 沙乌地阿拉伯
- 阿拉伯聯合大公国
- 土耳其
- 其他中东地区
- 非洲
- 南非
- 埃及
- 其他非洲地区
- 南美洲
- 巴西
- 阿根廷
- 其他南美洲
- 北美洲
第六章 竞争情势
- 市场集中度
- 策略性倡议(併购、合资、产品发布、资金筹措)
- 市占率分析
- 公司简介
- ams-OSRAM AG
- Sony Group Corporation
- Hamamatsu Photonics KK
- ON Semiconductor Corp.
- ROHM Co., Ltd.
- SICK AG
- Keyence Corporation
- Teledyne Technologies Inc.
- STMicroelectronics NV
- Vishay Intertechnology Inc.
- Honeywell International Inc.
- IFM Electronic GmbH
- Pepperl+Fuchs SE
- Rockwell Automation Inc.
- Samsung Electronics Co. Ltd.
- Cognex Corporation
- FLIR Systems(Teledyne FLIR)
- Omnivision Technologies Inc.
- Lumentum Holdings Inc.
- Excelitas Technologies Corp.
- Thorlabs, Inc.
第七章 市场机会与未来展望
The optical sensors market reached USD 26.61 billion in 2025 and is projected to climb to USD 44.59 billion by 2030, advancing at a 10.88% CAGR.
Consistent regulatory pressure on automotive safety, environmental monitoring, and data privacy is steering demand toward integrated, cost-efficient silicon-photonics-based designs. Price drops in wafer-level photonics and the proliferation of AI workloads at the network edge are accelerating sensor adoption in 5G infrastructure, autonomous vehicles, and distributed fiber-optic monitoring. Material-supply risks around high-purity silica and germanium underscore the need for diversified sourcing, while miniaturization requirements in wearables and smartphones continue to shift volume production to Asia-Pacific. Competitive intensity is rising as smaller firms deploy photonic integration to rival long-established semiconductor players.
Global Optical Sensor Market Trends and Insights
Miniaturization Demand for Wearable Optics in APAC Consumer Electronics
AR glasses and smart wearables now require sub-millimeter optical stacks that still meet luminous-efficiency targets. Single-layer meta-optics introduced by STMicroelectronics cut lens height by 70%, permitting under-display proximity sensing in flagship smartphones. Indium-phosphide VCSELs are replacing GaAs emitters, delivering tighter beam divergence for space-constrained devices. APAC contract manufacturers leverage these developments to secure design wins from Western brands, reinforcing the region's 33% revenue share position.
Industrial IoT Adoption Fuelling Fiber-optic Sensors in Harsh Environments
Distributed fiber sensing provides kilometre-scale temperature and strain data immune to electromagnetic interference, enabling predictive maintenance across refineries, pipelines, and high-voltage substations. Rockwell Automation notes that early-warning analytics on such data can eliminate 30% of unplanned downtime in process industries. Coupling AI-based pattern recognition with continuous optical feedback is becoming a cornerstone of Industry 4.0 strategies in North America and Europe.
Supply-Chain Constraints for High-Purity Silica Preforms
Quartz mined from a handful of Appalachian deposits accounts for most global preform feedstock; Hurricane-induced outages in 2024 exposed how a single locale can squeeze optical-fiber availability. Coupled with China's export restrictions on germanium, manufacturers are negotiating long-term contracts at price premiums, delaying large-volume deployments of distributed fiber solutions. Synthetic-silica start-ups are emerging, but commercial scaling remains two to three years out.
Other drivers and restraints analyzed in the detailed report include:
- Automotive ADAS & LiDAR Integration Accelerating NIR Image Sensors in Europe
- Advances in Silicon Photonics Lowering Bill-of-Materials Cost for Integrated Optical Sensors
- Data-Privacy Concerns Around Biometric Optical Sensors in EU
For complete list of drivers and restraints, kindly check the Table Of Contents.
Segment Analysis
Image sensors retained 42% share of the optical sensors market in 2024, buoyed by multi-camera smartphones and ADAS roll-outs. Sony's stacked CMOS technology pushes 120 fps 4-K capture, meeting machine-vision tolerances for factory automation. Fiber-optic sensors, while smaller in absolute revenue, are forecast to post the highest 12.7% CAGR as infrastructure operators shift toward kilometre-scale structural health monitoring. This traction lifts the optical sensors market size for fiber-optic solutions from USD 4.7 billion in 2025 toward USD 8.6 billion by 2030. Distributed acoustic sensing, pipeline security, and perimeter intrusion systems are the chief volume drivers.
Diversification across photoelectric, ambient light, and proximity sensors remains steady, although ASP erosion pressures component suppliers. Ultra-mini proximity modules like Vishay's 0.5 mm-thick device cater to bezel-less phone designs, while global-shutter industrial cameras eliminate motion blur in robotic pick-and-place. Multi-spectral imagers within the "Others" bucket are gaining double-digit growth, supporting precision agriculture and food-safety fluorescence assays.
Cutting-edge photodetectors such as single-photon avalanche diodes (SPADs) and avalanche photodiodes (APDs) sell at premium prices even though they ship in lower volumes than standard photodiodes. SPAD arrays deliver picosecond-level time-of-flight data that LiDAR systems rely on for accurate distance readings in self-driving cars. On the emitter side, design teams are moving from LEDs to VCSELs and edge-emitting lasers to gain higher optical power and tighter spectral control; VCSELs also couple easily into fiber while meeting consumer eye-safety rules.
Optics and filters contribute the most value per gram because their precision coatings and tight tolerances are hard for new entrants to match. Meta-optics is shaking up lens design by replacing multi-element stacks with single, patterned layers that keep performance but trim size and weight. Processing electronics are following the same path: more functions now sit on the sensor die, so edge AI can run locally, cutting latency and easing bandwidth demands.
Optical Sensors Market is Segmented by Sensor Type (Image Sensor, Fiber-Optic Sensor, and More), Sensing Technology (Extrinsic Optical Sensor and More), Component (Photodetectors, Light Sources, and More), Wavelength (Ultraviolet, Visible, and More), Output End-User Application (Consumer Electronics, Industrial Automation & Robotics and More), and Geography. The Market Forecasts are Provided in Terms of Value (USD).
Geography Analysis
Asia-Pacific accounted for 33% of 2024 revenue, reflecting its tight coupling of component fabs, module assembly, and consumer electronics brands. Contract manufacturers in China and Vietnam now produce proximity-sensor die at sub-USD 0.09 ASP, reinforcing the region's cost leadership. Japan's precision optics ecosystem supports automotive LiDAR modules meeting AEC-Q102 grade, while South Korea's foundries push the envelope on stacked-image-sensor yields.
Europe's outlook centers on regulatory-driven applications. German Tier-1 suppliers are booking long-term contracts for NIR imaging arrays that comply with Euro NCAP vision-system mandates. Fiber-optic gas-leak monitoring around North Sea platforms is expanding as EU methane-emissions rules tighten. GDPR compliance is steering OEMs toward on-device biometric analysis, supporting intrinsic sensor adoption.
North America continues to test emerging concepts ahead of other regions. Venture funding into photonic start-ups exceeded USD 700 million in 2024-2025, with a focus on edge-AI optical links. Environmental agencies deploy distributed fiber networks for methane quantification, often financed through green-bond issuances. Meanwhile, Saudi Arabia and the UAE are installing hyperspectral camera arrays across smart-city projects, driving the Middle East's 13.6% CAGR outlook.
- ams-OSRAM AG
- Sony Group Corporation
- Hamamatsu Photonics K.K.
- ON Semiconductor Corp.
- ROHM Co., Ltd.
- SICK AG
- Keyence Corporation
- Teledyne Technologies Inc.
- STMicroelectronics N.V.
- Vishay Intertechnology Inc.
- Honeywell International Inc.
- IFM Electronic GmbH
- Pepperl + Fuchs SE
- Rockwell Automation Inc.
- Samsung Electronics Co. Ltd.
- Cognex Corporation
- FLIR Systems (Teledyne FLIR)
- Omnivision Technologies Inc.
- Lumentum Holdings Inc.
- Excelitas Technologies Corp.
- Thorlabs, Inc.
Additional Benefits:
- The market estimate (ME) sheet in Excel format
- 3 months of analyst support
TABLE OF CONTENTS
1 INTRODUCTION
- 1.1 Study Assumptions and Market Definition
- 1.2 Scope of the Study
2 RESEARCH METHODOLOGY
3 EXECUTIVE SUMMARY
4 MARKET LANDSCAPE
- 4.1 Market Overview
- 4.2 Market Drivers
- 4.2.1 Miniaturization Demand for Wearable Optics in APAC Consumer Electronics
- 4.2.2 Industrial IoT Adoption Fueling Fiber-optic Sensors in Harsh Environments
- 4.2.3 Automotive ADAS and LiDAR Integration Accelerating NIR Image Sensors in Europe
- 4.2.4 Rapid 5G & Edge-Data-Center Roll-out Requiring High-Speed Optical Sensing
- 4.2.5 Stricter Environmental-Monitoring Regulations Driving Distributed Fiber Sensing in North America
- 4.2.6 Advances in Silicon Photonics Lowering BOM Cost for Integrated Optical Sensors
- 4.3 Market Restraints
- 4.3.1 Supply-chain Constraints for High-purity Silica Preforms
- 4.3.2 Price Sensitivity in Low-end Smartphones Limiting Advanced Proximity Sensors
- 4.3.3 Calibration Complexity of Multi-spectral Sensors Deterring SME Uptake
- 4.3.4 Data-Privacy Concerns Around Biometric Optical Sensors in EU
- 4.4 Value / Supply-Chain Analysis
- 4.5 Regulatory and Technological Outlook
- 4.6 Porter's Five Forces Analysis
- 4.6.1 Bargaining Power of Suppliers
- 4.6.2 Bargaining Power of Buyers
- 4.6.3 Threat of New Entrants
- 4.6.4 Threat of Substitutes
- 4.6.5 Intensity of Competitive Rivalry
- 4.7 Pricing Analysis
- 4.8 Investment and Funding Trends
5 MARKET SIZE AND GROWTH FORECASTS (VALUE)
- 5.1 By Sensor Type
- 5.1.1 Image Sensor
- 5.1.2 Fiber-optic Sensor
- 5.1.3 Photoelectric Sensor
- 5.1.4 Ambient Light & Proximity Sensor
- 5.1.5 Others (Position, Touch, Multi-spectral)
- 5.2 By Sensing Technology
- 5.2.1 Extrinsic Optical Sensor
- 5.2.2 Intrinsic Optical Sensor
- 5.3 By Component
- 5.3.1 Photodetectors (Photodiodes, APDs, SPADs)
- 5.3.2 Light Sources (LED, VCSEL, Laser)
- 5.3.3 Optics and Filters
- 5.3.4 ICs and Processing Electronics
- 5.4 By Wavelength
- 5.4.1 Ultraviolet (100-400 nm)
- 5.4.2 Visible (400-700 nm)
- 5.4.3 Near-Infrared (700-1400 nm)
- 5.4.4 Short-Wave IR / Mid-IR (>1400 nm)
- 5.5 By Output
- 5.5.1 Analog
- 5.5.2 Digital
- 5.6 By End-user Application
- 5.6.1 Consumer Electronics
- 5.6.2 Industrial Automation and Robotics
- 5.6.3 Automotive and Transportation
- 5.6.4 Healthcare and Medical Devices
- 5.6.5 Biometrics and Security
- 5.6.6 Aerospace and Defense
- 5.6.7 Energy and Environmental Monitoring
- 5.7 By Geography
- 5.7.1 North America
- 5.7.1.1 United States
- 5.7.1.2 Canada
- 5.7.1.3 Mexico
- 5.7.2 Europe
- 5.7.2.1 United Kingdom
- 5.7.2.2 Germany
- 5.7.2.3 France
- 5.7.2.4 Italy
- 5.7.2.5 Rest of Europe
- 5.7.3 Asia-Pacific
- 5.7.3.1 China
- 5.7.3.2 Japan
- 5.7.3.3 India
- 5.7.3.4 South Korea
- 5.7.3.5 Rest of Asia-Pacific
- 5.7.4 Middle East
- 5.7.4.1 Israel
- 5.7.4.2 Saudi Arabia
- 5.7.4.3 United Arab Emirates
- 5.7.4.4 Turkey
- 5.7.4.5 Rest of Middle East
- 5.7.5 Africa
- 5.7.5.1 South Africa
- 5.7.5.2 Egypt
- 5.7.5.3 Rest of Africa
- 5.7.6 South America
- 5.7.6.1 Brazil
- 5.7.6.2 Argentina
- 5.7.6.3 Rest of South America
- 5.7.1 North America
6 COMPETITIVE LANDSCAPE
- 6.1 Market Concentration
- 6.2 Strategic Moves (M&A, JV, Product Launch, Funding)
- 6.3 Market Share Analysis
- 6.4 Company Profiles {(includes Global level Overview, Market level overview, Core Segments, Financials as available, Strategic Information, Market Rank/Share for key companies, Products & Services, and Recent Developments)}
- 6.4.1 ams-OSRAM AG
- 6.4.2 Sony Group Corporation
- 6.4.3 Hamamatsu Photonics K.K.
- 6.4.4 ON Semiconductor Corp.
- 6.4.5 ROHM Co., Ltd.
- 6.4.6 SICK AG
- 6.4.7 Keyence Corporation
- 6.4.8 Teledyne Technologies Inc.
- 6.4.9 STMicroelectronics N.V.
- 6.4.10 Vishay Intertechnology Inc.
- 6.4.11 Honeywell International Inc.
- 6.4.12 IFM Electronic GmbH
- 6.4.13 Pepperl + Fuchs SE
- 6.4.14 Rockwell Automation Inc.
- 6.4.15 Samsung Electronics Co. Ltd.
- 6.4.16 Cognex Corporation
- 6.4.17 FLIR Systems (Teledyne FLIR)
- 6.4.18 Omnivision Technologies Inc.
- 6.4.19 Lumentum Holdings Inc.
- 6.4.20 Excelitas Technologies Corp.
- 6.4.21 Thorlabs, Inc.
7 MARKET OPPORTUNITIES AND FUTURE OUTLOOK
- 7.1 White-space and Unmet-need Assessment
 2026年全球光学感测器市场报告
 3D彩色共聚焦感测器市场:按产品、应用和最终用户划分-2026-2032年全球预测奈米级共聚焦色差感测器市场:按产品类型、销售管道、终端用户产业和应用划分-2026-2032年全球预测线型色散共焦感测器市场:按产品类型、雷射波长、测量范围、应用和最终用户产业划分-2026-2032年全球预测
 光学感测器市场机会、成长要素、产业趋势分析及2026年至2035年预测
 光学感测器市场分析及预测(至2035年):按类型、产品类型、技术、组件、应用、材料类型、装置及最终用户划分
 全球光学感测器市场:按类型、感测器类别、应用和地区划分-市场规模、产业趋势、机会分析和未来预测(2026-2035 年)
 光学感测市场-全球产业规模、份额、趋势、机会及预测(按类型、方法、操作、技术、最终用途、地区和竞争格局划分,2021-2031年)
 全球光学感测器市场:市场规模、占有率、成长率、产业分析、依类型、应用和地区划分的分析、未来预测(2026-2034)按产品类型、解析度、技术、安装位置、价格范围、连接方式、性别、最终用户和分销管道分類的角落摄影机市场—2026-2032年全球预测