


 |
市场调查报告书
商品编码
1851455
合成钻石:市场份额分析、行业趋势、统计数据和成长预测(2025-2030 年)Synthetic Diamond - Market Share Analysis, Industry Trends & Statistics, Growth Forecasts (2025 - 2030) |
||||||
※ 本网页内容可能与最新版本有所差异。详细情况请与我们联繫。
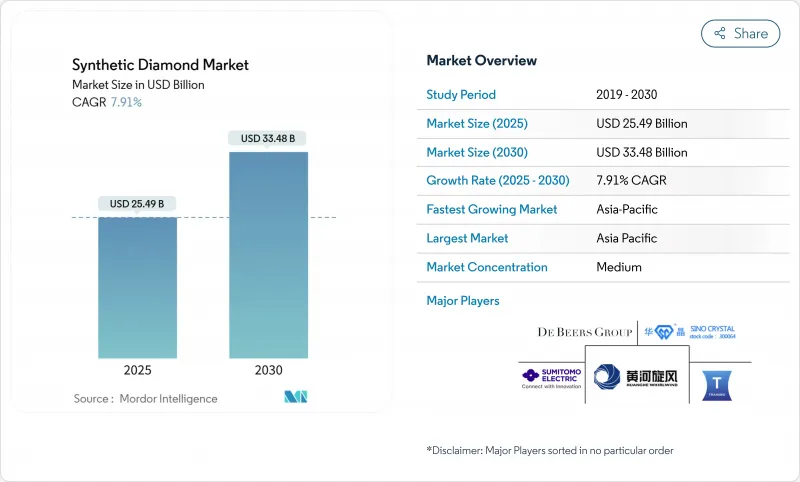
2025 年合成钻石市场规模估计为 254.9 亿美元,预计到 2030 年将达到 334.8 亿美元,在预测期(2025-2030 年)内复合年增长率为 7.91%。
通讯、电动车、航太和精密製造等产业的需求不断增长,推动了收入的持续成长;同时,持续的永续性要求正促使消费者放弃开采的天然宝石,转而选择人造替代品。亚太地区已占据大部分钻石晶片和超磨粒磨料的供应市场,这得益于各国政府的慷慨激励政策和电子产品出口的激增。随着技术驱动型参与企业扩大其化学气相沉积(CVD)产能,能够生产出装置级纯度的钻石,竞争日益激烈,对现有的高温高压(HPHT)模式构成了直接挑战。同时,波湾合作理事会(GCC)的奢侈品牌正利用色彩缤纷的实验室培育宝石来满足具有环保意识的消费者的需求,并将产品线拓展到传统婚礼珠宝之外。监管的不确定性和认证标准的不统一是主要的阻力,尤其是在零售价格调整削弱了终端用户对转售价值的认知的情况下。然而,以性能主导的高科技领域仍然能够确保净利率。
全球合成钻石市场趋势与洞察
亚洲地区 CVD 钻石在 5G/6G 射频滤波器的应用日益广泛
CVD单晶硅片散热效率为22W/cm*K,可製造更小巧、更可靠的高频滤波器,从而支援高密度5G和未来的6G网路。垂直整合的OEM厂商,尤其是在中国、韩国和台湾地区,正在将钻石晶粒黏接层嵌入大规模多输入多输出(mMIMO)天线。当地设备供应商报告称,由于功耗降低和基地台寿命延长,营运商的总体拥有成本得到了显着降低。
电动车电池超级工厂推动工业钻石需求激增
多晶钻石涂层精密研磨对于切割富硅阳极、雷射转移隔膜以及对铝製外壳进行表面处理至关重要。美国和欧洲的超大型电池工厂目前在其超过70%的高速加工工位中使用钻石工具,这提高了每个汽车平臺的单位消费量。钻石铸造晶圆逆变器的尺寸仅为传统设计的六分之一,但性能却更优,显示其热和电特性能够提升动力传动系统的效率。
监管和认证方面的挑战
印度中央消费者保护局要求零售商在发货单和行销资料上註明钻石的产地和培育方法。在美国,珠宝饰品监管委员会也推出了类似的指导方针,加强了审核要求,鼓励企业投资光谱检测和自动化筛检设备。各地法规的差异使跨境贸易变得复杂,也使经销商面临法律风险。
细分市场分析
由于毛坯钻石在建筑、石油天然气钻探和精密切割工具等领域有着广泛的应用,这些领域都充分利用了毛坯钻石无与伦比的硬度和导热性,因此,2024年毛坯钻石占据了合成钻石市场份额的66%。美国地质调查局记录显示,美国国内毛坯钻石产量为1.6亿克拉,价值5,300万美元,较上年增加5%。
儘管抛光宝石的吨位较小,但却是成长最快的品类,预计年复合成长率将达到9.84%。消费者的广泛接受、设计灵活性的提升以及等离子后处理的进步(导致市场饱和度增加),都推动了中阶珠宝饰品连锁店销售的成长。根据美国宝石学院(GIA)的数据显示,化学气相沉积(CVD)样品提交量已超过高温高压(HPHT)样品提交量,其中彩色宝石和三克拉以上宝石的销量同比增长显着。即使批发价格在预测期内保持稳定,抛光宝石预计也将在全通路零售通路中占据更大的货架空间。
区域分析
亚太地区预计到2024年将占全球销售额的56%,并将继续保持最快的成长速度,到2030年复合年增长率将达到8.35%。河南、山东和古吉拉突邦的生产群集拥有从晶种合成到成品珠宝饰品的垂直整合营运模式。中国在实验室反应器领域的优势使其具备成本优势,而印度取消5%的钻石晶种进口关税也吸引了海外合资企业。
北美地区在高性能应用领域仍然至关重要,尤其是在量子感测和宽能带隙功率电子领域。 Adamas One公司位于南卡罗来纳州的工厂目前拥有12个反应堆,每月可生产3000克拉原石,该公司正着力推进受知识产权保护的生长通讯协定,并赢得了航太和医疗行业的合约。
欧洲保持着稳定而又创新型的地位。德国工具製造商和法国光电新兴企业正在将钻石嵌件应用于汽车轻量化领域。英国的学术生态系统,特别是国家量子计算中心,正在推进氮空位(NV)缺陷工程技术在安全通讯的应用。在欧洲以外,中东地区将杜拜视为贸易和生产中心。
其他好处
- Excel格式的市场预测(ME)表
- 3个月的分析师支持
目录
第一章 引言
- 研究假设和市场定义
- 调查范围
第二章调查方法
第三章执行摘要
第四章 市场情势
- 市场概览
- 市场驱动因素
- 亚洲地区采用CVD钻石製造5G/6G射频滤波器的比例正在增加。
- 电动车电池超级工厂推动工业钻石需求激增
- 对超磨粒的需求不断增长
- 超磨粒在航太复合材料自动化数控加工的应用。
- 海湾合作委员会的奢侈品牌正将其永续性转向实验室培育的彩色宝石。
- 市场限制
- 监管和认证方面的挑战
- 复杂的製造过程
- 消费者对LGD价格下跌与天然钻石价格下跌的对比感到困惑
- 价值链分析
- 波特五力模型
- 供应商的议价能力
- 买方的议价能力
- 新进入者的威胁
- 替代品的威胁
- 竞争对手之间的竞争
第五章 市场规模和成长预测(价值和数量)
- 依产品类型
- 抛光錶面
- 珠宝
- 电子学
- 卫生保健
- 其他抛光类型
- 粗糙的
- 建造
- 矿业
- 石油和天然气
- 其他粗略类型
- 抛光錶面
- 透过製造工艺
- 高压高温(HPHT)
- 化学沉淀(CVD)
- 按地区
- 亚太地区
- 中国
- 印度
- 日本
- 韩国
- ASEAN
- 亚太其他地区
- 北美洲
- 美国
- 加拿大
- 墨西哥
- 欧洲
- 德国
- 英国
- 法国
- 义大利
- 西班牙
- 北欧国家
- 其他欧洲地区
- 南美洲
- 巴西
- 阿根廷
- 其他南美洲
- 中东和非洲
- 沙乌地阿拉伯
- 南非
- 其他中东和非洲地区
- 亚太地区
第六章 竞争情势
- 市场集中度
- 策略趋势
- 市占率分析
- 公司简介
- ADAMAS ONE
- Applied Diamond Inc.
- Coherent Corp.
- De Beers Group(Element Six)
- Diamond Foundry
- Henan Huanghe Whirlwind CO.,Ltd.
- Heyaru Group
- ILJIN DIAMOND CO., LTD.
- John Crane(Advanced Diamond Technologies, Inc.)
- NEW DIAMOND TECHNOLOGY LLC
- PURE LAB DIAMONDS
- Sandvik AB
- Sumitomo Electric Industries, Ltd.
- Swarovski AG
- Tecdia, Inc.
- Washington Diamond
- Zhengzhou Sino-Crystal Diamond Co.,Ltd.
- Zhuhai Zhong Na Diamond Co.,Ltd Inc.
第七章 市场机会与未来展望
The Synthetic Diamond Market size is estimated at USD 25.49 billion in 2025, and is expected to reach USD 33.48 billion by 2030, at a CAGR of 7.91% during the forecast period (2025-2030).
Escalating demand from telecommunications, electric vehicles, aerospace, and high-precision manufacturing is accelerating revenue streams, while persistent sustainability mandates are steering customers away from mined stones toward engineered alternatives. Asia Pacific, already supplying most diamond wafers and super-abrasive tools, benefits from generous state incentives and surging electronics exports. Competition is intensifying because technology-focused entrants are scaling Chemical Vapor Deposition (CVD) capacity that can achieve device-grade purity, posing a direct challenge to the incumbent High Pressure High Temperature (HPHT) model. Meanwhile, luxury brands in the Gulf Cooperation Council are leveraging fancy-color lab-grown stones to satisfy environmentally conscious consumers, widening the addressable base beyond traditional bridal jewelry. Regulatory uncertainty and uneven certification standards remain the chief headwinds, especially as retail price corrections undermine perceived resale value among end users, but the performance-driven high-tech arena continues to shield margins.
Global Synthetic Diamond Market Trends and Insights
Rising Adoption of CVD Diamonds for 5G/6G RF Filters in Asia
CVD single-crystal wafers dissipate heat at 22 W/cm*K, enabling smaller and more reliable radio-frequency filters that underpin dense 5G and future 6G networks. Large-area substrate work sponsored by DARPA is migrating into commercial foundries, particularly in China, South Korea, and Taiwan, where vertically integrated OEMs are embedding diamond die-attach layers inside massive multiple-input multiple-output (mMIMO) antennas. Local equipment vendors report lower power consumption and longer base-station lifetimes, giving operators measurable total-cost-of-ownership gains.
Industrial Diamond Demand Surge from EV Battery Gigafactories
Precision grinding wheels with polycrystalline diamond coatings are indispensable for cutting silicon-rich anodes, laser-scribing separator films, and surfacing aluminum casings. Giga-scale battery plants in the United States and Europe now specify diamond tooling in over 70% of high-speed machining stations, elevating unit consumption per vehicle platform. Diamond Foundry's wafer-based inverter, six times smaller than the incumbent design yet more powerful, underscores how thermal and electrical properties improve drivetrain efficiency.
Regulatory and Certification Challenges
The Central Consumer Protection Authority in India requires retailers to specify production origin and growth method on invoices and marketing collateral, adding compliance costs and compelling supply-chain transparency. In the United States, Jewelers Vigilance Committee guidelines similarly tighten audit obligations, prompting firms to invest in spectroscopy and automated screening equipment. Divergent rules by region complicate cross-border trading and create legal exposure for distributors.
Other drivers and restraints analyzed in the detailed report include:
- Growing Demand for Super-Abrasives
- Luxury Brands' Sustainability Pivot to Lab-Grown Fancy-Color Stones in the GCC
- Consumer Confusion Over Lab-Grown Diamond Price Depreciation
For complete list of drivers and restraints, kindly check the Table Of Contents.
Segment Analysis
Rough stones captured 66% of the synthetic diamond market share in 2024, owing to heavy uptake in construction, oil-and-gas drilling, and precision cutting tools, all of which leverage unmatched hardness and thermal conductivity. The U.S. Geological Survey recorded domestic output of 160 million carats valued at USD 53 million, a 5% rise on the prior year.
Polished stones, though smaller in tonnage, are the fastest-expanding category at a projected 9.84% CAGR. Wider consumer acceptance, heightened design flexibility, and advances in plasma post-processing that enhance color saturation are boosting volumes across mid-tier jewelry chains. The Gemological Institute of America notes that CVD submissions now exceed HPHT samples, with fancy colors and 3-carat-plus stones up sharply year over year. Over the forecast horizon, polished gems are expected to secure incremental shelf space in omnichannel retail, even as wholesale prices stabilize.
The Synthetic Diamond Market Report Segments the Industry by Product Type (Polished and Rough), Manufacturing Process (High Pressure, High Temperature (HPHT) and Chemical Vapor Deposition (CVD)), and Geography (Asia-Pacific, North America, Europe, South America, and Middle-East and Africa). The Market Forecasts are Provided in Terms of Value (USD).
Geography Analysis
Asia Pacific anchored 56% of global revenue in 2024 and continues to post the fastest regional growth at an 8.35% CAGR through 2030. Production clusters in Henan, Shandong, and Gujarat host vertically integrated operations that span seed synthesis to finished jewelry. China's dominance in lab reactors provides cost advantages, while India's abolition of a 5% import duty on diamond seeds attracts overseas joint ventures.
North America remains pivotal for high-performance applications, particularly in quantum sensing and wide-band-gap power electronics. Adamas One Corp's South Carolina facility, which currently runs 12 reactors producing 3,000 rough carats monthly, emphasizes IP-protected growth protocols to secure aerospace and medical contracts.
Europe maintains a stable but innovation-oriented stance. German toolmakers and French photonics startups incorporate diamond inserts to meet automotive lightweighting mandates. The United Kingdom's academic ecosystem, notably the National Quantum Computing Centre, advances Nitrogen-Vacancy (NV) defect engineering for secure communications. Outside Europe, the Middle East positions Dubai as a trading and production hub.
- ADAMAS ONE
- Applied Diamond Inc.
- Coherent Corp.
- De Beers Group (Element Six)
- Diamond Foundry
- Henan Huanghe Whirlwind CO.,Ltd.
- Heyaru Group
- ILJIN DIAMOND CO., LTD.
- John Crane (Advanced Diamond Technologies, Inc.)
- NEW DIAMOND TECHNOLOGY LLC
- PURE LAB DIAMONDS
- Sandvik AB
- Sumitomo Electric Industries, Ltd.
- Swarovski AG
- Tecdia, Inc.
- Washington Diamond
- Zhengzhou Sino-Crystal Diamond Co.,Ltd.
- Zhuhai Zhong Na Diamond Co.,Ltd Inc.
Additional Benefits:
- The market estimate (ME) sheet in Excel format
- 3 months of analyst support
TABLE OF CONTENTS
1 Introduction
- 1.1 Study Assumptions and Market Definition
- 1.2 Scope of the Study
2 Research Methodology
3 Executive Summary
4 Market Landscape
- 4.1 Market Overview
- 4.2 Market Drivers
- 4.2.1 Rising Adoption of CVD Diamonds for 5G/6G RF Filters Asia
- 4.2.2 Industrial Diamond Demand Surge from EV Battery Gigafactories
- 4.2.3 Growing Demand for Super Abrasives
- 4.2.4 Super-abrasive Usage in Automated CNC Machining for Aerospace Composites
- 4.2.5 Luxury Brands' Sustainability Pivot to Lab-Grown Fancy-Color Stones in the GCC
- 4.3 Market Restraints
- 4.3.1 Regulatory and Certification Challenges
- 4.3.2 Complex Manufacturing Process
- 4.3.3 Consumer Confusion Over LGD Price Depreciation vs. Natural Diamonds
- 4.4 Value Chain Analysis
- 4.5 Porter's Five Forces
- 4.5.1 Bargaining Power of Suppliers
- 4.5.2 Bargaining Power of Buyers
- 4.5.3 Threat of New Entrants
- 4.5.4 Threat of Substitutes
- 4.5.5 Competitive Rivalry
5 Market Size and Growth Forecasts (Value and Volume)
- 5.1 By Product Type
- 5.1.1 Polished
- 5.1.1.1 Jewelry
- 5.1.1.2 Electronics
- 5.1.1.3 Healthcare
- 5.1.1.4 Other Polished Types
- 5.1.2 Rough
- 5.1.2.1 Construction
- 5.1.2.2 Mining
- 5.1.2.3 Oil and Gas
- 5.1.2.4 Other Rough Types
- 5.1.1 Polished
- 5.2 By Manufacturing Process
- 5.2.1 High Pressure High Temperature (HPHT)
- 5.2.2 Chemical Vapor Deposition (CVD)
- 5.3 By Geography
- 5.3.1 Asia-Pacific
- 5.3.1.1 China
- 5.3.1.2 India
- 5.3.1.3 Japan
- 5.3.1.4 South Korea
- 5.3.1.5 ASEAN
- 5.3.1.6 Rest of Asia-Pacific
- 5.3.2 North America
- 5.3.2.1 United States
- 5.3.2.2 Canada
- 5.3.2.3 Mexico
- 5.3.3 Europe
- 5.3.3.1 Germany
- 5.3.3.2 United Kingdom
- 5.3.3.3 France
- 5.3.3.4 Italy
- 5.3.3.5 Spain
- 5.3.3.6 Nordics
- 5.3.3.7 Rest of Europe
- 5.3.4 South America
- 5.3.4.1 Brazil
- 5.3.4.2 Argentina
- 5.3.4.3 Rest of South America
- 5.3.5 Middle-East and Africa
- 5.3.5.1 Saudi Arabia
- 5.3.5.2 South Africa
- 5.3.5.3 Rest of Middle-East and Africa
- 5.3.1 Asia-Pacific
6 Competitive Landscape
- 6.1 Market Concentration
- 6.2 Strategic Moves
- 6.3 Market Share Analysis
- 6.4 Company Profiles (includes Global level Overview, Market level overview, Core Segments, Financials as available, Strategic Information, Market Rank/Share for key companies, Products and Services, and Recent Developments)
- 6.4.1 ADAMAS ONE
- 6.4.2 Applied Diamond Inc.
- 6.4.3 Coherent Corp.
- 6.4.4 De Beers Group (Element Six)
- 6.4.5 Diamond Foundry
- 6.4.6 Henan Huanghe Whirlwind CO.,Ltd.
- 6.4.7 Heyaru Group
- 6.4.8 ILJIN DIAMOND CO., LTD.
- 6.4.9 John Crane (Advanced Diamond Technologies, Inc.)
- 6.4.10 NEW DIAMOND TECHNOLOGY LLC
- 6.4.11 PURE LAB DIAMONDS
- 6.4.12 Sandvik AB
- 6.4.13 Sumitomo Electric Industries, Ltd.
- 6.4.14 Swarovski AG
- 6.4.15 Tecdia, Inc.
- 6.4.16 Washington Diamond
- 6.4.17 Zhengzhou Sino-Crystal Diamond Co.,Ltd.
- 6.4.18 Zhuhai Zhong Na Diamond Co.,Ltd Inc.
7 Market Opportunities and Future Outlook
- 7.1 White-space and Unmet-Need Assessment
- 7.2 Applications in Orthopedic Medical Devices
 实验室培育钻石市场预测至2032年:按产品类型、生产方法、特性、尺寸、应用、通路和地区分類的全球分析
 化学气相沉积法(CVD)实验室培育钻石市场:依应用、克拉大小、产品类型及销售管道划分-2025-2032年全球预测
 2025年全球实验室培育钻石市场报告实验室培育钻石市场(依生产方法、产品类型、尺寸、特性、切割类型、应用和分销管道)-2025-2030 年全球预测
 合成钻石市场规模、份额及成长分析(按类型、产品、製程和地区)-产业预测(2025-2032)
 全球化学气相沉积 (CVD) 实验室培育钻石市场2025年CVD实验室合成钻石全球市场报告2025年全球合成钻石市场报告
 实验室培育钻石市场规模、份额及成长分析(按产品、生产方式、应用、最终用户及地区)-产业预测(2025-2032)
 人造钻石市场(按类型、製造工艺和地区划分)