


 |
市场调查报告书
商品编码
1851484
证券分析:市场占有率分析、产业趋势、统计数据和成长预测(2025-2030 年)Security Analytics - Market Share Analysis, Industry Trends & Statistics, Growth Forecasts (2025 - 2030) |
||||||
※ 本网页内容可能与最新版本有所差异。详细情况请与我们联繫。
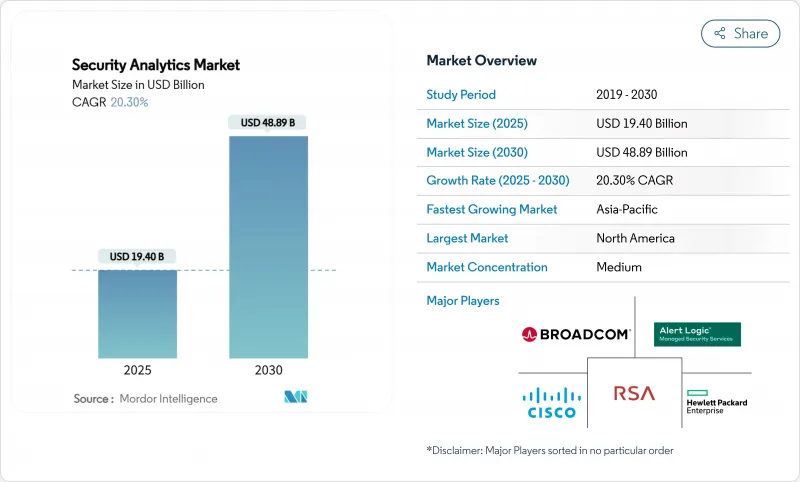
安全分析市场预计将从 2025 年的 194 亿美元成长到 2030 年的 488.9 亿美元,复合年增长率为 20.30%。
这种快速成长反映了企业致力于利用人工智慧主导的平台来抵御高级网路攻击,这些平台能够即时分析数十亿个事件。物联网终端的爆炸性成长、云端优先转型计划以及日益严格的法令遵循(需要自动化分析)是推动这一成长的主要因素。领先的供应商正在将安全资讯和事件管理 (SIEM)、安全营运自动化与回应 (SOAR)、用户端行为分析 (UEBA) 和威胁情报整合到一个统一的套件中,以简化操作并解决工具分散的问题。 CrowdStrike、Palo Alto Networks、微软、IBM 和思科在分析的广度、速度和原生自动化方面展开激烈竞争,而专注于特定领域的专家则凭藉差异化的人工智慧模型和云端原生架构保持着市场地位。
全球安全分析市场趋势与洞察
网路威胁日益复杂
国家级攻击者如今正部署自动化工具链来规避基于特征码的防御,这促使各组织转向行为分析来侦测横向移动和零时差漏洞。美国联邦调查局指出,针对通讯业者的、由国家主导的监视和资料窃取攻击激增。因此,安全团队倾向于选择具备机器学习模型的平台,这些模型能够自学习网路基准,并在毫秒内标记异常路径。供应商正在将用户行为分析 (UEBA) 和威胁情报直接整合到其安全资讯和事件管理 (SIEM) 引擎中,以缩短攻击者潜伏时间并提高平均侦测时间。这场竞争的赢家是那些无需手动特征工程即可持续重新训练模型的供应商。
物联网和自带设备办公终端的爆炸性成长
工业感测器、医疗设备和远端办公笔记型电脑正在扩大攻击面,并突破边界控制。一项发表在《科学报告》上的研究发现,超过 60% 的组织面临与未託管设备相关的内部威胁。现代分析技术从 OT 闸道、行动 EDR 代理程式和边缘节点收集遥测数据,并应用无监督学习来对设备行为进行分类。边缘处理可降低延迟,即使在连接性下降的情况下也能确保持续运作。供应商现在将轻量级代理嵌入韧体,并将其与云端图分析相结合,以关联数百万个终端节点的异常情况。
数据整合和工具激增带来的挑战
大多数公司都在使用 25 到 50 种安全工具,每种工具输出的日誌模式各不相同,这迫使他们使用自订解析器,并导致关联速度缓慢。 CSO Online 报告称,整合开销正在耗尽分析师的资源,并使他们无法识别跨向量攻击。虽然买家正在用整合分析套件取代零散的解决方案,但对供应商锁定的担忧正在减缓替换计划的进展。随着云端迁移增加复杂性,平台必须将本机系统日誌、云端 API元资料和 SaaS审核追踪规范化到单一资料湖中,否则将面临资料孤岛持续存在的风险。
细分市场分析
到2024年,网路安全分析将占总收入的38%,这凸显了深层封包检测和NetFlow分析在安全分析市场中的持久重要性。随着企业将工作负载迁移到外部部署并寻求跨云端可见性,预计到2030年,云端安全分析将以17.6%的复合年增长率成长。应用分析、网路分析和终端分析正在融合,以扩展侦测覆盖范围,而内部威胁模组则利用UEBA来分析使用者行为。
这些细分领域的整合迫使供应商采用基于微服务的收集器,将各种遥测资料整合到统一的资料架构中。与传统规则引擎相比,提供人工智慧主导的策略建议和自动修復功能的平台可以将误报率降低 59%。这使得整合套件对希望减少警报噪音,同时透过单一主机保护网路、应用和识别层的安全主管极具吸引力。
到2024年,本地部署方案将占总收入的54.5%,这反映出企业在防火墙内保护敏感日誌和实施主权资料规则方面的投入。然而,随着企业采用SASE和零信任架构,预计2030年,云端部署的安全分析市场规模将以21%的复合年增长率成长。混合模式正在成为一种可行的过渡方案,它既允许在安全的云端进行突发分析,又能将关键日誌保留在本地。
美国国防部的零信任架构 2.0 计画于 2027 年实现全面覆盖,并利用商业云端分析技术实现可扩展性。基于使用量的授权模式和託管式资料摄取管道消除了资本支出障碍,甚至吸引了受监管行业将运算密集型关联任务卸载到云端。供应商还按区域部署云端“单元”,以满足资料驻留需求,同时又不牺牲分析深度。
区域分析
北美地区预计到2024年将占总收入的42%,并将受益于庞大的网路安全预算和人工智慧增强型安全资讯与事件管理(SIEM)系统的早期应用。联邦政府的强制性规定,例如要求持续诊断和资讯揭露的第14028号行政命令,将进一步推动相关支出。
亚太地区预计将以13.8%的复合年增长率成长,主要受云端运算转型、网路保险普及率飙升以及政府支持的数位化项目推动。根据 Gallagher Re 的数据,亚太地区的网路保险保费正以每年近50%的速度成长。澳洲、新加坡、日本和韩国在支出方面处于领先地位,而印度和中国则新增保单数量最多,这得益于本土科技巨头不断拓展其全球业务。
到2025年,拉丁美洲的IT预算将成长64%,优先发展分析技术以应对全部区域平均每秒1,600次的网路攻击。中东和北非地区的IT预算到2025年将超过30亿美元,这主要得益于石油天然气和政府部门对人工智慧的广泛应用。
其他好处
- Excel格式的市场预测(ME)表
- 3个月的分析师支持
目录
第一章 引言
- 研究假设和市场定义
- 调查范围
第二章调查方法
第三章执行摘要
第四章 市场情势
- 市场概览
- 市场驱动因素
- 日益复杂的网路威胁情势
- 物联网和自带设备办公终端的爆炸性成长
- 云端优先数位转型计划
- 全球扩大网路安全合规性
- 人工智慧驱动的多态恶意软体的出现
- 未经管理的机器间身分的激增
- 市场限制
- 数据整合和工具氾滥带来的挑战
- 全球SOC分析师短缺
- 高度警觉疲劳和假阳性率
- 资料主权规则限制了分析活动。
- 价值/供应链分析
- 监管环境
- 技术展望
- 五力分析
- 新进入者的威胁
- 买方/消费者的议价能力
- 供应商的议价能力
- 替代品的威胁
- 竞争对手之间的竞争
第五章 市场规模与成长预测
- 透过使用
- 网路安全分析
- 应用安全分析
- 网路安全分析
- 端点安全分析
- 云端安全分析
- 内部威胁分析
- 透过部署模式
- 本地部署
- 云
- 杂交种
- 按组织规模
- 大公司
- 小型企业
- 按最终用户行业划分
- 银行和金融服务
- 卫生保健
- 国防/安全
- 电讯和资讯技术
- 零售与电子商务
- 製造业
- 政府机构
- 按地区
- 北美洲
- 美国
- 加拿大
- 墨西哥
- 欧洲
- 英国
- 德国
- 法国
- 义大利
- 西班牙
- 俄罗斯
- 其他欧洲地区
- 亚太地区
- 中国
- 印度
- 日本
- 韩国
- 澳洲
- 亚太其他地区
- 南美洲
- 巴西
- 阿根廷
- 其他南美洲
- 中东和非洲
- 中东
- 沙乌地阿拉伯
- 阿拉伯聯合大公国
- 土耳其
- 其他中东地区
- 非洲
- 南非
- 奈及利亚
- 其他非洲地区
- 北美洲
第六章 竞争情势
- 市场集中度
- 策略趋势
- 市占率分析
- 公司简介
- Alert Logic, Inc.
- Arbor Networks, Inc.(NETSCOUT Systems, Inc.)
- Broadcom Inc.(Symantec Enterprise Division)
- Cisco Systems, Inc.
- RSA Security LLC
- Hewlett Packard Enterprise Company
- International Business Machines Corporation
- LogRhythm, Inc.
- Mandiant, Inc.
- Splunk Inc.
- Fortinet, Inc.
- McAfee, LLC
- Micro Focus International plc
- Securonix, Inc.
- Exabeam, Inc.
- Devo Technology, Inc.
- Microsoft Corporation
- Palo Alto Networks, Inc.
- CrowdStrike Holdings, Inc.
- Elastic NV
第七章 市场机会与未来展望
The security analytics market is valued at USD 19.40 billion in 2025 and is forecast to touch USD 48.89 billion by 2030, advancing at a CAGR of 20.30%.
The surge reflects enterprises' drive to neutralize sophisticated cyber-attacks with AI-led platforms that analyze billions of events in real time. Growth stems from an explosion of IoT endpoints, cloud-first transformation projects, and tightening compliance regimes that require automated analytics. Demand is further amplified by platform consolidation: large vendors now bundle SIEM, SOAR, UEBA, and threat-intelligence into single suites to simplify operations and counter tool sprawl. CrowdStrike, Palo Alto Networks, Microsoft, IBM, and Cisco compete aggressively on analytics breadth, speed, and native automation while niche specialists maintain traction through differentiated AI models and cloud-native architectures.
Global Security Analytics Market Trends and Insights
Sophistication of cyber-threat landscape
Nation-state actors now deploy automated toolchains that evade signature-based defenses, pushing enterprises toward behavioral analytics that detect lateral movement and zero-day exploits. The FBI cited a spike in state-sponsored attacks on telecom carriers aimed at surveillance and data exfiltration. Security teams therefore favor platforms with machine-learning models that self-learn network baselines and flag anomalous paths in milliseconds. Vendors integrate UEBA and threat-intel feeds directly into SIEM engines, shrinking dwell time and improving mean time to detect. This arms race rewards suppliers able to retrain models continuously without manual feature engineering.
Explosive growth of IoT and BYOD endpoints
Industrial sensors, medical devices, and remote-work laptops have swollen the attack surface, leaving perimeter controls ineffective. Research in Scientific Reports found that more than 60% of organizations suffered insider threats tied to unmanaged devices. Modern analytics ingest telemetry from OT gateways, mobile EDR agents, and edge nodes, applying unsupervised learning to classify device behaviors. Edge processing cuts latency and keeps operations running when connectivity drops. Vendors now embed lightweight agents in firmware and combine them with cloud-side graph analytics to correlate anomalies across fleets of millions of endpoints.
Data-integration and tool-sprawl challenges
Most enterprises juggle 25-50 security tools that emit disjointed log schemas, forcing custom parsers and delaying correlation. CSO Online reports that integration overhead drains analyst capacity and obscures cross-vector attacks. Buyers are replacing point solutions with converged analytics suites, yet fear of vendor lock-in slows rip-and-replace projects. As cloud migration compounds complexity, platforms must normalize on-prem Syslog, cloud API metadata, and SaaS audit trails within a single data lake, or risk perpetuating silos.
Other drivers and restraints analyzed in the detailed report include:
- Cloud-first digital-transformation programs
- Expanding global cybersecurity-compliance regimes
- Global shortage of SOC analysts
For complete list of drivers and restraints, kindly check the Table Of Contents.
Segment Analysis
Network security analytics generated 38% of 2024 revenue, underscoring the enduring role of deep-packet inspection and NetFlow analysis in the security analytics market. Cloud security analytics is advancing at 17.6% CAGR to 2030 as enterprises shift workloads off-premises and seek cross-cloud visibility. Application, web, and endpoint analytics together broaden detection coverage, while insider-threat modules employ UEBA to profile user behavior.
The convergence of these sub-segments pushes vendors to embed microservices-based collectors that ingest diverse telemetry into unified data fabrics. Platforms offering AI-driven policy recommendations and automated remediation now achieve a 59% drop in false positives versus legacy rule engines. Integrated suites therefore appeal to security leaders aiming to slash alert noise while protecting network, application, and identity layers in one console.
On-premise implementations held 54.5% revenue in 2024, reflecting sunk investments and sovereign-data rules that keep sensitive logs inside firewalls. Yet the security analytics market size for cloud deployments is forecast to expand at a 21% CAGR through 2030 as firms adopt SASE and zero-trust mandates. Hybrid models are emerging as a pragmatic bridge-critical logs remain local while burst analysis occurs in secure clouds.
The U.S. Department of Defense's Zero Trust Architecture 2.0 targets full coverage by 2027, leaning on commercial cloud analytics for scalability. Consumption-based licensing and managed ingestion pipelines erase capital expenditure hurdles, enticing even regulated industries to offload compute-intensive correlation tasks. Vendors also deploy regional cloud "cells" to meet data-residency directives without sacrificing analytic depth.
The Security Analytics Market Report is Segmented by Application (Network Security Analytics, Application Security Analytics, and More), Deployment Mode (On-Premise, Cloud, Hybrid), Organization Size (Large Enterprises, Small and Medium Enterprises), End-User Industry (Banking and Financial Services, Healthcare, and More), and Geography. The Market Forecasts are Provided in Terms of Value (USD).
Geography Analysis
North America commanded 42% revenue in 2024, benefitting from sizable cyber-budgets and early uptake of AI-enhanced SIEM. Federal directives such as Executive Order 14028 force continuous diagnostics and disclosure, further fueling spend.
Asia-Pacific is projected to grow at 13.8% CAGR, propelled by cloud migrations, cyber-insurance penetration jumps, and government-backed digital programs. Gallagher Re reports Asia-Pacific cyber-insurance premiums climbing nearly 50% annually. Australia, Singapore, Japan, and South Korea spearhead spending, yet India and China add the largest volume of new deployments as domestic tech champions scale globally.
Latin America eyes 64% IT-budget expansion for 2025, prioritizing analytics that handle a region-wide average of 1,600 attacks per second. EMEA growth remains steady; Europe leans on GDPR and the forthcoming Cyber Resilience Act, while Middle East and North Africa security outlays are set to exceed USD 3 billion in 2025, spurred by AI adoption in oil, gas, and government sectors.
- Alert Logic, Inc.
- Arbor Networks, Inc. (NETSCOUT Systems, Inc.)
- Broadcom Inc. (Symantec Enterprise Division)
- Cisco Systems, Inc.
- RSA Security LLC
- Hewlett Packard Enterprise Company
- International Business Machines Corporation
- LogRhythm, Inc.
- Mandiant, Inc.
- Splunk Inc.
- Fortinet, Inc.
- McAfee, LLC
- Micro Focus International plc
- Securonix, Inc.
- Exabeam, Inc.
- Devo Technology, Inc.
- Microsoft Corporation
- Palo Alto Networks, Inc.
- CrowdStrike Holdings, Inc.
- Elastic N.V.
Additional Benefits:
- The market estimate (ME) sheet in Excel format
- 3 months of analyst support
TABLE OF CONTENTS
1 INTRODUCTION
- 1.1 Study Assumptions and Market Definition
- 1.2 Scope of the Study
2 RESEARCH METHODOLOGY
3 EXECUTIVE SUMMARY
4 MARKET LANDSCAPE
- 4.1 Market Overview
- 4.2 Market Drivers
- 4.2.1 Sophistication of cyber-threat landscape
- 4.2.2 Explosive growth of IoT and BYOD endpoints
- 4.2.3 Cloud-first digital-transformation programs
- 4.2.4 Expanding global cybersecurity-compliance regimes
- 4.2.5 AI-driven polymorphic malware emergence
- 4.2.6 Surge in unmanaged machine-to-machine identities
- 4.3 Market Restraints
- 4.3.1 Data-integration and tool-sprawl challenges
- 4.3.2 Global shortage of SOC analysts
- 4.3.3 High alert-fatigue and false-positive rates
- 4.3.4 Data-sovereignty rules restricting analytics
- 4.4 Value / Supply-Chain Analysis
- 4.5 Regulatory Landscape
- 4.6 Technological Outlook
- 4.7 Porter?s Five Forces
- 4.7.1 Threat of New Entrants
- 4.7.2 Bargaining Power of Buyers/Consumers
- 4.7.3 Bargaining Power of Suppliers
- 4.7.4 Threat of Substitute Products
- 4.7.5 Intensity of Competitive Rivalry
5 MARKET SIZE AND GROWTH FORECASTS
- 5.1 By Application
- 5.1.1 Network Security Analytics
- 5.1.2 Application Security Analytics
- 5.1.3 Web Security Analytics
- 5.1.4 Endpoint Security Analytics
- 5.1.5 Cloud Security Analytics
- 5.1.6 Insider Threat Analytics
- 5.2 By Deployment Mode
- 5.2.1 On-Premise
- 5.2.2 Cloud
- 5.2.3 Hybrid
- 5.3 By Organization Size
- 5.3.1 Large Enterprises
- 5.3.2 Small and Medium Enterprises
- 5.4 By End-user Industry
- 5.4.1 Banking and Financial Services
- 5.4.2 Healthcare
- 5.4.3 Defense and Security
- 5.4.4 Telecom and IT
- 5.4.5 Retail and E-Commerce
- 5.4.6 Manufacturing
- 5.4.7 Government
- 5.5 By Geography
- 5.5.1 North America
- 5.5.1.1 United States
- 5.5.1.2 Canada
- 5.5.1.3 Mexico
- 5.5.2 Europe
- 5.5.2.1 United Kingdom
- 5.5.2.2 Germany
- 5.5.2.3 France
- 5.5.2.4 Italy
- 5.5.2.5 Spain
- 5.5.2.6 Russia
- 5.5.2.7 Rest of Europe
- 5.5.3 Asia-Pacific
- 5.5.3.1 China
- 5.5.3.2 India
- 5.5.3.3 Japan
- 5.5.3.4 South Korea
- 5.5.3.5 Australia
- 5.5.3.6 Rest of Asia-Pacific
- 5.5.4 South America
- 5.5.4.1 Brazil
- 5.5.4.2 Argentina
- 5.5.4.3 Rest of South America
- 5.5.5 Middle East and Africa
- 5.5.5.1 Middle East
- 5.5.5.1.1 Saudi Arabia
- 5.5.5.1.2 United Arab Emirates
- 5.5.5.1.3 Turkey
- 5.5.5.1.4 Rest of Middle East
- 5.5.5.2 Africa
- 5.5.5.2.1 South Africa
- 5.5.5.2.2 Nigeria
- 5.5.5.2.3 Rest of Africa
- 5.5.1 North America
6 COMPETITIVE LANDSCAPE
- 6.1 Market Concentration
- 6.2 Strategic Moves
- 6.3 Market Share Analysis
- 6.4 Company Profiles (includes Global level Overview, Market level overview, Core Segments, Financials as available, Strategic Information, Market Rank/Share for key companies, Products and Services, and Recent Developments)
- 6.4.1 Alert Logic, Inc.
- 6.4.2 Arbor Networks, Inc. (NETSCOUT Systems, Inc.)
- 6.4.3 Broadcom Inc. (Symantec Enterprise Division)
- 6.4.4 Cisco Systems, Inc.
- 6.4.5 RSA Security LLC
- 6.4.6 Hewlett Packard Enterprise Company
- 6.4.7 International Business Machines Corporation
- 6.4.8 LogRhythm, Inc.
- 6.4.9 Mandiant, Inc.
- 6.4.10 Splunk Inc.
- 6.4.11 Fortinet, Inc.
- 6.4.12 McAfee, LLC
- 6.4.13 Micro Focus International plc
- 6.4.14 Securonix, Inc.
- 6.4.15 Exabeam, Inc.
- 6.4.16 Devo Technology, Inc.
- 6.4.17 Microsoft Corporation
- 6.4.18 Palo Alto Networks, Inc.
- 6.4.19 CrowdStrike Holdings, Inc.
- 6.4.20 Elastic N.V.
7 MARKET OPPORTUNITIES AND FUTURE OUTLOOK
- 7.1 White-space and Unmet-need Assessment
 2026年全球安全分析市场报告
 无人机法医学调查市场:按组件、最终用户、应用、产业垂直领域、部署模式和技术划分-全球预测,2026-2032年
 安全分析市场分析及预测(至 2035 年):按类型、产品类型、服务、技术、组件、应用、部署类型、最终用户和解决方案划分
 2026-2030年全球安全分析市场
 日本安全分析市场报告:按组件、应用、部署类型、组织规模、产业和地区划分,2026-2034 年
 安全分析市场 - 全球产业规模、份额、趋势、机会和预测(按组件、按部署模型、按应用、按地区和竞争细分,2020-2030 年预测)2025 年至 2033 年安全分析市场规模、份额、趋势及预测(按组件、应用、部署模式、组织规模、垂直行业和地区划分)
 保全分析的全球市场:各零件,各用途,各部署模式,各终端用户业界,各地区,机会,预测,2018年~2032年
 2032 年安全分析市场预测:按组件、部署类型、组织规模、应用程式、最终用户和地区进行的全球分析
 安全分析市场:2025-2030 年预测