


 |
市场调查报告书
商品编码
1851486
英国太阳能:市场份额分析、行业趋势、统计数据和成长预测(2025-2030 年)United Kingdom Solar Power - Market Share Analysis, Industry Trends & Statistics, Growth Forecasts (2025 - 2030) |
||||||
※ 本网页内容可能与最新版本有所差异。详细情况请与我们联繫。
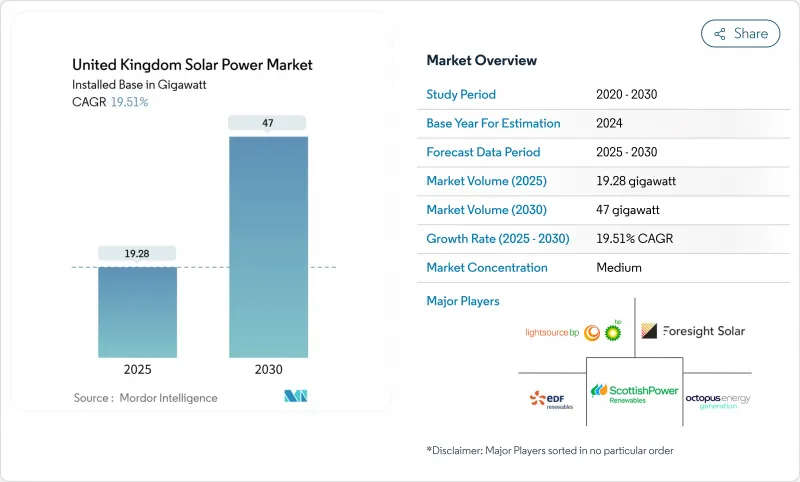
英国太阳能光电装置容量市场规模预计将从 2025 年的 19.28 吉瓦成长到 2030 年的 47 吉瓦,预测期(2025-2030 年)的复合年增长率为 19.51%。
如今,以商业经济为主导的模式已成为主流,市电平价定价使计划无需补贴即可参与竞争,而併网规则改革也缩短了已准备就绪的资产的等待时间。企业购电协议(PPA)活动的增加、农光互补和储能电站的成长、收入来源的拓展以及供应链本地化奖励,都降低了对进口的依赖风险。然而,持续存在的障碍包括土地利用规划方面的摩擦、英格兰北部地区较长的併网等待时间以及差价合约(CfD)价格波动导致净利率缩小。
英国太阳能市场趋势与洞察
可再生能源证书延期促进企业购电协议
随着再生能源证书(ROC)的购买价格在2025年至2026年间上涨至每张证书67.06英镑,直接购买太阳能电力购买协议(PPA)比支付违约金更划算,这促成了数百兆瓦的企业承诺,并为债务融资结构提供了支持。随着企业信贷取代补贴成为计划融资能力的核心,开发人员可以更快地筹集资金并扩大其专案储备。
实现平价上网加速商业太阳能发展
对于最佳地段而言,平准化成本低于批发日前价格,这使得开发人员无需差价合约 (CfD) 支持即可获得与市场挂钩的回报。英国国家电网公司斥资 580 亿英镑的「2030 年后升级计画」专门为商业再生能源分配容量,这正吸引着投资者的目光。
英格兰国家规划政策架构中的土地利用规划限制。
2018年至2023年间,三分之二的可再生能源提案被驳回或推迟,原因是农业保护法规凌驾于能源政策之上,迫使开发商在边际土地上进行开发,推高了成本,并延长了授权流程。地方政府往往缺乏专业人员,即使国家目标鼓励扩大太阳能发电,反对意见也会阻碍计划的进展。
细分市场分析
由于供应链日趋成熟且每瓦成本不断下降,到2024年,单晶硅将占据英国太阳能市场65%的份额。薄膜硅的复合年增长率高达20.8%,这主要得益于其柔性轻质组件,这些组件因其半透明特性有利于作物生长,在农业太阳能框架中备受青睐。增强型被动发送器极背接触(PERC)技术的持续发展不断降低电池价格,挤压了多晶的市场份额。新兴的钙钛矿/硅迭层结构已在实验室中测试出30%的效率,大学实验室计画在2027年前进行现场试验。随着可靠性门槛的降低,英国太阳能市场预计将采用高效的屋顶和建筑幕墙设计,支撑起具有较高空间溢价的组件平均售价。
到2024年,地面安装式光伏阵列将占英国太阳能光电市场的69%,这主要得益于辅助设备成本的下降和布局物流的简化。南部地区的农场正越来越多地采用追踪器,预计将使产量提高15%至25%。由于能源帐单持续不稳定以及新的建筑法规要求所有住宅从2025年6月起必须安装浮体式光电系统的可行性研究预测,其总合潜在发电量可达2.7太瓦时,但生态学授权延缓了该专案的实施。
英国太阳能光电市场报告按技术(单晶硅光伏、多晶光伏、其他)、安装类型(屋顶、地面安装、其他)、最终用户(住宅、商业/工业、公共产业)、併网类型(併网、离网)、容量范围(小于 5 千瓦、5-100 千瓦、100 千瓦-1 兆瓦、其他组件、光伏组件、光伏组件、光伏组件、逆变器类型、光伏组件、其他组件、光伏组件、光伏组件、光伏组件、光伏组件、光伏组件、其他组件、光伏组件、光伏组件、光伏组件、光伏组件、光伏组件、光变器、光伏组件、光伏组件、光伏组件、光伏组件、光伏组件、光变器中进行。
其他福利:
- Excel格式的市场预测(ME)表
- 3个月的分析师支持
目录
第一章 引言
- 研究假设和市场定义
- 调查范围
第二章调查方法
第三章执行摘要
第四章 市场情势
- 市场概览
- 市场驱动因素
- 可再生能源证书(ROC)延期促进企业购电协议(PPA)的签订
- 实现大型计划併市电平价,加速商业太阳能发电
- 国家电网电力系统营运商改革,鼓励参与分散式太阳能发电
- 随着英国农业部门脱碳,对农业光电的需求不断增长。
- Ofgem的灵活连接线提高了併网太阳能发电的经济效益
- 英国净零排放策略中针对原始设备製造商供应链在地化的奖励
- 市场限制
- 英格兰国家规划政策架构中的土地利用规划限制
- 新疆硅模组供应链的进口依赖风险
- 英格兰北部交通拥堵,转乘时间过长
- 波动较大的差价合约执行价格限制了小型计划的融资可行性。
- 供应链分析
- 监管环境
- 技术展望
- 波特五力模型
- 供应商的议价能力
- 买方的议价能力
- 新进入者的威胁
- 替代品的威胁
- 竞争对手之间的竞争
- PESTEL 分析
第五章 市场规模与成长预测
- 透过技术
- 单晶硅光电电池
- 多晶光电池
- 薄膜太阳能电池(CdTe、CIGS)
- 新兴高效率装置(TOPCon、HJT、钙钛矿串联装置)
- 拜山
- 屋顶太阳能
- 地面安装式太阳能
- 浮体式太阳能
- 最终用户
- 住宅
- 商业和工业
- 公用事业
- 并联型性别
- 併网
- 离网
- 按容量范围
- 小于5千瓦
- 5~100 kW
- 100 kW~1 MW
- 1兆瓦或以上
- 按组件
- 太阳能发电模组
- 逆变器
- 安装和追踪器
- 系统平衡 (BoS) 组件
第六章 竞争情势
- 市场集中度
- 策略性倡议(併购、伙伴关係、购电协议)
- 市场占有率分析(主要企业的市场排名/份额)
- 公司简介
- Lightsource bp Renewable Energy Investments Ltd
- EDF Renewables UK(Electricite de France SA)
- Octopus Energy Generation
- Foresight Solar Fund Ltd
- ScottishPower Renewables(Iberdrola SA)
- SSE Renewables
- Statkraft UK
- Vattenfall AB
- BayWa re UK Ltd
- First Solar Inc.
- JinkoSolar Holding Co. Ltd
- Canadian Solar Inc.
- Trina Solar Co. Ltd
- Anesco Ltd
- Hive Energy Ltd
- Renewable Energy Systems Ltd
- Ecotricity Group Ltd
- Ameresco Inc.
- NextEnergy Capital Group
- Good Energy Group PLC
第七章 市场机会与未来展望
The United Kingdom Solar Power Market size in terms of installed base is expected to grow from 19.28 gigawatt in 2025 to 47 gigawatt by 2030, at a CAGR of 19.51% during the forecast period (2025-2030).
Merchant economics now dominate as grid-parity pricing allows projects to compete without subsidies, while reforms to grid-connection rules shorten queues for ready-to-build assets. Enhanced corporate PPA activity, expanding agrivoltaics and battery-coupled plants, broadening revenue options, and supply-chain localisation incentives de-risk import reliance. Persistent hurdles include land-use planning friction, long Northern England interconnection wait times, and price volatility in the Contracts-for-Difference (CfD) auctions that narrows margins.
United Kingdom Solar Power Market Trends and Insights
Renewable Energy Obligation Certificates Extension Spurs Corporate PPAs
ROC buy-out prices rise to GBP 67.06 per certificate for 2025-2026, making direct solar PPAs cheaper than paying penalties and triggering multi-hundred-megawatt corporate contracts that now underpin debt finance structures. Corporate credit replaces subsidies as the core of project bankability, allowing developers to close financing more quickly and scale pipelines.
Grid-Parity Achievement Accelerates Merchant Solar
Levelised costs have fallen below wholesale day-ahead prices in the best-irradiated sites, letting developers forego CfD support and capture market-linked revenues. National Grid's GBP 58 billion Beyond 2030 upgrade programme specifically allocates capacity for merchant renewables, widening investor interest.
Land-Use Planning Constraints in England's NPPF
Two-thirds of renewable proposals were refused or delayed between 2018-2023 because agricultural protection rules override energy policy, forcing developers onto marginal land that inflates costs and elongates permitting. Local authorities often lack specialist staff, so objections stall projects even when national targets encourage solar expansion.
Other drivers and restraints analyzed in the detailed report include:
- National Grid ESO Reform Opens the Queue for Distributed Solar
- Battery-Coupled Solar Economics Strengthened by Flexible Connection Code
- Grid Congestion & Long Queue Times in Northern England
For complete list of drivers and restraints, kindly check the Table Of Contents.
Segment Analysis
Monocrystalline silicon held 65% of the UK solar power market share in 2024, thanks to maturing supply chains and falling per-watt costs. Thin-film's 20.8% CAGR stems from flexible, lighter modules valued in agrivoltaic frames where translucence supports crop growth. Enhanced passivated emitter and rear contact (PERC) lines continue lowering cell prices, squeezing polycrystalline's role. Emerging tandem perovskite-on-silicon architectures test 30% lab efficiencies, with university labs targeting field pilots by 2027. Once reliability hurdles fall, the UK solar power market could adopt high-efficiency designs for roof and facade areas where space premiums justify higher module ASPs.
Ground-mounted arrays commanded 69% of the UK solar power market size 2024 on lower balance-of-plant costs and simpler layout logistics. Tracker deployment is rising on southern farms, adding 15-25% yield uplift. Residential rooftops now post a 21.5% CAGR as energy bills remain volatile and new-build rules mandate panels on all homes from June 2025. Commercial rooftops follow, using self-consumption to sidestep non-commodity charges. Floating solar feasibility studies across reservoirs total 2.7 TWh of output potential, though ecological permitting slows real-world execution.
The United Kingdom Solar Power Market Report is Segmented by Technology (Monocrystalline Silicon PV, Polycrystalline Silicon PV, and Others), Mounting (Rooftop Solar, Ground-Mounted Solar, and Others), End User (Residential, Commercial and Industrial, and Utility), Grid Connectivity (On-Grid and Off-Grid), Capacity Range (Below 5 KW, 5 To 100 KW, 100 KW To 1 MW, and Others), and Component (Solar PV Modules, Inverters, and Others).
List of Companies Covered in this Report:
- Lightsource bp Renewable Energy Investments Ltd
- EDF Renewables UK (Electricite de France SA)
- Octopus Energy Generation
- Foresight Solar Fund Ltd
- ScottishPower Renewables (Iberdrola SA)
- SSE Renewables
- Statkraft UK
- Vattenfall AB
- BayWa r.e. UK Ltd
- First Solar Inc.
- JinkoSolar Holding Co. Ltd
- Canadian Solar Inc.
- Trina Solar Co. Ltd
- Anesco Ltd
- Hive Energy Ltd
- Renewable Energy Systems Ltd
- Ecotricity Group Ltd
- Ameresco Inc.
- NextEnergy Capital Group
- Good Energy Group PLC
Additional Benefits:
- The market estimate (ME) sheet in Excel format
- 3 months of analyst support
TABLE OF CONTENTS
1 Introduction
- 1.1 Study Assumptions & Market Definition
- 1.2 Scope of the Study
2 Research Methodology
3 Executive Summary
4 Market Landscape
- 4.1 Market Overview
- 4.2 Market Drivers
- 4.2.1 Renewable Energy Obligation Certificates (ROCs) Extension Spurs Corporate PPAs
- 4.2.2 Grid-Parity Achievement in Utility-scale Projects Accelerating Merchant Solar
- 4.2.3 National Grid's ESO Reform Favouring Distributed Solar Participation
- 4.2.4 Rising Demand for Agri-PV to Decarbonise UK Farming Sector
- 4.2.5 Battery-Coupled Solar Economics Enhanced by Ofgem's Flexible Connection Code
- 4.2.6 OEM Supply-Chain Localisation Incentives Under UK Net-Zero Strategy
- 4.3 Market Restraints
- 4.3.1 Land-Use Planning Constraints in England's National Planning Policy Framework
- 4.3.2 Import Dependency Risk from Xinjiang Silicon Module Supply Chain
- 4.3.3 Grid Congestion & Long Queue Times for Connections in Northern England
- 4.3.4 Volatile CFD Strike Prices Limiting Small-scale Project Bankability
- 4.4 Supply-Chain Analysis
- 4.5 Regulatory Landscape
- 4.6 Technological Outlook
- 4.7 Porter's Five Forces
- 4.7.1 Bargaining Power of Suppliers
- 4.7.2 Bargaining Power of Buyers
- 4.7.3 Threat of New Entrants
- 4.7.4 Threat of Substitutes
- 4.7.5 Competitive Rivalry
- 4.8 PESTLE Analysis
5 Market Size & Growth Forecasts
- 5.1 By Technology
- 5.1.1 Monocrystalline Silicon PV
- 5.1.2 Polycrystalline Silicon PV
- 5.1.3 Thin-Film PV (CdTe, CIGS)
- 5.1.4 Emerging High-Efficiency (TOPCon, HJT, Perovskite Tandem)
- 5.2 By Mounting
- 5.2.1 Rooftop Solar
- 5.2.2 Ground-Mounted Solar
- 5.2.3 Floating Solar
- 5.3 By End User
- 5.3.1 Residential
- 5.3.2 Commercial and Industrial
- 5.3.3 Utility
- 5.4 By Grid Connectivity
- 5.4.1 On-Grid
- 5.4.2 Off-Grid
- 5.5 By Capacity Range
- 5.5.1 Below 5 kW
- 5.5.2 5 to 100 kW
- 5.5.3 100 kW to 1 MW
- 5.5.4 Above 1 MW
- 5.6 By Component
- 5.6.1 Solar PV Modules
- 5.6.2 Inverters
- 5.6.3 Mounting Structures and Trackers
- 5.6.4 Balance of System (BoS) Components
6 Competitive Landscape
- 6.1 Market Concentration
- 6.2 Strategic Moves (M&A, Partnerships, PPAs)
- 6.3 Market Share Analysis (Market Rank/Share for key companies)
- 6.4 Company Profiles (includes Global level Overview, Market level overview, Core Segments, Financials as available, Strategic Information, Products & Services, and Recent Developments)
- 6.4.1 Lightsource bp Renewable Energy Investments Ltd
- 6.4.2 EDF Renewables UK (Electricite de France SA)
- 6.4.3 Octopus Energy Generation
- 6.4.4 Foresight Solar Fund Ltd
- 6.4.5 ScottishPower Renewables (Iberdrola SA)
- 6.4.6 SSE Renewables
- 6.4.7 Statkraft UK
- 6.4.8 Vattenfall AB
- 6.4.9 BayWa r.e. UK Ltd
- 6.4.10 First Solar Inc.
- 6.4.11 JinkoSolar Holding Co. Ltd
- 6.4.12 Canadian Solar Inc.
- 6.4.13 Trina Solar Co. Ltd
- 6.4.14 Anesco Ltd
- 6.4.15 Hive Energy Ltd
- 6.4.16 Renewable Energy Systems Ltd
- 6.4.17 Ecotricity Group Ltd
- 6.4.18 Ameresco Inc.
- 6.4.19 NextEnergy Capital Group
- 6.4.20 Good Energy Group PLC
7 Market Opportunities & Future Outlook
- 7.1 White-space & Unmet-Need Assessment
 2025年超高效能太阳能全球市场报告
 全球智慧太阳能市场
 全球太阳能电錶市场规模、份额和趋势分析(按技术、最终用途、产品、测量、整合类型和地区)、展望和预测(2025 年至 2032 年)太阳能光电市场分析及2034年预测:类型、产品、服务、技术、应用、组件、最终用户、安装类型、设备、解决方案太阳能电錶市场规模、份额、趋势分析报告(按整合类型、产品类型、检测法、技术、最终用途、地区、细分市场预测),2025 年至 2030 年美国太阳能电錶市场规模、份额、趋势分析报告(按整合类型、产品类型、检测法、技术、最终用途、细分市场预测,2025-2030 年)光伏帮浦市场分析及预测(至 2034 年):类型、产品、服务、技术、组件、应用、材料类型、部署、最终用户、功能
 太阳能光伏发电仪表市场,规模,占有率,趋势,产业分析报告:整合类别,各产品,检测法,各技术,各最终用途,各地区,2025年~2034年的市场预测
 太阳能电錶市场 - 全球产业规模、份额、趋势、机会和预测(细分、按类型、按测量、按最终用户、按外形尺寸、按地区、按竞争,2020-2030 年预测)2025年全球太阳能电錶市场报告