


 |
市场调查报告书
商品编码
1851513
防护涂料:市场占有率分析、产业趋势、统计数据和成长预测(2025-2030 年)Protective Coatings - Market Share Analysis, Industry Trends & Statistics, Growth Forecasts (2025 - 2030) |
||||||
※ 本网页内容可能与最新版本有所差异。详细情况请与我们联繫。
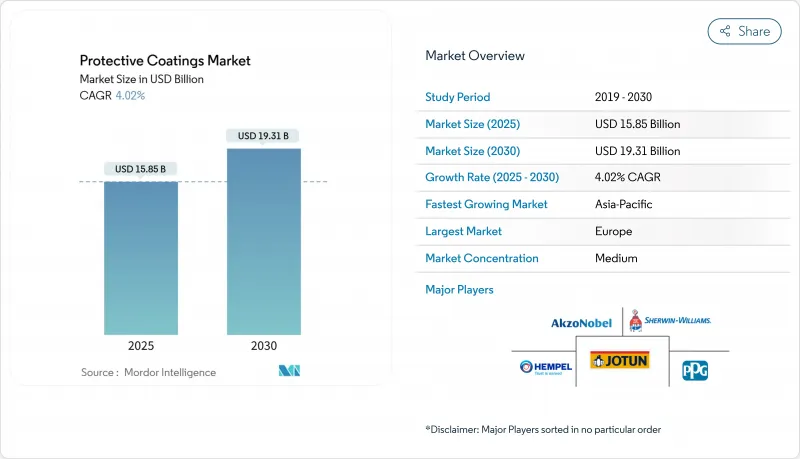
预计到 2025 年,防护涂料市场规模将达到 158.5 亿美元,到 2030 年将达到 193.1 亿美元,预测期(2025-2030 年)复合年增长率为 4.02%。
受严格的环境法规和巨额基础设施投资的推动,欧洲预计将占据最大市场份额,而亚太地区预计将以5.23%的复合年增长率(CAGR)成为到2030年增长最快的地区。基础设施建设、向更环保的化学品转型以及可再生能源和汽车轻量化的日益普及是推动成长的最主要因素。聚氨酯产品引领树脂需求,儘管面临挥发性有机化合物(VOC)的压力,溶剂型化学品仍然占据主导地位,而奈米技术正在为自修復和智慧表面开闢新的前景。儘管主要供应商之间的行业整合仍在继续,但新兴经济体以及塑胶和复合材料基材的先进解决方案仍存在市场空白。
全球防护涂料市场趋势与洞察
加大对基础建设的投资
大规模的公共投资,尤其是在交通、能源和市政计划领域,支撑着防护涂料市场的发展。光是美国《基础设施投资与就业法案》就投入数十亿美元用于桥樑和道路的修復,推动了对长效防腐蚀系统的需求。中国、印度和欧盟也在实施类似的计划,这些计划推动了耐久性要求的提高,进而促使高性能配方受到青睐。资产所有者越来越重视生命週期经济效益而非初始成本,要求使用维护週期更长的优质产品。因此,聚氨酯和富锌环氧树脂系统在钢桥和裸露钢筋混凝土的应用中越来越受欢迎。在沿海地区,盐分、湿度和温度循环会加速劣化,因此市场受益更为显着。
绿色涂料的需求不断增长
挥发性有机化合物(VOC)排放限制持续收紧,加州空气资源委员会(CARB)的规定现已成为全球标竿。配方师正积极应对,研发水性、高固含量和粉末配方,以提供与传统溶剂型产品相当的耐腐蚀性。环保替代方案也有助于资产所有者履行其永续性承诺。防护涂料市场正经历生物基聚氨酯分散体和低耗能固化粉末混合物的快速规模化应用。技术研发的重点在于树脂改性,以缩短干燥时间,同时保持光泽和机械性能。如今,可量化的环境足迹,而不仅仅是物理性能,正日益成为竞争差异化的关键因素。
挥发性有机化合物排放法规
更严格的VOC排放限制将迫使企业进行再製造,从而推高原材料成本并促使生产工厂进行设备改造。合规性也会延长终端用户的认证週期,最终使掌握水性或粉末涂料技术的供应商更占优势。随着资产所有者转向更环保的标准并减少因溶剂型涂料逐步淘汰而造成的收入损失,先行者将获得市场份额。随着时间的推移,技术创新将抵消大部分利润率下降,使合规生产商成为首选参与企业。
细分市场分析
到2024年,聚氨酯将占总收入的30.34%,这反映了其在基础设施、汽车和能源资产领域无与伦比的灵活性。预计到2030年,该细分市场将以4.79%的复合年增长率成长,成为树脂类产品中成长最快的。随着资产所有者倾向于选择具有高耐磨性和长效耐候性的系统,这些技术进步将推动聚氨酯在防护涂料市场的份额成长。生物基和湿固化多元醇的进步在不牺牲性能的前提下进一步改善了其环保特性。此外,离岸风力发电机中,模量和抗侵蚀性的平衡至关重要。
高固态和减水型聚氨酯正在再形成市场竞争格局。能够配製出既不牺牲适用期又不影响光泽保持性的聚氨酯产品的供应商,正在从溶剂型环氧树脂转向聚氨酯的计划中赢得更多市场份额。同时,奈米二氧化硅和石墨烯添加剂提高了抗刮性和热稳定性,使汽车透明涂层更具吸引力。因此,预计到2030年,聚氨酯将在树脂保护涂料市场中占据更大的份额。
到2024年,溶剂型涂料将占总收入的71.59%,这反映了其在严苛环境条件下卓越的成膜性能。海上平台、化工厂和管道维护涂料市场主要采用溶剂型涂料,因为资产停机成本远高于环境遵循成本。儘管面临监管方面的挑战,溶剂型涂料在2030年之前仍将保持可观的市场份额。然而,水性涂料的发展势头最为强劲,年复合增长率将达到4.58%,这得益于树脂成分的突破性进展,这些进展增强了涂料的阻隔性并加快了干燥速度。粉末涂料技术也正凭藉其零VOC认证和喷涂物可回收性,在钢结构、型材和消费性电子设备等领域不断拓展应用。
区域分析
永续性政策和建筑环境老化共同推动了防护涂料的普及。严格的REACH法规促使水性配方和高固含量配方推广,迫使供应商投资研发更环保的化学技术。
随着都市化和工业扩张的持续进行,亚太地区的应用量成长最为迅速。中国正将防护涂料的需求导向高速铁路路基、石化联合企业和大型造船厂。区域内河桥樑的升级改造也延长了维修週期。在印度,国家基础设施管道项目也反映了这一趋势,显着增加了钢筋混凝土的防腐蚀表面积。
北美地区虽然处于中间位置,但在高端技术领域至关重要。美国基础建设方案正将资金用于老旧的州际桥樑、机场和淡水系统。
其他福利:
- Excel格式的市场预测(ME)表
- 3个月的分析师支持
目录
第一章 引言
- 研究假设和市场定义
- 调查范围
第二章调查方法
第三章执行摘要
第四章 市场情势
- 市场概览
- 市场驱动因素
- 加大对基础建设的投资
- 绿色涂料需求不断成长
- 汽车产业的应用不断扩大
- 新能源领域需求不断成长
- 海洋产业消费增加
- 市场限制
- VOC排放法规
- 某些地区技术纯熟劳工短缺
- 原物料价格波动
- 价值链分析
- 波特五力模型
- 供应商的议价能力
- 买方的议价能力
- 新进入者的威胁
- 替代品的威胁
- 竞争程度
第五章 市场规模与成长预测
- 依树脂类型
- 环氧树脂
- 聚氨酯
- 乙烯基酯
- 聚酯纤维
- 醇酸
- 其他树脂(丙烯酸树脂、富锌树脂等)
- 透过技术
- 溶剂型
- 水溶液
- 粉末
- 其他製程(高固含量、紫外线固化等)
- 按基础材料
- 金属
- 具体的
- 塑胶和复合材料
- 其他基材(木材、玻璃等)
- 按最终用途行业划分
- 石油和天然气
- 管道(包括氢气管道)
- 其他的
- 矿业
- 电力
- 风力发电
- 其他发电部门
- 基础设施
- 水处理
- 供水管路(饮用水和污水排放)
- 海水淡化和饮用水处理
- 工业用水基础设施
- 其他终端用户产业(化工/石化、汽车、船舶)
- 石油和天然气
- 按地区
- 亚太地区
- 中国
- 印度
- 日本
- 韩国
- 亚太其他地区
- 北美洲
- 美国
- 加拿大
- 墨西哥
- 欧洲
- 德国
- 英国
- 法国
- 义大利
- 其他欧洲地区
- 南美洲
- 巴西
- 阿根廷
- 其他南美洲
- 中东和非洲
- 沙乌地阿拉伯
- 南非
- 其他中东和非洲地区
- 亚太地区
第六章 竞争情势
- 策略趋势
- 市占率(%)分析
- 公司简介
- Advanced Polymer Coatings
- Akzo Nobel NV
- Asian Paints PPG Pvt. Ltd.
- Axalta Coating Systems, LLC
- BASF
- Belzona International Ltd.
- Berger Paints India
- Chugoku Marine Paints, Ltd.
- DuluxGroup Ltd.
- Hempel A/S
- Jotun
- Kansai Paint Co.,Ltd.
- Nippon Paint Holdings Co., Ltd.
- PPG Industries, Inc.
- RPM International Inc.
- Sika AG
- Teknos Group
- The Sherwin-Williams Company
- Tikkurila
第七章 市场机会与未来展望
The Protective Coatings Market size is estimated at USD 15.85 billion in 2025, and is expected to reach USD 19.31 billion by 2030, at a CAGR of 4.02% during the forecast period (2025-2030).
Europe commanded the largest share, sustained by rigorous environmental rules and sizable infrastructure outlays, while Asia-Pacific is projected to record the fastest 5.23% CAGR through 2030. Infrastructure development, the transition toward eco-friendly chemistries, and rising adoption in renewable energy and automotive lightweighting are the most influential growth drivers. Polyurethane products lead resin demand, solvent-borne chemistries still prevail despite VOC pressure, and nanotechnology is opening new horizons for self-healing and smart surfaces. Industry consolidation among top suppliers continues, yet white-space opportunities persist in emerging economies and in advanced solutions for plastic and composite substrates.
Global Protective Coatings Market Trends and Insights
Increasing Investments in Infrastructure Construction
Massive public spending on transport, energy, and civic projects underpins the protective coatings market. The United States Infrastructure Investment and Jobs Act alone is injecting multibillion-dollar capital into bridge and road rehabilitation, boosting demand for long-life anticorrosive systems. Similar programs in China, India, and the European Union converge on durability mandates that favor high-performance formulations. Asset owners increasingly weigh lifecycle economics over upfront cost, translating into premium grades with extended maintenance intervals. Polyurethane and zinc-rich epoxy systems are thus gaining specification priority in steel bridges and rebar-exposed concrete. The market benefit is magnified in coastal regions where salt, humidity, and temperature cycling accelerate degradation.
Growing Green Coatings Demand
Regulations capping VOC emissions tighten year by year, especially under California Air Resources Board limits that now set reference benchmarks worldwide. Formulators respond with waterborne, high-solids, and powder chemistries demonstrating parity in corrosion resistance with legacy solvent products. Eco-friendly alternatives also help asset owners meet corporate sustainability pledges. The protective coatings market sees rapid scale-up of bio-based polyurethane dispersions and low-energy-cure powder blends. Technology development focuses on resin modifications that shorten drying time while sustaining gloss and mechanical performance. Competitive differentiation increasingly rests on quantifiable environmental footprints rather than solely on physical properties.
Regulations Related to VOC Emissions
Stricter VOC caps force reformulation, drive raw-material cost inflation, and compel capital upgrades in production plants. Compliance also prolongs qualification cycles with end users but eventually favors suppliers that master water-borne or powder technologies. Early movers capture share as asset owners pivot to greener standards, cushioning revenue loss from solvent-grade phase-outs. Over time, innovation offsets most margin erosion and positions compliant producers as preferred partners.
Other drivers and restraints analyzed in the detailed report include:
- Increasing Utilization from the Automotive Industry
- Growing Demand from the New Energy Sector
- Skilled Labor Shortage in Certain Geographies
For complete list of drivers and restraints, kindly check the Table Of Contents.
Segment Analysis
In 2024, polyurethane captured 30.34% of revenue, reflecting unparalleled flexibility across infrastructure, automotive, and energy assets. The segment is forecast to expand at a 4.79% CAGR through 2030, the fastest among resins. These advance lifts the polyurethane share of the protective coatings market as asset owners gravitate to systems exhibiting high abrasion resistance and long exterior durability. Advancements in bio-based polyols and moisture-cure variants further improve environmental profiles without sacrificing performance. Demand also benefits from rapid uptake in blade leading-edge protection for offshore wind turbines, where elastic moduli balance and erosion resistance are critical.
High solids and water-reducible grades reshape the competitive field. Suppliers that can formulate polyurethane without sacrificing pot life or gloss retention gain share in projects migrating away from solvent-based epoxies. Meanwhile, nano-silica and graphene additives raise scratch resistance and thermal stability, heightening appeal in automotive clearcoats. As a result, the polyurethane segment is set to account for an even larger slice of the protective coatings market size for resins by 2030.
Solvent-borne systems held 71.59% of sales in 2024, reflecting unmatched film formation under extreme ambient conditions. They dominate maintenance coatings on offshore platforms, chemical plants, and pipelines where asset downtime costs eclipse environmental compliance fees. Despite regulatory headwinds, the protective coatings market maintains a sizable solvent-borne volume through 2030 because no alternate cures reliably at very low temperatures or high humidity. Nevertheless, waterborne lines chart the most dynamic trajectory with a 4.58% CAGR, aided by resin synthesis breakthroughs that enhance barrier properties and accelerate drying. Powder technology also expands footprints in fabricated steel, aluminum profiles, and consumer equipment, leveraging zero-VOC credentials and recyclability of overspray.
The Protective Coatings Market Report Segments the Industry by Resin Type (Epoxy, Polyurethane, Vinyl Ester, Polyester, and More), Technology (Solvent-Borne, Water-Borne, Powder, and Other Technologies), Substrate (Metal, Concrete, and More), End-User Industry (Oil and Gas, Mining, Power, Infrastructure, and More), and Geography (Asia-Pacific, North America, Europe, South America, and Middle-East and Africa).
Geography Analysis
Europe remained the principal regional stronghold in 2024 with a 50.37% share of the market, as sustainability policy blended with an aging built environment to drive protective coating uptake. Stringent REACH regulations turbocharge the adoption of waterborne and high-solids formulations, compelling suppliers to invest in greener chemistries.
Asia-Pacific delivers the swiftest volume escalation as urbanization and industrial expansion persist. China channels protective coating demand into high-speed rail track beds, petrochemical complexes, and massive shipyards. Provincial initiatives to upgrade inland waterway bridges also enlarge refurbishment cycles. India mirrors this trajectory with its National Infrastructure Pipeline, creating substantial steel and concrete surface areas for corrosion control systems.
North America occupies an intermediate position yet remains pivotal for high-specification technologies. United States infrastructure packages direct capital toward aging interstate bridges, airports, and freshwater systems.
- Advanced Polymer Coatings
- Akzo Nobel N.V.
- Asian Paints PPG Pvt. Ltd.
- Axalta Coating Systems, LLC
- BASF
- Belzona International Ltd.
- Berger Paints India
- Chugoku Marine Paints, Ltd.
- DuluxGroup Ltd.
- Hempel A/S
- Jotun
- Kansai Paint Co.,Ltd.
- Nippon Paint Holdings Co., Ltd.
- PPG Industries, Inc.
- RPM International Inc.
- Sika AG
- Teknos Group
- The Sherwin-Williams Company
- Tikkurila
Additional Benefits:
- The market estimate (ME) sheet in Excel format
- 3 months of analyst support
TABLE OF CONTENTS
1 Introduction
- 1.1 Study Assumptions and Market Definition
- 1.2 Scope of the Study
2 Research Methodology
3 Executive Summary
4 Market Landscape
- 4.1 Market Overview
- 4.2 Market Drivers
- 4.2.1 Increasing Investments in Infrastructure Construction
- 4.2.2 Growing Green Coatings Demand
- 4.2.3 Increasing Utilzation from the Automotive Industry
- 4.2.4 Growing Demand from the New Energy Sector
- 4.2.5 Rising Consumption from the Marine Industry
- 4.3 Market Restraints
- 4.3.1 Regulations Related to VOC Emissions
- 4.3.2 Skilled Labor Shortage in Certain Geographies
- 4.3.3 Fluctuating Raw Material Prices
- 4.4 Value Chain Analysis
- 4.5 Porter's Five Forces
- 4.5.1 Bargaining Power of Suppliers
- 4.5.2 Bargaining Power of Buyers
- 4.5.3 Threat of New Entrants
- 4.5.4 Threat of Substitutes
- 4.5.5 Degree of Competition
5 Market Size and Growth Forecasts (Value)
- 5.1 By Resin Type
- 5.1.1 Epoxy
- 5.1.2 Polyurethane
- 5.1.3 Vinyl Ester
- 5.1.4 Polyester
- 5.1.5 Alkyd
- 5.1.6 Other Resins (Acrylic. Zinc-Rich, etc.)
- 5.2 By Technology
- 5.2.1 Solvent-borne
- 5.2.2 Water-borne
- 5.2.3 Powder
- 5.2.4 Other Technologies (High-Solids, UV-Cured, etc.)
- 5.3 By Substrate
- 5.3.1 Metal
- 5.3.2 Concrete
- 5.3.3 Plastic and Composites
- 5.3.4 Other Substrates (Wood, Glass, etc)
- 5.4 By End-use Industry
- 5.4.1 Oil and Gas
- 5.4.1.1 Pipeline (incl. Hydrogen Pipeline)
- 5.4.1.2 Others
- 5.4.2 Mining
- 5.4.3 Power
- 5.4.3.1 Wind Energy
- 5.4.3.2 Other Power Generating Sectors
- 5.4.4 Infrastructure
- 5.4.5 Water Treatment
- 5.4.5.1 Distribution Pipeline (potable Water and Wastewater Discharge)
- 5.4.5.2 Desalination and Potable Water Treatment
- 5.4.5.3 Industrial Water Infrastructure
- 5.4.6 Other End-User Industries(Chemicals and Petrochemicals, Automotive, Marine)
- 5.4.1 Oil and Gas
- 5.5 By Geography
- 5.5.1 Asia-Pacific
- 5.5.1.1 China
- 5.5.1.2 India
- 5.5.1.3 Japan
- 5.5.1.4 South Korea
- 5.5.1.5 Rest of Asia-Pacific
- 5.5.2 North America
- 5.5.2.1 United States
- 5.5.2.2 Canada
- 5.5.2.3 Mexico
- 5.5.3 Europe
- 5.5.3.1 Germany
- 5.5.3.2 United Kingdom
- 5.5.3.3 France
- 5.5.3.4 Italy
- 5.5.3.5 Rest of Europe
- 5.5.4 South America
- 5.5.4.1 Brazil
- 5.5.4.2 Argentina
- 5.5.4.3 Rest of South America
- 5.5.5 Middle-East and Africa
- 5.5.5.1 Saudi Arabia
- 5.5.5.2 South Africa
- 5.5.5.3 Rest of Middle-East and Africa
- 5.5.1 Asia-Pacific
6 Competitive Landscape
- 6.1 Strategic Moves
- 6.2 Market Share(%) Analysis
- 6.3 Company Profiles (includes Global level Overview, Market level overview, Core Segments, Financials as available, Strategic Information, Market Rank/Share, Products and Services, Recent Developments)
- 6.3.1 Advanced Polymer Coatings
- 6.3.2 Akzo Nobel N.V.
- 6.3.3 Asian Paints PPG Pvt. Ltd.
- 6.3.4 Axalta Coating Systems, LLC
- 6.3.5 BASF
- 6.3.6 Belzona International Ltd.
- 6.3.7 Berger Paints India
- 6.3.8 Chugoku Marine Paints, Ltd.
- 6.3.9 DuluxGroup Ltd.
- 6.3.10 Hempel A/S
- 6.3.11 Jotun
- 6.3.12 Kansai Paint Co.,Ltd.
- 6.3.13 Nippon Paint Holdings Co., Ltd.
- 6.3.14 PPG Industries, Inc.
- 6.3.15 RPM International Inc.
- 6.3.16 Sika AG
- 6.3.17 Teknos Group
- 6.3.18 The Sherwin-Williams Company
- 6.3.19 Tikkurila
7 Market Opportunities and Future Outlook
- 7.1 White-space and Unmet-Need Assessment
- 7.2 Nano-engineered Smart Self-healing Coatings
- 7.3 Bio-based Resin Systems for Offshore Wind Towers
 全球抗碳化涂料市场(按类型、技术、形式、最终用途、应用和分销管道划分)预测(2026-2032年)
 日本防护涂料市场报告(依树脂类型、技术、最终用途产业及地区划分,2026-2034年)
 防腐蚀涂料市场规模、份额、成长分析(按涂层技术、表麵类型、应用、环境及暴露条件、最终用途产业和地区划分)-2026-2033年产业预测
 按类型、应用、材料、终端用户产业和地区分類的薄膜市场规模、份额和成长分析 - 2026-2033 年产业预测
 防护涂料市场规模、份额和成长分析(按树脂类型、技术、应用、最终用途产业和地区划分)-2026-2033年产业预测
 光掩模薄膜:全球市占率排名、总销售额和需求预测(2025-2031年)
 全球MRO防护涂料市场全球防护薄膜市场
 2018-2034年全球防护涂料市场需求及预测分析
 亚洲的保护涂料市场:2025年