


 |
市场调查报告书
商品编码
1851548
诈骗侦测与预防(FDP):市场占有率分析、产业趋势、统计数据和成长预测(2025-2030 年)Fraud Detection And Prevention (FDP) - Market Share Analysis, Industry Trends & Statistics, Growth Forecasts (2025 - 2030) |
||||||
※ 本网页内容可能与最新版本有所差异。详细情况请与我们联繫。
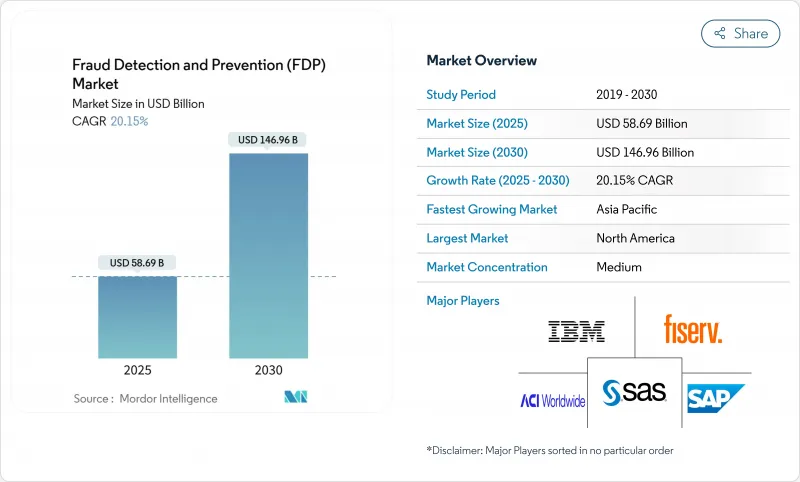
预计到 2025 年,诈欺侦测和预防市场规模将达到 586.9 亿美元,到 2030 年将达到 1,469.6 亿美元。
这种陡峭的成长轨迹反映了深度造假诈骗、合成身份和其他人工智慧驱动的威胁的激增,这些威胁正使传统规则引擎不堪重负,并推动对自适应机器学习防御的需求。监理力度,特别是欧洲的PSD3和PSR一揽子计画(将于2026年起强制执行强客户认证(SCA)),正在加速技术更新周期,因为银行正寻求即时协调安全性、合规性和客户体验。行动优先的支付习惯和相关立法(例如菲律宾的《金融帐户诈骗预防法》)正在推动各国诈欺侦测和预防市场的发展,该法案强制要求进行自动化即时监控。供应链诈骗的兴起,例如假冒零件诈骗的三位数激增,进一步凸显了企业如何日益将安全视为保护收入的手段,而不仅仅是合规成本。
全球诈骗侦测与预防 (FDP) 市场趋势与洞察
数位支付与电子商务的兴起
随着行动电子钱包、QR码和非接触感应卡在结帐流程中占据主导地位,攻击面不断扩大,旧有系统难以有效分析这些交易。因此,即时分析设备指纹和行为生物特征对于区分合法客户和机器人/脚本驱动的刷卡攻击至关重要。预计到2023年,电子商务诈骗损失将达到480亿美元,其中非接触式交易(CNP)是主要驱动因素。为此,商家正转向云端基础的风险引擎,这些引擎可在毫秒内完成交易评分。零售平台正越来越多地将这些引擎直接整合到付款闸道中,以在保持结帐速度的同时降低扣回争议帐款风险。随着数位化优先的消费者持续推动实体店客流量,各大主要地区对可扩展的、能够适应新型支付方式(例如先买后付和即时信用额度)的检测系统的需求日益增长。
高监理合规压力
欧洲的PSD3和PSR修订版已将强客户认证(SCA)的范围从双因素认证扩展到共用强制性受益人姓名认证以及金融机构间即时诈欺资料共享。随着银行整合各项产品以降低合规成本,提供涵盖认证、分析和彙报的单一平台的供应商获得了竞争优势。跨境贸易的全球化特性迫使美国银行和支付服务提供者(PSP)在服务欧盟客户时必须达到欧洲的SCA基准,从而有效地将更严格的标准推广至全球。亚太地区也出现了类似的倡议,新加坡和澳洲的监管机构已将营运许可证与受监控的诈欺阈值挂钩。因此,合规要求正在缩短实施週期,促使规避风险的金融机构转向云端基础设施,以便快速更新规则和模型,而无需冗长的变更管理週期。
高误报率会损害客户体验
过于敏感的规则集可能会将合法消费标记为可疑交易,触发人工审核,从而削弱即时支付的承诺。客户调查显示,如果合法交易连续两次被拒,一年内更换银行的可能性会增加两倍。现代人工智慧引擎可以透过分析个人消费习惯、季节性出行模式和设备偏好降低误报率,在不牺牲识别率的前提下,将误报数量减少一半。然而,向即时支付的转变将决策视窗压缩到仅几秒,几乎没有人工干预的空间。因此,金融机构正在更加谨慎地调整风险阈值,并接受小额诈欺损失略高的情况,以保障整体转换率和客户满意度指标。
细分市场分析
解决方案占据了诈欺侦测和预防市场规模的 63.9%,凸显了分析引擎、身分验证模组和调查员仪表板的关键作用。供应商正在利用自适应机器学习来优化规则库,使金融机构能够每天处理Terabyte的行为数据,并近乎即时地回应新的攻击特征。解决方案收入也反映了监管报告模组的收入,这些模组可以将侦测资料转换为符合审核要求的格式,使风险负责人无需使用其他工具即可满足 PSD3、GDPR 或 OCC 的审查要求。
儘管服务板块规模较小,但其复合年增长率 (CAGR) 高达 21.5%,这主要得益于董事会将全天候监控委託给託管安全专家,由他们提供校准模型、精选的全球威胁情报源和事件后取证服务。资料科学和网路安全营运领域的人才短缺,使得以结果为导向、保证检测率服务等级协定 (SLA) 的合约更具吸引力。同时,咨询业务正围绕解决方案部署展开,例如重组 KYC 流程、优化警报分级和简化争议解决流程。预计到 2030 年,这种技术与专业知识的整合将推动服务收入占比接近三分之一,从而巩固其在更广泛的诈欺侦测和预防市场中的策略地位。
到2024年,本地部署将占总收入的56.1%,因为顶级银行会利用其现有基础设施,并透过在自有资料中心处理个人识别资讯 (PII) 来遵守资料居住法规。这些公司倾向于采用混合模式,将模型训练迁移到云端,但将生产评分节点部署在私有丛集中,以最大限度地降低延迟。借助这种架构,即使在假日高峰尖峰时段,诈欺预防的延迟也能控制在10毫秒以内。
然而,云端原生平台正以 22.7% 的复合年增长率 (CAGR) 主导市场,而且这一差距很可能迅速缩小。订阅定价模式使中型金融机构和金融科技公司能够透过将授权费与交易成长挂钩来避免资本支出。领先的供应商现在预先打包了持续配置工具链,这些工具链每週多次更新侦测模型,从而缩短了发现新诈骗活动的视窗期。高级加密和机密计算区域解决了长期存在的安全问题,而 ISO 27001 和 SOC 2 等认证则让审核放心。这些优势的综合作用使云端成为未来诈欺侦测和预防市场的首选。
诈欺检测和预防市场按组件(解决方案、服务)、部署类型(云端、本地部署)、组织规模(中小企业、大型企业)、最终用户行业(银行、金融服务和保险、零售/电子商务、医疗保健等)以及地区进行细分。市场预测以美元计价。
区域分析
北美地区占2024年总收入的27.5%,是各地区中占比最高的。这主要得益于该地区早期采用云端运算、先进的威胁情报共用以及庞大的技术预算。美国财政部等联邦机构在部署人工智慧主导的异常检测技术后,于2024财年追回了10亿美元的支票诈骗损失。美国信用卡网路也积极推广基于人工智慧的预核准评分,以遏制非接触式支付(CNP)扣回争议帐款,并将诈欺逻辑直接嵌入支付系统。加拿大各银行正在组成联合联盟,共同打击新兴的即时支付系统诈骗,并在讯号交换方面展现区域合作。
欧洲也在迅速扩展监管,PSD3 和 PSR 引入了强制性的收件人姓名匹配和即时风险回馈。 GDPR 的限制将推动隐私保护型联邦学习的创新,使银行能够在无需传输原始资料的情况下进行跨行模型训练。根据新的 eIDAS 更新,电讯将被要求过滤欺骗性电话和恶意短信,从而将诈骗检测和预防市场扩展到电讯基础设施领域。西班牙等国对未实施这些措施的通讯业者处以 200 万欧元(235 万美元)的罚款,并将安全要求深度纳入其营运许可证。
亚太地区正以20.1%的复合年增长率(CAGR)领先全球,这主要得益于行动支付的普及以及分散的合规环境,后者迫使供应商提供可配置的策略引擎。菲律宾的《金融帐户诈骗预防法》强制要求金融机构实施规模化的诈骗预防系统,而印度储备银行(RBI)则强制要求对统一支付介面(UPI)即时支付进行基于人工智慧的交易监控。中国当地正在试行将人工智慧应用于福利分配中的腐败分析,证明了人工智慧的应用范围不仅限于金融科技领域,还可以用于公共资金的监控。这些动态共同推动了亚太地区对灵活、即时解决方案的需求,提升了亚太地区在全球诈欺侦测和预防市场中的地位。
其他福利:
- Excel格式的市场预测(ME)表
- 3个月的分析师支持
目录
第一章 引言
- 研究假设和市场定义
- 调查范围
第二章调查方法
第三章执行摘要
第四章 市场情势
- 市场概览
- 市场驱动因素
- 数位支付与电子商务的兴起
- 高监理合规压力
- 人工智慧/机器学习赋能的分析技术可提高侦测准确性
- 令牌化和 3-D Secure 2.3 推动了普及
- 开放银行/即时支付管道-新的诈骗途径
- 生成式人工智慧加剧了深度造假诈骗
- 市场限制
- 高假阳性率会损害客户体验。
- 与旧有系统整合的复杂性
- 缺乏用于训练人工智慧模型的标记资料集
- 隐私保护条例下的资料共用限制
- 供应链分析
- 监管环境
- 技术展望
- 波特五力模型
- 供应商的议价能力
- 买方的议价能力
- 新进入者的威胁
- 替代品的威胁
- 竞争对手之间的竞争
- 评估市场的宏观经济因素
第五章 市场规模与成长预测
- 按组件
- 解决方案
- 诈欺分析
- 认证
- 报告
- 视觉化
- 其他的
- 服务
- 解决方案
- 透过部署模式
- 云
- 本地部署
- 按组织规模
- 小型企业
- 大公司
- 按最终用户行业划分
- BFSI
- 零售与电子商务
- 资讯科技和电讯
- 卫生保健
- 能源与公共产业
- 製造业
- 政府/公共部门
- 其他的
- 按地区
- 北美洲
- 美国
- 加拿大
- 墨西哥
- 南美洲
- 巴西
- 阿根廷
- 其他南美洲
- 欧洲
- 英国
- 德国
- 法国
- 义大利
- 西班牙
- 其他欧洲地区
- 亚太地区
- 中国
- 日本
- 韩国
- 印度
- 澳洲
- 亚太其他地区
- 中东和非洲
- 中东
- 沙乌地阿拉伯
- 阿拉伯聯合大公国
- 土耳其
- 其他中东地区
- 非洲
- 南非
- 奈及利亚
- 埃及
- 其他非洲地区
- 北美洲
第六章 竞争情势
- 市场集中度
- 策略趋势
- 市占率分析
- 公司简介
- SAP SE
- IBM Corporation
- SAS Institute Inc.
- ACI Worldwide Inc.
- Fiserv Inc.
- Experian PLC
- DXC Technology Company
- BAE Systems PLC
- RSA Security LLC(Dell Technologies)
- Oracle Corporation
- NICE Ltd
- Equifax Inc.
- LexisNexis Risk Solutions
- Fair Isaac Corporation(FICO)
- Cybersource Corporation(Visa)
- Global Payments Inc.
- Feedzai SA
- Signifyd Inc.
- Riskified Ltd.
- Kount Inc.
第七章 市场机会与未来展望
The fraud detection and prevention market reached USD 58.69 billion in 2025 and is set to climb to USD 146.96 billion by 2030, translating into a 20.15% CAGR.
This steep trajectory mirrors the surge in deepfake scams, synthetic identities, and other AI-enabled threats that overwhelm legacy rule engines and elevate demand for adaptive machine-learning defenses. Regulatory momentum, notably the European PSD3 and PSR package that tightens Strong Customer Authentication (SCA) from 2026, accelerates technology refresh cycles as banks look to align security, compliance, and customer experience in real time. Fraud detection and prevention market in various countries is fueled by mobile-first payment habits and laws such as the Philippines' Anti-Financial Account Scamming Act that mandates automated, real-time monitoring. Intensifying supply-chain fraud, evidenced by triple-digit spikes in counterfeit component scams, further underscores because organizations now treat security as a revenue-protection lever, not merely a compliance cost.
Global Fraud Detection And Prevention (FDP) Market Trends and Insights
Rising Digital Payments and E-commerce Volumes
Mobile wallets, QR codes, and contactless cards now dominate checkout flows, expanding attack surfaces that legacy systems cannot parse effectively. Real-time analysis of device fingerprinting and behavioral biometrics has therefore become mandatory to distinguish legitimate customers from bots or scripted card-testing attacks.E-commerce fraud losses reached USD 48 billion in 2023, with card-not-present (CNP) transactions as the chief culprit, pushing merchants toward cloud-based risk engines that score transactions in milliseconds. Retail platforms increasingly embed these engines directly in payment gateways to preserve checkout speed while reducing chargeback exposure. As digital-first consumers continue to displace in-store traffic, demand for scalable detection that adapts to novel payment formats-such as buy-now-pay-later and instant-credit lines-intensifies across every major geography.
Stringent Regulatory Compliance Pressures
Europe's PSD3 and PSR overhaul expands SCA beyond two-factor credentials to include mandatory payee name verification and real-time fraud data sharing among financial institutions. Vendors that deliver single platforms covering authentication, analytics, and reporting gain an edge as banks consolidate point products to rein in compliance overhead. The global nature of cross-border commerce compels US banks and PSPs to meet European SCA benchmarks when serving EU clients, effectively exporting stricter standards worldwide. Similar momentum appears in Asia-Pacific, where regulators in Singapore and Australia link operating licences to monitored fraud thresholds. Compliance thus compresses deployment timelines, pushing even risk-averse institutions toward cloud infrastructures that offer rapid rule and model updates without lengthy change-control cycles.
High False-Positive Rates Hurting Customer Experience
Overly sensitive rule sets can tag legitimate spend as suspicious, triggering manual reviews that stall instant-payment expectations. Customer surveys show that two consecutively declined genuine transactions triple the likelihood of switching banks within a year. Modern AI engines reduce noise by profiling individual spending rhythms, seasonal travel patterns, and device preferences, cutting false-positive counts by up to half without sacrificing catch rates. Yet the shift to real-time settlement compresses decision windows to mere seconds, leaving no room for human intervention. Institutions therefore calibrate risk thresholds more carefully, accepting marginally higher fraud loss on low-ticket items to protect overall conversion and satisfaction metrics.
Other drivers and restraints analyzed in the detailed report include:
- AI/ML-Enabled Analytics Improving Detection Accuracy
- Generative-AI Deepfake Fraud Escalation
- Integration Complexity with Legacy Systems
For complete list of drivers and restraints, kindly check the Table Of Contents.
Segment Analysis
Solutions hold 63.9% of the fraud detection and prevention market size, underscoring the foundational role of analytics engines, authentication modules, and investigator dashboards. Vendors refine rule libraries with adaptive machine learning, letting financial institutions ingest terabytes of behavioral data per day and respond to fresh attack signatures in near real time. Solutions revenue also reflects regulatory reporting modules that convert detection data into audit-ready formats, allowing risk officers to satisfy PSD3, GDPR, or OCC exams without separate tooling.
Services, although smaller, are expanding at 21.5% CAGR as boards delegate 24/7 monitoring to managed-security specialists that provide calibrated models, curated global threat feeds, and post-incident forensics. Talent shortages in data science and cyber-ops elevate the appeal of outcome-based contracts that guarantee detection-rate SLAs. In parallel, consulting wraps around solution deployments to re-engineer KYC flows, optimize alert triage, and streamline dispute resolution. This convergence of technology and expertise is expected to lift services to almost one-third of 2030 revenue, reinforcing their strategic position within the broader fraud detection and prevention market.
On-premises installations retained 56.1% of 2024 revenue as tier-one banks leveraged sunk infrastructure and met data-residency statutes by processing PII in their own data centers. These firms favor hybrid patterns that shift model training to the cloud yet keep production scoring nodes in private clusters to minimize latency. Under such architectures, anti-fraud latency remains below 10 milliseconds even at holiday peak volumes.
Cloud-native platforms, however, outpace all others at a 22.7% CAGR and will narrow the share gap rapidly. Subscription pricing aligns license fees with transaction growth, letting mid-tier lenders and fintechs avoid capital outlays. Leading vendors now pre-package continuous deployment toolchains that refresh detection models multiple times per week, shortening exposure windows to novel frauds. Advanced encryption and confidential-compute zones address lingering sovereignty worries, while certifications like ISO 27001 and SOC 2 reassure auditors. These advantages collectively establish cloud as the future default for the fraud detection and prevention market.
Fraud Detection and Prevention Market is Segmented by Component (Solutions, Services), Deployment Mode (Cloud, On-Premises), Organization Size (SMEs, Large Enterprises), End-User Industry (BFSI, Retail and E-Commerce, Healthcare, and More), and by Geography. The Market Forecasts are Provided in Terms of Value (USD).
Geography Analysis
North America generated the largest regional slice at 27.5% of 2024 revenue, supported by early cloud adoption, sophisticated threat intelligence sharing, and sizeable technology budgets. Federal agencies such as the US Treasury recovered USD 1 billion in check fraud during fiscal 2024 after deploying AI-driven anomaly detection, signaling public-sector validation that further stimulates private-sector uptake. US card networks likewise advocate AI-based pre-authorization scoring to curb CNP chargebacks, embedding fraud logic directly in payment rails. Canadian banks collaborate in a joint consortium to combat emerging real-time rail fraud, demonstrating regional co-operation on signals exchange.
Europe follows with rapid regulatory expansion as PSD3 and PSR introduce mandatory payee-name matching and real-time risk feeds. GDPR constraints drive innovation in privacy-preserving federated learning, allowing banks to train cross-bank models without raw-data transfers. Telecom operators must filter spoofed calls and malware SMS under new eIDAS updates, broadening the fraud detection and prevention market into telco infrastructure. Nations such as Spain impose EUR 2 million (USD 2.35 million) fines on carriers that fail to implement these measures, embedding security requirements deep in operational licences.
Asia-Pacific records the fastest 20.1% CAGR, led by high mobile payment penetration and fragmented compliance terrain that forces vendors to offer configurable policy engines. The Philippines' Anti-Financial Account Scamming Act compels fraud systems scaled to institution size, while India's RBI mandates AI-powered transaction monitoring for UPI instant payments. Mainland China pilots AI corruption analytics on welfare distributions, proving applicability beyond fintech into public-fund oversight. Together, these dynamics amplify regional demand for flexible, real-time solutions, elevating APAC's weighting in the global fraud detection and prevention market.
- SAP SE
- IBM Corporation
- SAS Institute Inc.
- ACI Worldwide Inc.
- Fiserv Inc.
- Experian PLC
- DXC Technology Company
- BAE Systems PLC
- RSA Security LLC (Dell Technologies)
- Oracle Corporation
- NICE Ltd
- Equifax Inc.
- LexisNexis Risk Solutions
- Fair Isaac Corporation (FICO)
- Cybersource Corporation (Visa)
- Global Payments Inc.
- Feedzai SA
- Signifyd Inc.
- Riskified Ltd.
- Kount Inc.
Additional Benefits:
- The market estimate (ME) sheet in Excel format
- 3 months of analyst support
TABLE OF CONTENTS
1 INTRODUCTION
- 1.1 Study Assumptions and Market Definition
- 1.2 Scope of the Study
2 RESEARCH METHODOLOGY
3 EXECUTIVE SUMMARY
4 MARKET LANDSCAPE
- 4.1 Market Overview
- 4.2 Market Drivers
- 4.2.1 Rising digital payments and e-commerce volumes
- 4.2.2 Stringent regulatory compliance pressures
- 4.2.3 AI/ML-enabled analytics improving detection accuracy
- 4.2.4 Tokenization and 3-D Secure 2.3 boosting adoption
- 4.2.5 Open Banking/instant-payment rails - new fraud vectors
- 4.2.6 Generative-AI deepfake fraud escalation
- 4.3 Market Restraints
- 4.3.1 High false-positive rates hurting CX
- 4.3.2 Integration complexity with legacy systems
- 4.3.3 Lack of labelled data sets for AI model training
- 4.3.4 Data-sharing limits under privacy regulations
- 4.4 Supply-Chain Analysis
- 4.5 Regulatory Landscape
- 4.6 Technological Outlook
- 4.7 Porter's Five Forces
- 4.7.1 Bargaining Power of Suppliers
- 4.7.2 Bargaining Power of Buyers
- 4.7.3 Threat of New Entrants
- 4.7.4 Threat of Substitutes
- 4.7.5 Intensity of Competitive Rivalry
- 4.8 Assesment of Macroeconomic Factors on the market
5 MARKET SIZE AND GROWTH FORECASTS (VALUE)
- 5.1 By Component
- 5.1.1 Solutions
- 5.1.1.1 Fraud Analytics
- 5.1.1.2 Authentication
- 5.1.1.3 Reporting
- 5.1.1.4 Visualization
- 5.1.1.5 Others
- 5.1.2 Services
- 5.1.1 Solutions
- 5.2 By Deployment Mode
- 5.2.1 Cloud
- 5.2.2 On-premises
- 5.3 By Organization Size
- 5.3.1 Small and Medium Enterprises
- 5.3.2 Large Enterprises
- 5.4 By End-user Industry
- 5.4.1 BFSI
- 5.4.2 Retail and E-commerce
- 5.4.3 IT and Telecom
- 5.4.4 Healthcare
- 5.4.5 Energy and Utilities
- 5.4.6 Manufacturing
- 5.4.7 Government and Public Sector
- 5.4.8 Others
- 5.5 By Geography
- 5.5.1 North America
- 5.5.1.1 United States
- 5.5.1.2 Canada
- 5.5.1.3 Mexico
- 5.5.2 South America
- 5.5.2.1 Brazil
- 5.5.2.2 Argentina
- 5.5.2.3 Rest of South America
- 5.5.3 Europe
- 5.5.3.1 United Kingdom
- 5.5.3.2 Germany
- 5.5.3.3 France
- 5.5.3.4 Italy
- 5.5.3.5 Spain
- 5.5.3.6 Rest of Europe
- 5.5.4 Asia-Pacific
- 5.5.4.1 China
- 5.5.4.2 Japan
- 5.5.4.3 South Korea
- 5.5.4.4 India
- 5.5.4.5 Australia
- 5.5.4.6 Rest of Asia-Pacific
- 5.5.5 Middle East and Africa
- 5.5.5.1 Middle East
- 5.5.5.1.1 Saudi Arabia
- 5.5.5.1.2 United Arab Emirates
- 5.5.5.1.3 Turkey
- 5.5.5.1.4 Rest of Middle East
- 5.5.5.2 Africa
- 5.5.5.2.1 South Africa
- 5.5.5.2.2 Nigeria
- 5.5.5.2.3 Egypt
- 5.5.5.2.4 Rest of Africa
- 5.5.1 North America
6 COMPETITIVE LANDSCAPE
- 6.1 Market Concentration
- 6.2 Strategic Moves
- 6.3 Market Share Analysis
- 6.4 Company Profiles (includes Global level Overview, Market level overview, Core Segments, Financials as available, Strategic Information, Market Rank/Share for key companies, Products and Services, and Recent Developments)
- 6.4.1 SAP SE
- 6.4.2 IBM Corporation
- 6.4.3 SAS Institute Inc.
- 6.4.4 ACI Worldwide Inc.
- 6.4.5 Fiserv Inc.
- 6.4.6 Experian PLC
- 6.4.7 DXC Technology Company
- 6.4.8 BAE Systems PLC
- 6.4.9 RSA Security LLC (Dell Technologies)
- 6.4.10 Oracle Corporation
- 6.4.11 NICE Ltd
- 6.4.12 Equifax Inc.
- 6.4.13 LexisNexis Risk Solutions
- 6.4.14 Fair Isaac Corporation (FICO)
- 6.4.15 Cybersource Corporation (Visa)
- 6.4.16 Global Payments Inc.
- 6.4.17 Feedzai SA
- 6.4.18 Signifyd Inc.
- 6.4.19 Riskified Ltd.
- 6.4.20 Kount Inc.
7 MARKET OPPORTUNITIES AND FUTURE OUTLOOK
- 7.1 White-space and Unmet-need Assessment
 2025年全球语音流量检验市场报告
 全球诈骗侦测与预防市场:预测至 2032 年-按组件、部署方式、组织规模、诈欺类型、最终用户和地区进行分析
 按组件、解决方案类型和地区分類的诈欺侦测市场2025年全球人工智慧(AI)采购诈欺侦测市场报告人工智慧驱动的诈欺预测网路市场预测至2032年:按组件、部署类型、应用、最终用户和地区分類的全球分析全球人工智慧通讯网路市场:预测至 2032 年—按产品、部署方式、技术、应用、最终用户和地区进行分析
 电子商务防诈骗软体 - 全球市场占有率和排名、总收入和需求预测(2025-2031年)2025年人工智慧(AI)语音诈欺侦测全球市场报告2025年量子人工智慧(AI)诈骗热图全球市场报告2025年量子人工智慧(AI)金融诈骗模拟器全球市场报告