


 |
市场调查报告书
商品编码
1851561
液化天然气(LNG):市场占有率分析、产业趋势、统计数据和成长预测(2025-2030 年)Liquefied Natural Gas (LNG) - Market Share Analysis, Industry Trends & Statistics, Growth Forecasts (2025 - 2030) |
||||||
※ 本网页内容可能与最新版本有所差异。详细情况请与我们联繫。
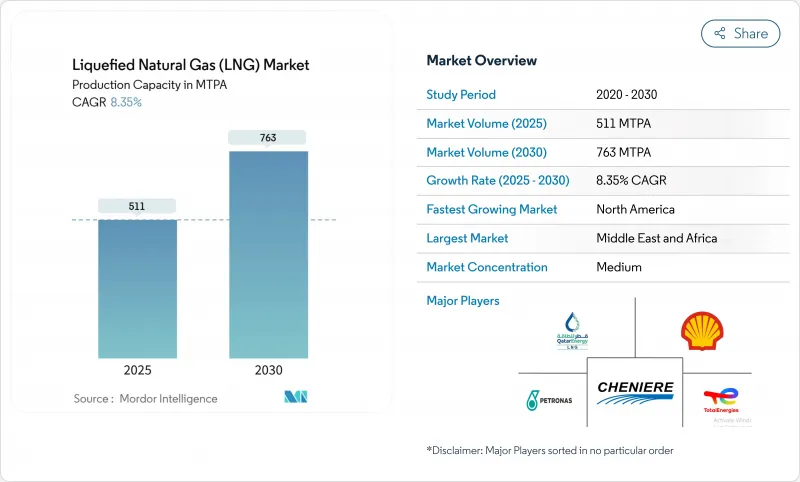
预计液化天然气 (LNG) 市场产能将从 2025 年的 511 百万吨/年增长到 2030 年的 763 百万吨/年,预测期 (2025-2030 年) 的复合年增长率为 8.35%。
能源安全目标和脱碳要求正推动各国政府和公用事业公司将液化天然气(LNG)作为过渡燃料,而浮体式LNG技术的快速普及正在拓展供应选择,并释放先前閒置的近海资源。北美出口终端正受益于来自二迭纪盆地的低成本原料气,航运业正转向使用LNG以符合硫含量上限要求,电气化和碳捕获升级正在提升营运的永续性。技术主导的成本控制和灵活的合约结构正在重塑交易格局,但持续的工程总承包(EPC)成本上涨和可再生氢的兴起仍然是液化天然气市场的焦点。
全球液化天然气(LNG)市场趋势与洞察
亚太地区天然气发电计划激增,寻求中游液化天然气承购协议
亚太电力公司正在新增超过1,000亿立方公尺的天然气再气化产能,而印度计画在2030年将其天然气消费量提高60%。该国的脱碳目标正在加速煤改气进程,并鼓励签订将液化天然气供应与购电协议直接挂钩的整合合约。这种紧密的天然气连结可以降低资金筹措风险,提高计划融资可行性,并增强液化天然气市场的长期需求。
欧洲在国际海事组织2020年实施硫含量上限后,液化天然气作为船用燃料迅速普及。
预计2024年,全球液化天然气(LNG)动力船舶数量将增加33%,达到638艘,到2028年将超过1,200艘。货柜船占LNG装载载重吨的60%,198个港口的加註基础建设正在加速推进。由于生物LNG计画的推进,液化天然气市场正获得进一步发展动力,这些计画将有助于更好地遵守未来的排放法规。
EPC成本上涨和模组製造瓶颈导致最终投资决策(FID)延期。
2024年仅有1,480万吨/年的产能达到最终投资决定(FID),在成本上涨20-30%和劳动力短缺的情况下,产能大幅下降。儘管资本成本不断上涨,模组化建造方式仍日益普及,但延误可能会扩大2027年至2029年间的供应缺口,引发液化天然气市场的波动。
细分市场分析
液化天然气工厂到2024年将占总收入的43%,在液化天然气市场中占比最高。卡达、美国和澳洲的产能扩张将支撑到2030年预计11.1%的复合年增长率。电动压缩机和碳捕获技术将减少排放,并增强大型综合企业的竞争力。
该领域的生态系统目前包括904艘液化天然气运输船,其中许多配备了低甲烷引擎以减少温室气体排放。从2021年起,浮式储存再气化装置(FSRU)每年新增7,700万吨再气化能力,检验了液化天然气市场模组化部署的可行性,并加速了进口成长,尤其是在欧洲。
到2024年,发电将占天然气需求的38%,并且正在亚洲透过一体化液化天然气发电计划不断扩张。这些项目将终端、储存和发电资产结合在一起,降低了信用风险,并扩大了液化天然气市场的覆盖范围。
在所有应用领域中,船舶燃料库预计将以14%的复合年增长率实现最快成长。船队规模的扩大、港口燃料库网路的完善以及生物液化天然气试点计画的开展,都预示着船舶加油业务将持续成长,使其成为液化天然气市场的重要推动力量。
液化天然气 (LNG) 市场报告按基础设施类型(LNG 液化厂、LNG 再气化设施、LNG 船队)、最终用途(发电、工业/製造业、其他)、规模(大型、中型、小型)、位置(陆上/海上)和地区(北美、欧洲、亚太地区、南美、中东和非洲)进行细分。
区域分析
2024年,中东和非洲占全球市场份额的28%。卡达北部气田的产能将于2027年从7,700万吨/年扩建至1.26亿吨/年,将巩固其区域领先地位,并提升欧亚之间的运输弹性。阿联酋和茅利塔尼亚的新项目将进一步拓展液化天然气市场,但经由霍尔木兹海峡的油轮保险成本仍是营运方面的一个问题。
由于丰富的页岩气资源和一条年产能1,330万吨的出口生产线将于2025年投入运营,北美页岩气市场预计到2030年将维持10.5%的复合年增长率。加拿大基蒂马特的Start-Ups以及与亨利枢纽相关的交易正在推动买家的兴趣,但授权的暂时中止削弱了2020年代中期最终投资决策的前景。
亚太地区仍是最大的进口中心,其中中国在2024年的进口量为7,864万吨。菲律宾和越南作为首次进口国,将扩大其客户群,而小规模的液化天然气分销将推动整个群岛的供应。日本和韩国可再生能源和氢能试点计画的成长,为区域消费带来了长期的不确定性。
自 2021 年以来,欧洲已部署多艘浮动储存再气化装置 (FSRU) 来取代俄罗斯管道,使再气供给能力提高了 44%。季节性需求激增将维持高价,而即将推出的欧盟甲烷法规将加强对液化天然气市场供应链的审查。
其他好处
- Excel格式的市场预测(ME)表
- 3个月的分析师支持
目录
第一章 引言
- 研究假设和市场定义
- 调查范围
第二章调查方法
第三章执行摘要
第四章 市场情势
- 市场概览
- 市场驱动因素
- 亚太地区燃气发电工程激增,寻求液化天然气承购协议
- 欧洲在国际海事组织2020年实施硫含量上限后,液化天然气作为船用燃料迅速普及。
- 二迭纪盆地联产气产量为美国墨西哥湾沿岸出口码头提供低成本原料
- 浮体式液化天然气技术释放非洲海上閒置天然气田的潜力
- 中国工业锅炉煤改气政策将促进现货液化天然气进口。
- 经合组织市场能源密集型资料中心对低碳供应的需求日益增长
- 市场限制
- EPC成本上涨和模组製造瓶颈导致最终投资决策(FID)延期。
- 来自可再生氢的竞争抑制了东北亚地区对长期液化天然气合约的需求。
- 美国和加拿大暂停发放新的液化天然气出口许可证
- 关键咽喉要道(霍尔木兹海峡、苏伊士运河区)的地缘政治风险将增加液化天然气运输船的保险成本。
- 供应链分析
- 监理展望
- 技术展望
- 波特五力模型
- 供应商的议价能力
- 买方的议价能力
- 新进入者的威胁
- 替代品的威胁
- 竞争对手之间的竞争
第五章 市场规模与成长预测
- 依基础设施类型
- 液化天然气工厂[陆上液化、浮体式液化天然气(FLNG)、中型(1-5百万吨/年)、小型(小于1百万吨/年)]
- 液化天然气再气化设施[陆上进口终端、浮体式储存再气化装置(FSRU)]
- LNG船队[LNG运输船类型(Moss、Membrane)、运输船类型(Q-Max、Q-Flex、Standard)、LNG燃料库船]
- 按最终用途
- 发电业务
- 工业和製造业
- 住宅及商业地产
- 运输(船舶燃料库、重型道路运输、铁路运输)
- 按尺寸
- 大规模(超过500万吨/年)
- 中等规模(1-5百万吨/年)
- 小规模(小于1吨/年)
- 按地区
- 陆上
- 海上(FLNG 和 FSRU)
- 按地区
- 北美洲
- 美国
- 加拿大
- 墨西哥
- 欧洲
- 英国
- 德国
- 法国
- 西班牙
- 北欧国家
- 俄罗斯
- 其他欧洲地区
- 亚太地区
- 中国
- 印度
- 日本
- 韩国
- 东南亚国协
- 澳洲
- 亚太其他地区
- 南美洲
- 巴西
- 阿根廷
- 哥伦比亚
- 南美洲其他地区
- 中东和非洲
- 阿拉伯聯合大公国
- 沙乌地阿拉伯
- 卡达
- 南非
- 埃及
- 其他中东和非洲地区
- 北美洲
第六章 竞争情势
- 市场集中度
- 策略性倡议(併购、伙伴关係、购电协议)
- 市场占有率分析(主要企业的市场排名/份额)
- 公司简介
- QatarEnergy LNG(Qatargas)
- Shell plc
- Cheniere Energy Inc.
- TotalEnergies SE
- Petronas
- Novatek
- Chevron Corporation
- Exxon Mobil Corporation
- Woodside Energy Group
- Equinor ASA
- Sempra Infrastructure
- Venture Global LNG
- ENI SpA
- KOGAS
- Mitsui OSK Lines
- Golar LNG
- BW LNG
- Technip Energies
- Bechtel Corporation
- Fluor Corporation
- KBR Inc.
第七章 市场机会与未来展望
The Liquefied Natural Gas Market size in terms of production capacity is expected to grow from 511 MTPA in 2025 to 763 MTPA by 2030, at a CAGR of 8.35% during the forecast period (2025-2030).
Energy-security goals and decarbonization mandates are steering governments and utilities toward LNG as a transitional fuel, while the rapid adoption of floating LNG technology broadens supply options and unlocks previously stranded offshore resources. North American export terminals enjoy low-cost feedgas from the Permian Basin, marine shipping is pivoting to LNG for sulfur-cap compliance, and electrification plus carbon-capture upgrades are advancing operational sustainability. Technology-driven cost management and flexible contract structures are reshaping trade patterns, yet prolonged EPC inflation and the rise of renewable hydrogen remain watchpoints for the liquefied natural gas market.
Global Liquefied Natural Gas (LNG) Market Trends and Insights
Surge in Asia-Pacific Gas-to-Power Projects Seeking Midstream LNG Offtake Agreements
Asia-Pacific utilities are adding over 100 bcm of new regasification capacity, and India plans to lift gas consumption 60% by 2030. National decarbonization targets are accelerating coal-to-gas switching and prompting integrated contracts that link LNG supply directly to power-purchase deals. This tight coupling lowers financing risk, improves project bankability, and reinforces long-run demand for the liquefied natural gas market.
Rapid Uptake of LNG as Marine Bunker Fuel Following IMO-2020 Sulfur Cap in Europe
The global LNG-fueled fleet grew 33% in 2024 to 638 vessels and is expected to exceed 1,200 ships by 2028. Container lines represent 60% of LNG-propelled deadweight tonnage, driving accelerated bunker-infrastructure rollout in 198 ports. The liquefied natural gas market is picking up additional momentum from bio-LNG initiatives that extend compliance into future emissions-control regimes.
Prolonged FID Delays Owing to EPC-Cost Inflation & Module Fabrication Bottlenecks
Just 14.8 MTPA of capacity reached FID in 2024, down sharply amid 20-30% cost jumps and labor shortages. Modular construction is gaining favor despite higher equipment prices, yet delays could open a supply gap in 2027-2029, inducing volatility across the liquefied natural gas market.
Other drivers and restraints analyzed in the detailed report include:
- Permian Basin Associated Gas Output Unlocks Low-Cost Feedgas for U.S. Gulf-Coast Export Terminals
- Floating LNG Technology Unlocking Stranded Offshore Gas Fields in Africa
- Competitiveness of Renewable Hydrogen Eroding Long-Term LNG Contract Appetite in Northeast Asia
For complete list of drivers and restraints, kindly check the Table Of Contents.
Segment Analysis
Liquefaction plants held 43% of 2024 revenues, the highest within the liquefied natural gas market. Capacity boosts in Qatar, the United States, and Australia underpin a forecast 11.1% CAGR to 2030. Electrified compressors and carbon capture trim emissions and sharpen competitive edges for integrated majors.
The segment's ecosystem now includes 904 LNG carriers, many fitted with low-methane-slip engines that curb greenhouse-gas intensity. FSRUs are accelerating import growth, especially in Europe, adding 77 MMtpy of regas capacity since 2021 and validating modular deployment for the liquefied natural gas market.
Power generation retained 38% of demand in 2024 and is expanding through integrated LNG-to-power projects in Asia. These setups consolidate terminal, storage, and generation assets, lowering credit risk and deepening the liquefied natural gas market footprint.
Marine bunkering is poised for a 14% CAGR, the fastest among applications. Fleet counts, port bunkering networks, and bio-LNG pilots signal durable growth, positioning shipping as a dynamic contributor to the liquefied natural gas market.
The Liquefied Natural Gas (LNG) Market Report is Segmented by Infrastructure Type (LNG Liquefaction Plants, LNG Regasification Facilities, and LNG Shipping Fleet), End-Use Application (Power Generation, Industrial and Manufacturing, and Others), Scale (Large-Scale, Mid-Scale, and Small-Scale), Location (Onshore and Offshore), and Geography (North America, Europe, Asia-Pacific, South America, and Middle East and Africa).
Geography Analysis
The Middle East & Africa held 28% of the 2024 market. Qatar's North Field build-out from 77 MTPA to 126 MTPA by 2027 cements regional leadership and improves routing flexibility between Europe and Asia. New UAE and Mauritanian ventures add depth, though tanker insurance costs through Hormuz remain an operational concern for the liquefied natural gas market.
North America is set for a 10.5% CAGR through 2030 thanks to abundant shale gas and 13.3 MTPA of export trains entering service in 2025. Canada's Kitimat start-up and Henry-Hub-linked contracts amplify buyer interest, although temporary permitting pauses temper mid-decade FID outlooks.
Asia-Pacific remains the largest import center, with China purchasing 78.64 million t in 2024. First-time importers in the Philippines and Vietnam broaden the customer base, while small-scale LNG distribution gains traction for archipelagic supply. Renewable energy growth and hydrogen pilots in Japan and South Korea inject longer-term uncertainty into regional consumption.
Europe expanded regas capacity by 44% since 2021, installing multiple FSRUs to replace Russian pipeline volumes. Seasonal demand spikes sustain premium pricing, and impending EU methane rules will intensify supply-chain monitoring across the liquefied natural gas market.
- QatarEnergy LNG (Qatargas)
- Shell plc
- Cheniere Energy Inc.
- TotalEnergies SE
- Petronas
- Novatek
- Chevron Corporation
- Exxon Mobil Corporation
- Woodside Energy Group
- Equinor ASA
- Sempra Infrastructure
- Venture Global LNG
- ENI SpA
- KOGAS
- Mitsui O.S.K. Lines
- Golar LNG
- BW LNG
- Technip Energies
- Bechtel Corporation
- Fluor Corporation
- KBR Inc.
Additional Benefits:
- The market estimate (ME) sheet in Excel format
- 3 months of analyst support
TABLE OF CONTENTS
1 Introduction
- 1.1 Study Assumptions & Market Definition
- 1.2 Scope of the Study
2 Research Methodology
3 Executive Summary
4 Market Landscape
- 4.1 Market Overview
- 4.2 Market Drivers
- 4.2.1 Surge in Asia-Pacific Gas-to-Power Projects Seeking Midstream LNG Offtake Agreements
- 4.2.2 Rapid Uptake of LNG as Marine Bunker Fuel Following IMO-2020 Sulfur Cap in Europe
- 4.2.3 Permian Basin Associated Gas Output Unlocks Low-Cost Feed-gas for U.S. Gulf-Coast Export Terminals
- 4.2.4 Floating LNG Technology Unlocking Stranded Offshore Gas Fields in Africa
- 4.2.5 China's Coal-to-Gas Switching Policies for Industrial Boilers Driving Spot LNG Imports
- 4.2.6 Growing Demand from Energy-Intensive Data Centres for Firm Low-Carbon Supply in OECD Markets
- 4.3 Market Restraints
- 4.3.1 Prolonged FID Delays Owing to EPC-Cost Inflation & Module Fabrication Bottlenecks
- 4.3.2 Competitiveness of Renewable Hydrogen Eroding Long-Term LNG Contract Appetite in N.E. Asia
- 4.3.3 Regulatory Moratoria on New LNG Export Permits in U.S. & Canada
- 4.3.4 Geopolitical Risk at Key Chokepoints (Hormuz, Suez) Escalating LNG Shipping Insurance Costs
- 4.4 Supply-Chain Analysis
- 4.5 Regulatory Outlook
- 4.6 Technological Outlook
- 4.7 Porter's Five Forces
- 4.7.1 Bargaining Power of Suppliers
- 4.7.2 Bargaining Power of Buyers
- 4.7.3 Threat of New Entrants
- 4.7.4 Threat of Substitutes
- 4.7.5 Competitive Rivalry
5 Market Size & Growth Forecasts
- 5.1 By Infrastructure Type
- 5.1.1 LNG Liquefaction Plants [Onshore Liquefaction, Floating LNG (FLNG), Mid-Scale (1-5 mtpa), and Small-Scale (<1 mtpa)]
- 5.1.2 LNG Regasification Facilities [Onshore Import Terminals, and Floating Storage & Regasification Units (FSRU)]
- 5.1.3 LNG Shipping Fleet [LNG Carriers by Containment (Moss and Membrane), Carrier Size (Q-Max, Q-Flex and Standard), LNG Bunkering Vessels]
- 5.2 By End-Use Application
- 5.2.1 Power Generation
- 5.2.2 Industrial and Manufacturing
- 5.2.3 Residential and Commercial
- 5.2.4 Transportation (Marine Bunkering, Heavy-Duty Road Transport and Rail)
- 5.3 By Scale
- 5.3.1 Large-Scale (Above 5 mtpa)
- 5.3.2 Mid-Scale (1 to 5 mtpa)
- 5.3.3 Small-Scale (Below 1 mtpa)
- 5.4 By Location
- 5.4.1 Onshore
- 5.4.2 Offshore (FLNG and FSRU)
- 5.5 By Geography
- 5.5.1 North America
- 5.5.1.1 United States
- 5.5.1.2 Canada
- 5.5.1.3 Mexico
- 5.5.2 Europe
- 5.5.2.1 United Kingdom
- 5.5.2.2 Germany
- 5.5.2.3 France
- 5.5.2.4 Spain
- 5.5.2.5 Nordic Countries
- 5.5.2.6 Russia
- 5.5.2.7 Rest of Europe
- 5.5.3 Asia-Pacific
- 5.5.3.1 China
- 5.5.3.2 India
- 5.5.3.3 Japan
- 5.5.3.4 South Korea
- 5.5.3.5 ASEAN Countries
- 5.5.3.6 Australia
- 5.5.3.7 Rest of Asia-Pacific
- 5.5.4 South America
- 5.5.4.1 Brazil
- 5.5.4.2 Argentina
- 5.5.4.3 Colombia
- 5.5.4.4 Rest of South America
- 5.5.5 Middle East and Africa
- 5.5.5.1 United Arab Emirates
- 5.5.5.2 Saudi Arabia
- 5.5.5.3 Qatar
- 5.5.5.4 South Africa
- 5.5.5.5 Egypt
- 5.5.5.6 Rest of Middle East and Africa
- 5.5.1 North America
6 Competitive Landscape
- 6.1 Market Concentration
- 6.2 Strategic Moves (M&A, Partnerships, PPAs)
- 6.3 Market Share Analysis (Market Rank/Share for key companies)
- 6.4 Company Profiles (includes Global level Overview, Market level overview, Core Segments, Financials as available, Strategic Information, Products & Services, and Recent Developments)
- 6.4.1 QatarEnergy LNG (Qatargas)
- 6.4.2 Shell plc
- 6.4.3 Cheniere Energy Inc.
- 6.4.4 TotalEnergies SE
- 6.4.5 Petronas
- 6.4.6 Novatek
- 6.4.7 Chevron Corporation
- 6.4.8 Exxon Mobil Corporation
- 6.4.9 Woodside Energy Group
- 6.4.10 Equinor ASA
- 6.4.11 Sempra Infrastructure
- 6.4.12 Venture Global LNG
- 6.4.13 ENI SpA
- 6.4.14 KOGAS
- 6.4.15 Mitsui O.S.K. Lines
- 6.4.16 Golar LNG
- 6.4.17 BW LNG
- 6.4.18 Technip Energies
- 6.4.19 Bechtel Corporation
- 6.4.20 Fluor Corporation
- 6.4.21 KBR Inc.
7 Market Opportunities & Future Outlook
- 7.1 White-Space & Unmet-Need Assessment
 2026年全球液化天然气(LNG)基础设施市场报告
 按类型、流量、压力范围、材料和最终用户分類的撬装式气体减压装置市场,全球预测,2026-2032年液态氧甲烷引擎市场按应用、推进循环、推力等级、最终用户和製造流程划分,全球预测,2026-2032年
 液化天然气一体化加气站市场规模、份额和成长分析:按产品类型、应用、最终用户、分销模式和地区划分-2026-2033年产业预测
 全球液化天然气发动机市场规模、份额、趋势和成长分析报告(2026-2034年)2026年全球液化天然气压缩机市场报告2026年全球液化天然气市场报告2026年全球工业液化天然气汽化设备市场报告
 液化天然气发动机市场-全球产业规模、份额、趋势、机会及按类型、最终用途、地区和竞争格局分類的预测(2021-2031年)车辆用液化天然气市场-全球产业规模、份额、趋势、机会和预测:按车辆类型、终端用户产业、液化天然气储存和基础设施、地区和竞争格局划分,2021-2031年