


 |
市场调查报告书
商品编码
1851591
工业空气压缩机:市场份额分析、行业趋势、统计数据和成长预测(2025-2030 年)Industrial Air Compressors - Market Share Analysis, Industry Trends & Statistics, Growth Forecasts (2025 - 2030) |
||||||
※ 本网页内容可能与最新版本有所差异。详细情况请与我们联繫。
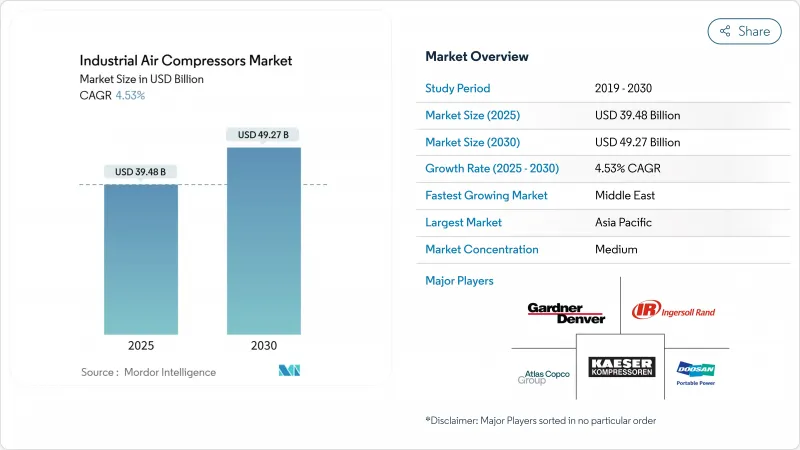
工业空气压缩机市场规模预计到 2025 年将达到 394.8 亿美元,预计到 2030 年将达到 492.7 亿美元,年复合成长率为 4.53%。
节能生产线的投资不断增加、液化天然气基础设施的快速发展以及日益严格的污染标准,正在改变各主要终端用户产业的消费偏好。随着工厂营运商在排放要求和整体拥有成本目标之间寻求平衡,变速技术、无油架构和物联网监控平台正日益受到青睐。亚太地区的成长势头依然强劲,中东地区则受惠于大型天然气计划的快速发展。同时,欧洲原材料价格的波动和日益严格的排放法规正在挤压净利率并延长投资回收期,促使企业重新设计产品以减少钢材用量并提升声学性能。工业空气压缩机市场透过产品创新与脱碳政策和工业布局的转变,持续展现强大的韧性。
全球工业空气压缩机市场趋势与洞察
在亚洲扩建节能型製造设施
2024年第四季度,台湾半导体产业的蓬勃发展推动固定资产支出成长了69%,电子工厂纷纷采用0级无油系统以防止污染。变频驱动器可降低高达35%的能耗,如今已成为所有新生产线的基础。跨国公司在中国和印度扩大机器人和积层製造规模,也反映了这一趋势,从而支撑了工业空气压缩机市场的长期销售成长。
食品饮料加工产业对无油压缩机的需求不断增长
ISO 8573-1 0级标准已从最佳实践转变为许多地区的监管要求,推动加工商采用无油螺桿和涡旋蜗桿。日立全球航空动力公司的DS280-450 kW产品满足了对高功率无油解决方案的需求。减少维护和避免润滑油浪费抵消了较高的领先成本,从而促进了其在已开发市场的普及。
钢材价格波动推高压缩机物料清单成本结构
钢材成本占压缩机製造成本的50%之多,因此价格上涨会使原始设备製造商(OEM)的利润率面临波动风险。由于能源成本影响钢材投入,欧洲製造商已在2024年多次调高产品标价。降低钢板厚度和改用复合材料的设计措施备受讚誉,但高昂的认证门槛阻碍了这些措施的推广应用。
细分市场分析
到2024年,容积式压缩机技术将占据工业空气压缩机市场的76%份额,这反映了其在从一般製造业到采矿业等各行业的广泛应用。旋转式螺桿式压缩机在效率和维护需求之间取得了良好的平衡,因此市场需求稳定。动态离心式压缩机虽然目前销售仍较低,但由于液化天然气工厂和钢铁厂需要高流量和稳定的压力,其年复合成长率正以6.8%的速度成长。
受能源效率法规的推动,工业空气压缩机离心机组的市场规模预计将在2025年至2030年间增加28亿美元。物联网控制器和预测分析技术正被应用于这两种技术中,以减少非计划性停机时间。阿特拉斯·科普柯等原始设备製造商(OEM)目前正将Optimizer 4.0模组整合到其压缩机组中,用于追踪负载曲线并推荐节能模式。
到2024年,含油式压缩机仍将维持成本主导,市占率将达到63%,而随着製药和食品业对污染容忍度的日益严格,无油式压缩机系统将以6.4%的复合年增长率快速成长。受生命週期维护成本降低和废弃物减少的推动,无油螺桿式工业空气压缩机市场预计到2030年将超过140亿美元。
新型两级干式螺桿与先前的型号相比,能耗降低了13.5%,提高了投资报酬率。 0级认证正在影响采购决策,饮料装瓶商通常会在竞标文件中明确列出认证。
区域分析
到2024年,亚太地区将占全球销售额的42%,这主要得益于中国自动化程度的快速提升以及印度生产关联激励计划(PLI)鼓励企业自行生产空气。工厂营运商倾向于选择配备能源回收模组的整合式空气站,这一趋势正在重塑资本设备竞标。本地组装与跨国原始设备製造商(OEM)达成技术许可合作,进一步扩大了工业空气压缩机市场。
北美受惠于製造业回流和美国能源部能源效率法规,推动了传统固定速度车辆的淘汰。美国墨西哥湾沿岸的液化天然气出口终端订购了数兆瓦级离心式管道,巩固了该地区在高压应用领域的优势。加拿大则专注于低碳氢化合物计划,增加了无油螺旋输送机的数量。
中东地区复合年增长率最高,达5.8%,主要受天然气储存、石化产品多元化以及大型炼油厂升级改造的推动。儘管原物料价格上涨带来成本压力,但由于终端用户优先考虑噪音合规和碳减排,欧洲的需求仍保持稳定。拉丁美洲和非洲的需求则受到采矿和基础设施建设週期的影响,呈现暂时性波动,租赁设备填补了计划缺口,扩大了工业空气压缩机的市场规模。
其他福利:
- Excel格式的市场预测(ME)表
- 3个月的分析师支持
目录
第一章 引言
- 研究假设和市场定义
- 调查范围
第二章调查方法
第三章执行摘要
第四章 市场情势
- 市场概览
- 市场驱动因素
- 在亚洲扩建节能型製造设施
- 食品饮料加工产业对无油压缩机的需求不断增长
- 对液化天然气基础设施投资的快速成长,需要高压压缩机
- 政府对工业能源审核的激励措施有利于变速压缩机
- 采用干式螺桿压缩机的电动车电池超级工厂快速成长
- 中东地区石化厂棕地维修计画日益增多
- 市场限制
- 钢材价格波动推高压缩机物料清单成本结构
- 与低压应用中的鼓风机替代方案相比,投资回收期更长
- 欧洲更严格的噪音排放法规推高了隔音罩的成本
- 新兴市场熟练维修人员短缺导致停机时间增加
- 价值/供应链分析
- 监管或技术环境
- 投资分析
- 关键案例和实施场景
- 波特五力分析
- 供应商的议价能力
- 买方的议价能力
- 新进入者的威胁
- 替代品的威胁
- 竞争对手之间的竞争
第五章 市场规模与成长预测
- 按压缩机类型
- 正位移
- 旋转螺桿
- 往復式(活塞式)
- 捲动
- 动态的
- 离心式
- 轴
- 正位移
- 润滑剂
- 石油泛光
- 无油
- 按额定压力
- 0~20bar
- 21~100bar
- 超过100巴
- 驱动器/电源独立
- 电
- 柴油引擎
- 气体
- 额定功率
- 100千瓦或以下
- 101~500 kW
- 超过500千瓦
- 按最终用途行业划分
- 製造业
- 一般製造业
- 金属和采矿
- 电子与半导体
- 石油和天然气
- 上游
- 中游(管道/液化天然气)
- 下游(纯化)
- 发电业务
- 化工/石油化工
- 饮食
- 製药
- 建造
- 其他(医疗保健、纺织)
- 製造业
- 按地区
- 北美洲
- 美国
- 加拿大
- 墨西哥
- 南美洲
- 巴西
- 阿根廷
- 南美洲其他地区
- 欧洲
- 德国
- 英国
- 法国
- 义大利
- 西班牙
- 北欧国家
- 其他欧洲地区
- 中东和非洲
- 阿拉伯聯合大公国
- 沙乌地阿拉伯
- 南非
- 其他中东和非洲地区
- 亚太地区
- 中国
- 印度
- 日本
- 韩国
- 澳洲
- 亚太其他地区
- 北美洲
第六章 竞争情势
- 市场集中度
- 策略趋势
- 市占率分析
- 公司简介
- Atlas Copco AB
- Ingersoll Rand Inc.
- Kaeser Kompressoren SE
- Sullair LLC(Hitachi Group)
- Gardner Denver Holdings Inc.
- Siemens Energy AG
- Bauer Kompressoren GmbH
- Doosan Portable Power
- ELGi Equipments Ltd.
- Quincy Compressor LLC
- Fusheng Industrial Co. Ltd.
- Kobe Steel Ltd.
- Hanwha Power Systems
- Boge Kompressoren Otto Boge GmbH & Co. KG
- Aerzen Maschinenfabrik GmbH
- CompAir(UK)Ltd.
- Chicago Pneumatic
- VMAC Global Technology Inc.
- Shanghai Screw Compressor Co. Ltd.
- Kobelco KNW(Industrial Air Compressors)
第七章 市场机会与未来展望
The Industrial Air Compressors market size is estimated at USD 39.48 billion in 2025 and is forecast to reach USD 49.27 billion by 2030, advancing at a 4.53% CAGR.
Rising investments in energy-efficient production lines, rapid LNG infrastructure build-outs and stricter contamination standards are reshaping product preferences in every major end-use sector. Variable-speed technology, oil-free architectures and IoT-enabled monitoring platforms are gaining traction as plant operators balance emission mandates with total cost-of-ownership goals. Regional momentum remains strongest in Asia-Pacific, while the Middle East delivers the fastest growth on the back of large-scale gas projects. At the same time, raw-material price volatility and tighter European noise rules are compressing margins and extending payback periods, prompting redesigns that lower steel content and improve acoustic performance. The Industrial Air Compressors market continues to demonstrate resilience by aligning product innovation with decarbonization policies and shifting industrial footprints.
Global Industrial Air Compressors Market Trends and Insights
Expansion of Energy-Efficient Manufacturing Facilities in Asia
The semiconductor boom lifted Taiwan's fixed-asset spending by 69% in Q4 2024, with electronics plants adopting Class 0 oil-free systems to guard against contamination. Variable-speed drives that trim energy use up to 35% are now baseline specifications across new lines. Multinationals scaling robotics and additive manufacturing in China and India mirror this focus, anchoring long-term volume for the Industrial Air Compressors market.
Rising Demand for Oil-Free Compressors in Food & Beverage Processing
ISO 8573-1 Class 0 has moved from best practice to regulatory requirement in many jurisdictions, pushing processors toward oil-free screws and scrolls. Hitachi Global Air Power's DS280-450 kW launch addresses requests for higher-power oil-free options. Lower maintenance and avoided lubricant disposal are offsetting the upfront premium, reinforcing adoption across developed markets.
Volatile Steel Prices Inflating Compressor BOM Cost Structures
Steel accounts for up to 50% of compressor production cost, exposing OEMs to margin swings when prices spike. European makers implemented multiple list-price rises in 2024 as energy costs fed into steel inputs. Design efforts to cut plate thickness and switch to composites are under evaluation, yet certification hurdles delay widespread relief.
Other drivers and restraints analyzed in the detailed report include:
- Surging Investments in LNG Infrastructure Requiring High-Pressure Compressors
- Government Incentives for Industrial Energy Audits Favoring Variable-Speed Compressors
- Stringent Noise Emission Norms Escalating Enclosure Costs in Europe
For complete list of drivers and restraints, kindly check the Table Of Contents.
Segment Analysis
Positive displacement technology held 76% of the Industrial Air Compressors market share in 2024, reflecting its versatility from general manufacturing to mining. Demand remains stable as rotary screw units balance efficiency and maintenance needs. Dynamic centrifugal compressors, although smaller in volume, are expanding at a 6.8% CAGR as LNG plants and steel mills seek higher flow at consistent pressure.
The Industrial Air Compressors market size for centrifugal units is projected to increase by USD 2.8 billion between 2025 and 2030, supported by energy-efficiency mandates. IoT-enabled controllers and predictive analytics are being embedded across both technologies to lower unplanned downtime. OEMs such as Atlas Copco now bundle Optimizer 4.0 modules with compressor packages to track load profiles and recommend energy-saving modes.
Oil-flooded designs retained cost leadership and 63% share in 2024, yet oil-free systems are advancing at 6.4% CAGR as contamination tolerance narrows in pharmaceuticals and food. The Industrial Air Compressors market size for oil-free screws is on course to climb beyond USD 14 billion by 2030, aided by lower lifecycle maintenance and disposal savings.
Newer two-stage dry screws trim energy use as much as 13.5% versus prior models, improving payback windows. Class 0 certification marketing is influencing purchasing decisions, and beverage bottlers often specify it outright in bid documents.
The Industrial Air Compressor Market Report is Segmented by Compressor Type (Positive Displacement and More), Lubrication (Oil-Flooded, Oil-Free), Pressure Rating (0-20 Bar, 21-100 Bar, Above 100 Bar), Driver/Power Source (Electric and More), Power Rating (>500 KW and More), End-Use Industry (Manufacturing and More), Geography. The Market Forecasts are Provided in Terms of Value (USD).
Geography Analysis
Asia-Pacific contributed 42% of global revenue in 2024, anchored by China's automation surge and India's PLI inducements that encourage in-house air generation. Plant operators favor integrated air stations with energy-recovery modules, a trend reshaping capital-equipment bids. Local assemblers partner with multinational OEMs for technology licensing, further expanding the Industrial Air Compressors market.
North America benefits from reshoring and DOE efficiency rules that spur replacement of legacy fixed-speed fleets. LNG export terminals along the U.S. Gulf Coast order multi-megawatt centrifugal lines, reinforcing regional dominance in high-pressure applications. Canada's focus on low-carbon hydrogen projects adds incremental volume for oil-free screw packages.
The Middle East registers the fastest 5.8% CAGR, driven by gas storage, petrochemical diversification and mega-refinery upgrades. Europe maintains steady demand as end-users prioritize noise compliance and carbon reduction, despite cost pressures from material inflation. Latin America and Africa offer episodic demand tied to mining and infrastructure cycles, with rental fleets bridging project gaps and enlarging the Industrial Air Compressors market footprint.
- Atlas Copco AB
- Ingersoll Rand Inc.
- Kaeser Kompressoren SE
- Sullair LLC (Hitachi Group)
- Gardner Denver Holdings Inc.
- Siemens Energy AG
- Bauer Kompressoren GmbH
- Doosan Portable Power
- ELGi Equipments Ltd.
- Quincy Compressor LLC
- Fusheng Industrial Co. Ltd.
- Kobe Steel Ltd.
- Hanwha Power Systems
- Boge Kompressoren Otto Boge GmbH & Co. KG
- Aerzen Maschinenfabrik GmbH
- CompAir (UK) Ltd.
- Chicago Pneumatic
- VMAC Global Technology Inc.
- Shanghai Screw Compressor Co. Ltd.
- Kobelco KNW (Industrial Air Compressors)
Additional Benefits:
- The market estimate (ME) sheet in Excel format
- 3 months of analyst support
TABLE OF CONTENTS
1 INTRODUCTION
- 1.1 Study Assumptions and Market Definition
- 1.2 Scope of the Study
2 RESEARCH METHODOLOGY
3 EXECUTIVE SUMMARY
4 MARKET LANDSCAPE
- 4.1 Market Overview
- 4.2 Market Drivers
- 4.2.1 Expansion of Energy-Efficient Manufacturing Facilities in Asia
- 4.2.2 Rising Demand for Oil-Free Compressors in Food and Beverage Processing
- 4.2.3 Surging Investments in LNG Infrastructure Requiring High-Pressure Compressors
- 4.2.4 Government Incentives for Industrial Energy Audits Favoring Variable-Speed Compressors
- 4.2.5 Rapid Growth of EV Battery Gigafactories Utilizing Dry Screw Compressors
- 4.2.6 Uptick in Brownfield Revamps of Petrochemical Plants in Middle East
- 4.3 Market Restraints
- 4.3.1 Volatile Steel Prices Inflating Compressor BOM Cost Structures
- 4.3.2 Longer Payback Period Versus Blower Alternatives for Low-Pressure Applications
- 4.3.3 Stringent Noise Emission Norms Escalating Enclosure Costs in Europe
- 4.3.4 Skilled Maintenance Labor Shortages Increasing Downtime in Emerging Markets
- 4.4 Value / Supply-Chain Analysis
- 4.5 Regulatory or Technological Outlook
- 4.6 Investment Analysis
- 4.7 Key Case Studies and Implementation Scenarios
- 4.8 Porter's Five Forces Analysis
- 4.8.1 Bargaining Power of Suppliers
- 4.8.2 Bargaining Power of Buyers
- 4.8.3 Threat of New Entrants
- 4.8.4 Threat of Substitutes
- 4.8.5 Intensity of Competitive Rivalry
5 MARKET SIZE AND GROWTH FORECASTS (VALUE)
- 5.1 By Compressor Type
- 5.1.1 Positive Displacement
- 5.1.1.1 Rotary Screw
- 5.1.1.2 Reciprocating (Piston)
- 5.1.1.3 Scroll
- 5.1.2 Dynamic
- 5.1.2.1 Centrifugal
- 5.1.2.2 Axial
- 5.1.1 Positive Displacement
- 5.2 By Lubrication
- 5.2.1 Oil-Flooded
- 5.2.2 Oil-Free
- 5.3 By Pressure Rating
- 5.3.1 0-20 bar
- 5.3.2 21-100 bar
- 5.3.3 Above 100 bar
- 5.4 By Driver/Power Source
- 5.4.1 Electric
- 5.4.2 Diesel
- 5.4.3 Gas
- 5.5 By Power Rating
- 5.5.1 <=100 kW
- 5.5.2 101-500 kW
- 5.5.3 >500 kW
- 5.6 By End-use Industry
- 5.6.1 Manufacturing
- 5.6.1.1 General Manufacturing
- 5.6.1.2 Metal & Mining
- 5.6.1.3 Electronics & Semiconductors
- 5.6.2 Oil and Gas
- 5.6.2.1 Upstream
- 5.6.2.2 Midstream (Pipeline/LNG)
- 5.6.2.3 Downstream (Refining)
- 5.6.3 Power Generation
- 5.6.4 Chemical and Petrochemical
- 5.6.5 Food and Beverage
- 5.6.6 Pharmaceutical
- 5.6.7 Construction
- 5.6.8 Others (Healthcare, Textiles)
- 5.6.1 Manufacturing
- 5.7 By Geography
- 5.7.1 North America
- 5.7.1.1 United States
- 5.7.1.2 Canada
- 5.7.1.3 Mexico
- 5.7.2 South America
- 5.7.2.1 Brazil
- 5.7.2.2 Argentina
- 5.7.2.3 Rest of South America
- 5.7.3 Europe
- 5.7.3.1 Germany
- 5.7.3.2 United Kingdom
- 5.7.3.3 France
- 5.7.3.4 Italy
- 5.7.3.5 Spain
- 5.7.3.6 Nordics
- 5.7.3.7 Rest of Europe
- 5.7.4 Middle East and Africa
- 5.7.4.1 United Arab Emirates
- 5.7.4.2 Saudi Arabia
- 5.7.4.3 South Africa
- 5.7.4.4 Rest of Middle East and Africa
- 5.7.5 Asia-Pacific
- 5.7.5.1 China
- 5.7.5.2 India
- 5.7.5.3 Japan
- 5.7.5.4 South Korea
- 5.7.5.5 Australia
- 5.7.5.6 Rest of Asia-Pacific
- 5.7.1 North America
6 COMPETITIVE LANDSCAPE
- 6.1 Market Concentration
- 6.2 Strategic Moves
- 6.3 Market Share Analysis
- 6.4 Company Profiles (includes Global level Overview, Market level overview, Core Segments, Financials as available, Strategic Information, Market Rank/Share for key companies, Products and Services, and Recent Developments)
- 6.4.1 Atlas Copco AB
- 6.4.2 Ingersoll Rand Inc.
- 6.4.3 Kaeser Kompressoren SE
- 6.4.4 Sullair LLC (Hitachi Group)
- 6.4.5 Gardner Denver Holdings Inc.
- 6.4.6 Siemens Energy AG
- 6.4.7 Bauer Kompressoren GmbH
- 6.4.8 Doosan Portable Power
- 6.4.9 ELGi Equipments Ltd.
- 6.4.10 Quincy Compressor LLC
- 6.4.11 Fusheng Industrial Co. Ltd.
- 6.4.12 Kobe Steel Ltd.
- 6.4.13 Hanwha Power Systems
- 6.4.14 Boge Kompressoren Otto Boge GmbH & Co. KG
- 6.4.15 Aerzen Maschinenfabrik GmbH
- 6.4.16 CompAir (UK) Ltd.
- 6.4.17 Chicago Pneumatic
- 6.4.18 VMAC Global Technology Inc.
- 6.4.19 Shanghai Screw Compressor Co. Ltd.
- 6.4.20 Kobelco KNW (Industrial Air Compressors)
7 MARKET OPPORTUNITIES AND FUTURE OUTLOOK
- 7.1 White-Space and Unmet-Need
 工业空气压缩机市场按产品、类型、类别、功率、冷却方式、通路和最终用户产业划分-全球预测,2025-2032年
 2025年全球工业空气压缩机市场报告
 工业空气压缩机市场-全球产业规模、份额、趋势、机会和预测(按产品、技术、应用、地区和竞争细分,2020-2030 年)
 工业空气压缩机市场规模、份额、成长分析(按产品类型、设计、压力、输出功率、密封类型、冷媒类型、最终用户产业、地区)- 产业预测 2025-2032
 全球工业空气压缩机市场评估:依产品类型、依设计、依冷剂类型、依压力、依最终用途行业、依地区、机会、预测,2017-2031年
 2024-2028年全球工业空气压缩机市场