


 |
市场调查报告书
商品编码
1851604
工业电池:市场份额分析、行业趋势、统计数据和成长预测(2025-2030 年)Industrial Battery - Market Share Analysis, Industry Trends & Statistics, Growth Forecasts (2025 - 2030) |
||||||
※ 本网页内容可能与最新版本有所差异。详细情况请与我们联繫。
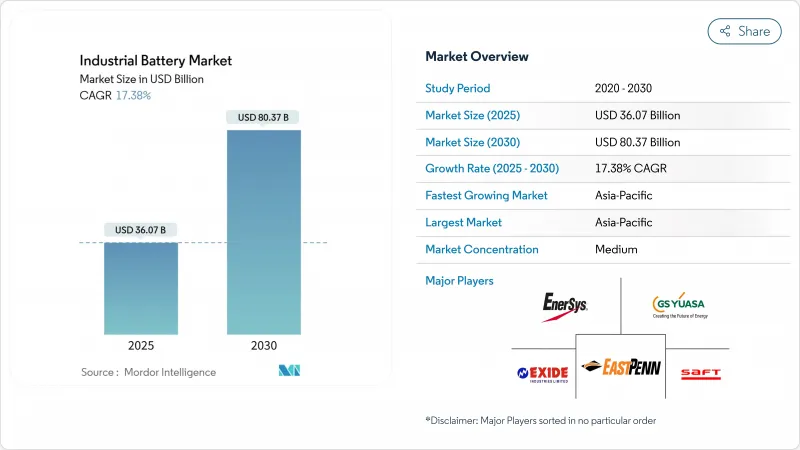
预计到 2025 年,工业电池市场规模将达到 360.7 亿美元,到 2030 年将达到 803.7 亿美元,在预测期(2025-2030 年)内,复合年增长率将达到 17.38%。
锂离子电池价格下跌、电网级储能计划扩展以及仓储自动化趋势的推动,使得电池成为能源转型议程中不可或缺的基础设施。美国和欧洲政策支持的加强正在刺激新的产能成长,而亚太地区则利用一体化供应链保持成本领先地位。产业整合正在加速,主要电池製造商正向上游原材料和下游系统整合领域转移,以保护净利率、抵消矿产价格波动并遵守日益严格的安全标准。同时,二手电池租赁模式、微电网部署以及钠离子电池的兴起,正在拓展电池的应用范围,并支撑工业电池市场的长期需求。
全球工业电池市场趋势与洞察
锂离子电池成本曲线呈下降趋势
2010年至2024年间,锂离子电池组的平均价格下降了89%,至139美元/度。预计全球标示容量将从2020年的95吉瓦时增长到2024年的1200吉瓦时以上,这将推动规模经济效益的实现,并提高中国工厂使用率。 LG能源解决方案公司位于亚利桑那州的工厂计画从2025年开始,年产量增加43吉瓦时,生产成本比北美平均低25%。价格下降将扩大装机量,使资本投资转向营运支出,并推动电池即服务模式的发展,从而降低客户的部署风险。这种价格下降和产量成长的良性循环有望巩固锂离子电池在工业电池市场的领先地位,同时为本世纪末钠离子电池和固态电池的大规模应用铺平道路。
利用可再生能源建设储能係统
随着可再生能源渗透率超过30%,到2024年,全球电网级电池储能装置容量将达到15吉瓦,因为公用事业公司正在整合电池储能以稳定电网。光是加州就正在快速开发价值4.6吉瓦时的计划,而昆士兰州正在调试多个300-500兆瓦时的储能係统,以支持其50%的可再生能源目标。除了公用事业公司之外,工业微电网还将屋顶光电发电与现场电池结合,以降低需求费用并确保电力连续性。成本下降、模组化架构和简化的采购框架使电池成为频率调节和容量供应成本最低的解决方案,为工业电池市场提供了结构性利好因素。
关键矿产价格波动
碳酸锂价格在2020年至2022年间飙升1000%,随后在2024年回落80%,扰乱了筹资策略和利润规划。由于刚果民主共和国和印尼的地缘政治紧张局势和出口限制,钴和镍的价格也出现了类似的波动。由于矿物成本占锂离子电池系统成本的50%之多,价格波动会导致总拥有成本预测显着波动。儘管製造商正透过签订多年承购协议、实现原料多元化和开展回收计划来规避风险,但规模较小的公司却面临资产负债表的压力。钠离子电池和铁基电池的发展趋势正在形成相互抵消的趋势,使这些技术能够缓衝价格衝击,并缓解工业电池市场的波动。
细分市场分析
到2024年,锂离子电池将占据工业电池市场51%的份额,这主要得益于其十年来成本下降89%以及卓越的往返效率。预计到2030年,该产业将以18%的复合年增长率成长,因为磷酸铁锂电池在6000次循环后容量保持率可达95%,使其生命週期拥有成本低于每千瓦时0.08美元。钠离子电池将随着宁德时代(CATL)2024年的推出而实现商业化规模,材料成本降低30%,使其在固定式储能领域更具竞争力。液流电池正在需要放电时间超过8小时的应用领域站稳脚跟。中国一座100兆瓦/400兆瓦时的钒液流电池电厂已展现出20年的使用寿命。镍镉电池和镍氢电池则服务于严苛环境,尤其是在偏远油田,这些地区必须在-40°C至70°C的温度范围内运作。从 2027 年开始试生产能量密度提高 50% 的固态原型电池,全球汽车製造商将合作支援生产线的认证。
预计锂离子工业电池市场规模将从2025年的184亿美元成长到2030年的476亿美元。持续的规模扩张将降低每吉瓦时的资本密集度,促进垂直整合,并拉大与传统电池的性能差距。同时,高锰正极、硅负极和高压电解液的创新将进一步降低单位成本,提升锂离子电池的价值提案。供应商正在投资建造毗邻超级工厂的回收中心,以回收钴、镍和锂,从而满足欧盟新监管规则对循环经济的要求。这些因素的综合作用将巩固锂离子电池的领先地位,同时明确其他互补电池技术的角色,确保工业电池市场的技术多样性。
工业电池市场报告按技术(锂离子、铅酸、镍基、其他)、应用(堆高机和动力、电讯备用、UPS/数据中心、电网级储能係统、其他)、终端用户行业(电力和公用事业、石油和天然气、製造和仓储、电讯、其他)以及地区(北美、欧洲、亚太、南美、中东和非洲)进行细分。
区域分析
预计到2024年,亚太地区将维持50%的收入份额,这主要得益于成本效益高的超级工厂、政府奖励以及垂直整合的供应链。中国占该地区产能的三分之二,单家工厂的年产能就超过40吉瓦时。日本卓越的材料科学和韩国的高端电芯技术共同建构了一个强大的生态系统,使得该地区的电池价格比西方基准价格低15-20%。受国内可再生能源目标、出口导向製造业以及与固定式储能共用通用供应链的电动车基础设施快速发展的推动,亚太地区工业电池市场规模预计将以19.45%的复合年增长率成长。
北美是2030年成长最快的发达地区之一,这主要得益于《通膨降低法案》的激励措施、以国防为导向的供应链重组以及丰富的可再生资源。 2022年至2025年间,已宣布的投资额将超过1,000亿美元,其中以LG能源解决方案公司在亚利桑那州投资55亿美元的工厂和特斯拉在德克萨斯投资2亿美元的工厂最为突出。联邦贷款担保和生产税额扣抵降低了资金门槛,而加快的州级审批流程则缩短了计划週期。
欧洲正透过绿色新政」产业计画和欧洲电池联盟追求战略自主,但高昂的能源成本和复杂的授权阻碍了建设进程。德国、瑞典和匈牙利已承接了大部分计划,而挪威和芬兰则利用低碳电力吸引阳极和阴极加工。中东和非洲是新兴但充满潜力的市场,离网太阳能光电发电和电池储能正在取代柴油发电机。南非的再生能源独立电力生产商采购计划(REIPPP)和阿联酋的智慧城市计划正在推动早期应用。拉丁美洲的锂三角正在刺激下游投资,并将该地区打造为工业电池市场的资源中心和未来製造地。
其他福利:
- Excel格式的市场预测(ME)表
- 3个月的分析师支持
目录
第一章 引言
- 研究假设和市场定义
- 调查范围
第二章调查方法
第三章执行摘要
第四章 市场情势
- 市场概览
- 市场驱动因素
- 锂离子电池成本曲线呈下降趋势
- 利用可再生能源建设储能係统
- 仓库自动化与AGV的快速崛起
- 资料中心直流微电网
- 维护通讯塔的义务
- 原始设备製造商主导的二手车租赁模式
- 市场限制
- 关键矿产价格波动
- 铅酸蓄电池污染法规
- 固体技术的「观望」效应
- BESS火灾风险保险成本上升
- 电池/原物料价格趋势及预测
- 进出口分析
- 供应链分析
- 监管环境
- 技术展望
- 波特五力模型
- 供应商的议价能力
- 买方的议价能力
- 新进入者的威胁
- 替代品的威胁
- 竞争对手之间的竞争
第五章 市场规模与成长预测
- 透过技术
- 锂离子
- 铅酸电池
- 镍基
- 其他(包括液流电池和钠离子电池)
- 透过使用
- 堆高机和动力
- 电信备份
- UPS/资料中心
- 网格尺度ESS
- 其他(包括自动导引运输车、铁路和海运)
- 按最终用户行业划分
- 电力/公共产业
- 石油和天然气
- 製造和仓储业
- 电信
- 其他(包括运输和物流)
- 按地区
- 北美洲
- 美国
- 加拿大
- 墨西哥
- 欧洲
- 德国
- 法国
- 英国
- 义大利
- 西班牙
- 北欧国家
- 俄罗斯
- 其他欧洲地区
- 亚太地区
- 中国
- 日本
- 印度
- 韩国
- 东南亚国协
- 亚太其他地区
- 南美洲
- 巴西
- 阿根廷
- 其他南美洲
- 中东和非洲
- 阿拉伯聯合大公国
- 沙乌地阿拉伯
- 南非
- 其他中东和非洲地区
- 北美洲
第六章 竞争情势
- 市场集中度
- 策略性倡议(併购、伙伴关係、购电协议)
- 市场占有率分析(主要企业的市场排名/份额)
- 公司简介
- EnerSys
- East Penn Manufacturing
- Exide Industries
- GS Yuasa Corp.
- Saft Groupe SA
- Amara Raja Batteries
- Panasonic Energy
- CATL
- BYD Co. Ltd.
- LG Energy Solution
- Samsung SDI
- Johnson Controls
- Leoch Int'l
- JYC Battery
- Narada Power
- Crown Battery
- Hoppecke Batteries
- NorthStar Battery
- Trojan Battery
- Vision Group
第七章 市场机会与未来展望
The Industrial Battery Market size is estimated at USD 36.07 billion in 2025, and is expected to reach USD 80.37 billion by 2030, at a CAGR of 17.38% during the forecast period (2025-2030).
Falling lithium-ion prices, expanding grid-scale storage projects, and the march toward warehouse automation position batteries as indispensable infrastructure for energy-transition agendas. Heightened policy support in the United States and Europe spurs fresh manufacturing capacity, while Asia-Pacific leverages integrated supply chains to keep cost leadership. Consolidation is gathering speed as leading cell makers move upstream into raw materials and downstream into systems integration to secure margins, offset mineral price volatility, and comply with tightening safety standards. At the same time, second-life leasing models, micro-grid deployments, and the rise of sodium-ion alternatives are widening the addressable pool of applications and anchoring long-term demand for the industrial battery market.
Global Industrial Battery Market Trends and Insights
Declining Lithium-Ion Battery Cost Curve
Average lithium-ion pack prices fell 89% between 2010 and 2024 to USD 139 /kWh and are trending toward the USD 100 /kWh tipping point that unlocks mass industrial adoption. Global nameplate capacity rose from 95 GWh in 2020 to more than 1,200 GWh in 2024, driving scale economies and higher factory utilization in China. LG Energy Solution's Arizona complex will add 43 GWh of annual output from 2025, targeting production costs 25% below prevailing North American averages. Lower prices widen the installed base, enabling battery-as-a-service models that shift capex to opex and reduce customer adoption risk. The virtuous loop of falling prices and rising volumes is expected to solidify lithium-ion's leadership within the industrial battery market while paving the way for high-volume sodium-ion and solid-state introductions later in the decade.
Renewable-Powered ESS Build-Outs
Global grid-scale battery additions reached 15 GW in 2024, as utilities integrate storage to stabilize networks with renewable penetration above 30%. California alone fast-tracked 4.6 GWh worth of projects, while Queensland commissioned multiple 300-500 MWh systems to back its 50% renewables target. Beyond the utility domain, industrial micro-grids pair rooftop solar with on-site batteries to shave demand charges and guarantee power continuity. Cost declines, modular architectures, and streamlined procurement frameworks make batteries the least-cost solution for frequency control and capacity reserves, yielding a structural tailwind for the industrial battery market.
Critical-Mineral Price Volatility
Lithium carbonate prices spiked 1,000% from 2020-2022 before sliding 80% in 2024, disrupting procurement strategies and margin planning. Cobalt and nickel exhibit similar gyrations driven by geopolitical tensions and export restrictions in the Democratic Republic of Congo and Indonesia. Minerals account for up to 50% of lithium-ion system cost; volatility, therefore, translates into wide swings in projected total cost of ownership. Manufacturers hedge through multi-year offtake agreements, diversified feedstock, and recycling programs, but smaller players face balance-sheet pressure. Prospectors of sodium-ion and iron-based chemistries position their technologies as buffers against price shocks, creating a countervailing trend that tempers volatility risk for the industrial battery market.
Other drivers and restraints analyzed in the detailed report include:
- Warehouse Automation & AGVs Surge
- DC Micro-Grids in Data Centres
- Lead-Acid Pollution Regulations
For complete list of drivers and restraints, kindly check the Table Of Contents.
Segment Analysis
Lithium-ion captured 51% of the industrial battery market share in 2024, underpinned by an 89% decade-long cost plunge and superior round-trip efficiency. The segment is projected to expand at an 18% CAGR to 2030 as LFP formulations deliver 95% capacity retention after 6,000 cycles, pushing the lifetime cost of ownership below USD 0.08 per kWh delivered. Sodium-ion enters commercial scale via CATL's 2024 launch, offering 30% lower material costs and competitive performance for stationary storage. Flow batteries hold a foothold in applications requiring more than eight-hour discharge; a 100 MW/400 MWh vanadium redox plant in China illustrates bankable 20-year lifespans. Nickel-cadmium and nickel-metal hydride supply harsh-environment niches where -40 °C to 70 °C operation is essential, notably in remote oilfields. Solid-state prototypes promising 50% higher energy density line up for pilot production after 2027, with global automakers backing production qualification lines jointly.
The industrial battery market size for lithium-ion systems is forecast to climb from USD 18.4 billion in 2025 to USD 47.6 billion by 2030. Continuous scale-up dampens capital intensity per GWh, encourages vertical integration, and widens the performance gap with legacy chemistries. Simultaneously, innovation on high-manganese cathodes, silicon anodes, and high-voltage electrolytes intends to further trim unit costs and sharpen lithium-ion's value proposition. Suppliers invest in Gigafactory-adjacent recycling hubs to harvest cobalt, nickel, and lithium, underpinning circular-economy credentials required under new EU stewardship rules. The combined effect cements lithium-ion's leadership while allowing complementary chemistries to secure clearly defined roles, ensuring technology diversity within the industrial battery market.
The Industrial Battery Market Report is Segmented by Technology (Lithium-Ion, Lead-Acid, Nickel-Based, and Others), Application (Forklift and Motive Power, Telecom Backup, UPS/Data Centres, Grid-Scale ESS, and Others), End-User Industry (Power and Utilities, Oil and Gas, Manufacturing and Warehousing, Telecom, and Others), and Geography (North America, Europe, Asia-Pacific, South America, and Middle East and Africa).
Geography Analysis
Asia-Pacific retained a 50% revenue share in 2024, driven by cost-efficient giga-scale factories, government incentives, and vertically integrated supply chains. China accounts for two-thirds of regional capacity, with single plants exceeding 40 GWh annually. Japan's material science prowess and South Korea's premium cell expertise reveal a robust ecosystem that keeps regional prices 15-20% below Western benchmarks. Asia-Pacific's industrial battery market size is set to climb at a 19.45% CAGR, fueled by domestic renewables targets, export-oriented manufacturing, and accelerating electric-vehicle infrastructure that shares common supply chains with stationary storage.
North America is one of the fastest-growing developed regions, through 2030, due to the Inflation Reduction Act incentives, defense-oriented supply-chain reshoring, and abundant renewable resources. Between 2022-2025, announced investments exceed USD 100 billion, led by LG Energy Solution's USD 5.5 billion Arizona plant and Tesla's USD 200 million megafactory in Texas. Federal loan guarantees and production tax credits lower capital hurdles, while state-level fast-track permits compress project timelines.
Europe pursues strategic autonomy via the Green Deal Industrial Plan and European Battery Alliance, yet high energy costs and permitting complexity slow build-out. Germany, Sweden, and Hungary host most projects; Norway and Finland leverage low-carbon power to attract anode and cathode processing. The Middle East and Africa represent nascent but promising markets as off-grid solar plus storage displaces diesel generators; South Africa's REIPPP programme and the UAE's smart-city ambitions drive early adoption. Latin America's lithium triangle stimulates downstream investment discussions, positioning the region as a resource hub and a future manufacturing base for the industrial battery market.
- EnerSys
- East Penn Manufacturing
- Exide Industries
- GS Yuasa Corp.
- Saft Groupe SA
- Amara Raja Batteries
- Panasonic Energy
- CATL
- BYD Co. Ltd.
- LG Energy Solution
- Samsung SDI
- Johnson Controls
- Leoch Int'l
- JYC Battery
- Narada Power
- Crown Battery
- Hoppecke Batteries
- NorthStar Battery
- Trojan Battery
- Vision Group
Additional Benefits:
- The market estimate (ME) sheet in Excel format
- 3 months of analyst support
TABLE OF CONTENTS
1 Introduction
- 1.1 Study Assumptions & Market Definition
- 1.2 Scope of the Study
2 Research Methodology
3 Executive Summary
4 Market Landscape
- 4.1 Market Overview
- 4.2 Market Drivers
- 4.2.1 Declining lithium-ion battery cost curve
- 4.2.2 Renewable-powered ESS build-outs
- 4.2.3 Warehouse automation & AGVs surge
- 4.2.4 DC micro-grids in data centres
- 4.2.5 Telecom tower storage mandates
- 4.2.6 OEM-driven 2nd-life leasing models
- 4.3 Market Restraints
- 4.3.1 Critical-mineral price volatility
- 4.3.2 Lead-acid pollution regulations
- 4.3.3 Solid-state tech "wait-and-see" effect
- 4.3.4 Rising BESS fire-risk insurance costs
- 4.4 Battery/Raw-Material Price Trends & Forecast
- 4.5 Import and Export Analysis
- 4.6 Supply-Chain Analysis
- 4.7 Regulatory Landscape
- 4.8 Technological Outlook
- 4.9 Porter's Five Forces
- 4.9.1 Bargaining Power of Suppliers
- 4.9.2 Bargaining Power of Buyers
- 4.9.3 Threat of New Entrants
- 4.9.4 Threat of Substitutes
- 4.9.5 Competitive Rivalry
5 Market Size & Growth Forecasts
- 5.1 By Technology
- 5.1.1 Lithium-ion
- 5.1.2 Lead-acid
- 5.1.3 Nickel-based
- 5.1.4 Others (incl. Flow Battery, Sodium-ion)
- 5.2 By Application
- 5.2.1 Forklift and Motive Power
- 5.2.2 Telecom Backup
- 5.2.3 UPS/Data Centres
- 5.2.4 Grid-Scale ESS
- 5.2.5 Others (incl Automated Guided Vehicles, Rail and Marine)
- 5.3 By End-User Industry
- 5.3.1 Power and Utilities
- 5.3.2 Oil and Gas
- 5.3.3 Manufacturing and Warehousing
- 5.3.4 Telecom
- 5.3.5 Others (incl Transportation and Logistics)
- 5.4 By Geography
- 5.4.1 North America
- 5.4.1.1 United States
- 5.4.1.2 Canada
- 5.4.1.3 Mexico
- 5.4.2 Europe
- 5.4.2.1 Germany
- 5.4.2.2 France
- 5.4.2.3 United Kingdom
- 5.4.2.4 Italy
- 5.4.2.5 Spain
- 5.4.2.6 Nordic Countries
- 5.4.2.7 Russia
- 5.4.2.8 Rest of Europe
- 5.4.3 Asia-Pacific
- 5.4.3.1 China
- 5.4.3.2 Japan
- 5.4.3.3 India
- 5.4.3.4 South Korea
- 5.4.3.5 ASEAN Countries
- 5.4.3.6 Rest of Asia-Pacific
- 5.4.4 South America
- 5.4.4.1 Brazil
- 5.4.4.2 Argentina
- 5.4.4.3 Rest of South America
- 5.4.5 Middle East and Africa
- 5.4.5.1 United Arab Emirates
- 5.4.5.2 Saudi Arabia
- 5.4.5.3 South Africa
- 5.4.5.4 Rest of Middle East and Africa
- 5.4.1 North America
6 Competitive Landscape
- 6.1 Market Concentration
- 6.2 Strategic Moves (M&A, Partnerships, PPAs)
- 6.3 Market Share Analysis (Market Rank/Share for key companies)
- 6.4 Company Profiles (includes Global level Overview, Market level overview, Core Segments, Financials as available, Strategic Information, Products & Services, and Recent Developments)
- 6.4.1 EnerSys
- 6.4.2 East Penn Manufacturing
- 6.4.3 Exide Industries
- 6.4.4 GS Yuasa Corp.
- 6.4.5 Saft Groupe SA
- 6.4.6 Amara Raja Batteries
- 6.4.7 Panasonic Energy
- 6.4.8 CATL
- 6.4.9 BYD Co. Ltd.
- 6.4.10 LG Energy Solution
- 6.4.11 Samsung SDI
- 6.4.12 Johnson Controls
- 6.4.13 Leoch Int'l
- 6.4.14 JYC Battery
- 6.4.15 Narada Power
- 6.4.16 Crown Battery
- 6.4.17 Hoppecke Batteries
- 6.4.18 NorthStar Battery
- 6.4.19 Trojan Battery
- 6.4.20 Vision Group
7 Market Opportunities & Future Outlook
- 7.1 White-space & Unmet-Need Assessment
 工业电池市场规模、份额和成长分析(适用于物料输送设备):按电池类型、应用、最终用户、技术采用、销售管道和地区划分-2026-2033年产业预测
 2026年全球工业机器人电池市场报告2026年全球工业电池市场报告
 工业电池市场 - 全球产业规模、份额、趋势、机会、预测(按类型、应用、地区和竞争格局划分),2021-2031年
 工业电池市场规模、份额及成长分析(按类型、应用和地区划分)-2026-2033年产业预测
 施工机械电池:全球市占率及排名、总收入及需求预测(2025-2031年)
 工业电池市场按电池化学成分、产品类型、应用、终端用户产业、容量范围、安装类型和分销管道划分-2025-2032年全球预测洗地机电池市场-全球产业规模、份额、趋势、机会和预测,按电池类型、按机器类型、按最终用途行业、按地区和竞争情况细分,2020-2030 年
 2025 年至 2033 年工业电池市场报告,按驱动类型(电动、液压等)、技术(锂离子电池、铅酸电池等)、应用(堆高机、电信、UPS 等)和地区划分
 北美工业电池:市场占有率分析、行业趋势和成长预测(2025-2030 年)