


 |
市场调查报告书
商品编码
1851609
人形机器人:市场占有率分析、产业趋势、统计数据和成长预测(2025-2030 年)Humanoids - Market Share Analysis, Industry Trends & Statistics, Growth Forecasts (2025 - 2030) |
||||||
※ 本网页内容可能与最新版本有所差异。详细情况请与我们联繫。
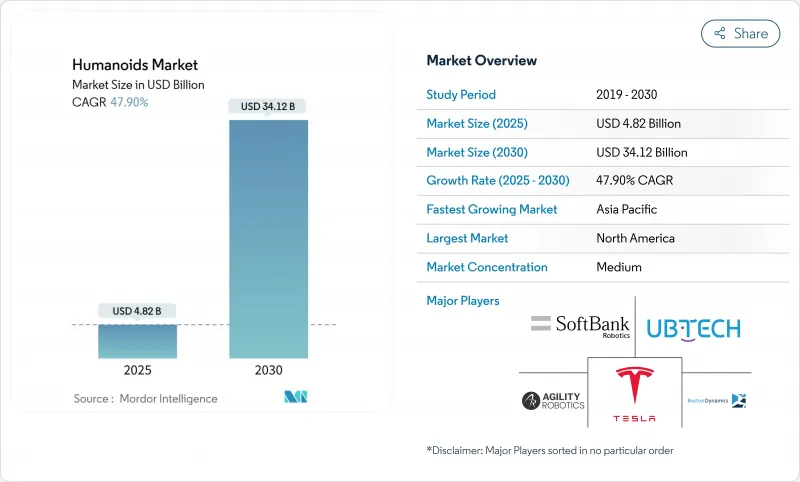
预计到 2025 年,人形机器人市场规模将达到 48.2 亿美元,到 2030 年将达到 341.2 亿美元,年复合成长率为 47.9%。
人工智慧硬体成本的快速下降、七国集团和中国人口老化以及工业劳动力缺口的扩大,正推动人形机器人从先导计画发展成为医疗保健、製造业和物流的核心营运资产。中国和韩国的「人形机器人2025」计划,以及2024年至2025年间超过40亿美元的风险投资,正在加速新平台的上市进程。企业优先考虑能够利用现有工具和基础设施的人类外形规格,而软体的进步则将曾经固定的机器转变为适应性强的协作伙伴。随着这些因素相互促进,人形机器人市场正成为各国在不增加人力的情况下提高生产力的关键解决方案。
全球人形机器人市场趋势与洞察
人口老化导致护理需求不断增长
日本人口老化率(65岁以上人口比例)预计到2024年将达到29.1%,到2030年,医疗工作者缺口可能超过240万人。医院正在使用人形机器人进行持续的病患监测、药物管理和社交互动,在保证服务品质的前提下,降低了30%至40%的营运成本。本田的HARU机器人正在西班牙的老年病房为护理人员提供支持,展现了其跨国应用价值。面临类似劳动力短缺的零售和餐饮企业也正在部署接待和服务机器人,以在员工人数减少的情况下保障顾客体验。韩国每1万名员工中已有1,102台机器人运作,是全球机器人密度最高的国家。
人工智慧成本曲线低于每单位25,000美元
规模经济、标准化致动器和低成本GPU将使製造成本从2025年的3.5万美元降至2030年的1.3万至1.7万美元。特斯拉预计将生产1万台Optimus单元,每台成本为2万至3万美元,其吞吐量将达到汽车等级。 Apptronik与GoogleDeepMind的合作将大规模语言模型推理与Apollo的运维能力结合,将原本需要一台价值10万美元的伺服器才能完成的任务压缩到一台边缘处理器上。由于采用电动车产业的发展,电池组价格自2010年以来已下降85%,进一步降低了整体拥有成本。
与协作机器人相比,资本投入高,总拥有成本超过每小时 0.50 美元。
目前,人形机器人每小时运行成本在0.75美元至1.25美元之间,而六轴协作机器人每小时运行成本则为0.35美元至0.50美元。高精度齿轮箱、25个以上的自由度以及广泛的感测器阵列都会推高采集费用和维护成本。然而,对于需要人类触及或导航的任务,协作机器人需要进行成本高昂的设备改造,从而抵消了每小时的成本优势。在已开发国家,工厂平均薪资超过4.5万美元,人形机器人每年2.5万美元至3.5万美元的运作成本变得越来越有竞争力。
细分市场分析
到2024年,轮式机器人将占总收入的63%,凸显了用户目前在平板工厂和履约中心对节能、低维护成本移动解决方案的偏好。这一主导地位意味着轮式机器人将在同年占据人形机器人市场的最大份额。然而,双足机器人类别将以59%的复合年增长率成长,显示随着成本的降低,人形机器人市场将朝着完全适应人类环境的方向发展。
改进的模型预测控制器、柔性踝关节和全身协调演算法使得机器人能够以超过 1.5 公尺/秒的速度稳定行走,同时降低 30% 的消费量。混合型和多足机器人目前仍是灾害应变领域的小众解决方案,因为在灾害现场,瓦砾和崎岖地形会导致轮式机器人无法使用。随着人工智慧运动规划器的日益成熟,买家希望能够在多个地点重复部署同一台双足机器人,从而提高其使用寿命价值,并增强软体更新与运行结果之间的关联性。
到2024年,硬体将占人形机器人市场规模的68%,这反映出在致动器、复合框架和高解析度感测器堆迭方面的大量资本支出。然而,软体收入的复合年增长率将达到57.34%,超过机械升级週期。
云端视觉、自然语言模式和强化学习技术堆迭使得同一底盘能够同时提供早晨的商品组装服务和下班后的礼宾服务。随着经常性授权费用超过一次性硬体利润,供应商正转向服务等级协定(SLA),以确保执行时间、安全修补程式和效能下降。智慧型手机生态系统的这种变化使得程式码成为最重要的差异化因素,即使在实体商品领域也是如此,并推动了买家对网路安全和资料所有权条款的关注。
区域分析
2024年,北美将占全球销售额的38%,这主要得益于20亿美元的风险投资以及早期监管沙盒政策降低了部署风险。特斯拉、波士顿动力和Agility Robotics等美国原始设备製造商(OEM)在2024年至2025年间总合筹集了12亿美元,用于商业工具的开发和试点部署。加拿大大学正专注于柔性致动器的研究,而墨西哥则供应精密齿轮箱。
亚太地区是成长最快的区域,预计到2030年复合年增长率将达到55%。中国斥资100亿美元的国家人形机器人计画协调地方拨款、军方采购和配额,六家本土企业的目标是到2025年各自生产1000台。韩国3.5兆韩元的经济奖励策略将透过其政策性银行向私人研究机构提供资金,以促进研发和本土化内容监管。日本的汽车製造传统使其能够生产高精度支柱和关节模组,而印度则提供低成本的云控制中间件。这些力量的结合将扩大产量,降低单位成本,并增强新兴亚洲地区的人形机器人市场。
在政策的主导,欧洲将迎来稳定成长。德国的工业4.0工厂正在使用人形机器人组装小型、多品种产品,这些产品无需外包生产,即可在国内完成组装。欧盟拟议的人工智慧责任指令要求严格的故障安全设计,虽然增加了认证成本,但降低了长期的声誉风险。法国和英国正致力于先进触觉感测器的研发,北欧一项针对老年护理的试点计画正在护理环境中检验机器人。儘管获得认证所需的时间延缓了一些买家的购买计划,但德国和义大利现有的汽车零件製造商正在向次组件製造领域扩张,加剧了跨大西洋的竞争。
其他福利:
- Excel格式的市场预测(ME)表
- 3个月的分析师支持
目录
第一章 引言
- 研究假设和市场定义
- 调查范围
第二章调查方法
第三章执行摘要
第四章 市场情势
- 市场概览
- 市场驱动因素
- 人口老化和护理缺口增加了需求。
- 人工智慧成本曲线低于每单位25,000美元
- 七国集团和中国工厂劳动力短缺问题
- 国家「人形机器人2025」计画(中国、韩国)
- IEC/ISO老年护理机器人安全标准
- 电动汽车马达和电池供应链的连锁反应
- 市场限制
- 与协作机器人相比,资本支出和总拥有成本每小时高出0.50美元以上。
- 对安全/责任法规的不确定性
- 稀土磁铁供应瓶颈
- 社会接受度和工会反对
- 价值/供应链分析
- 监管环境
- 技术展望
- 波特五力分析
- 供应商的议价能力
- 买方的议价能力
- 新进入者的威胁
- 替代品的威胁
- 竞争对手之间的竞争
第五章 市场规模与成长预测
- 按运动类型
- 车轮行程
- 双足行走
- 混合/多腿
- 按组件
- 硬体
- 软体
- 服务
- 按最终用户行业划分
- 医疗机构
- 零售和购物中心
- 製造和仓储业
- 饭店业(饭店、主题乐园)
- 学术研究机构
- 按外形规格
- 身高(超过140公分)
- 中等尺寸(100-140公分)
- 小型(小于100公分)
- 仅上半身
- 按地区
- 北美洲
- 美国
- 加拿大
- 墨西哥
- 欧洲
- 英国
- 德国
- 法国
- 义大利
- 其他欧洲
- 亚太地区
- 中国
- 日本
- 印度
- 韩国
- 亚太其他地区
- 中东
- 以色列
- 沙乌地阿拉伯
- 阿拉伯聯合大公国
- 土耳其
- 其他中东地区
- 非洲
- 南非
- 埃及
- 其他非洲地区
- 南美洲
- 巴西
- 阿根廷
- 其他南美洲
- 北美洲
第六章 竞争情势
- 市场集中度
- 策略趋势
- 市占率分析
- 公司简介
- Honda Motor Co., Ltd.
- Toyota Motor Corporation
- SoftBank Robotics Group Corp.
- UBTECH Robotics Inc.
- PAL Robotics SL
- Hanson Robotics Ltd.
- Kawada Robotics Corporation
- Promobot LLC
- Invento Robotics Pvt. Ltd.
- ROBOTIS Co., Ltd.
- Boston Dynamics Inc.
- Tesla, Inc.(Optimus)
- Agility Robotics LLC
- Figure AI, Inc.
- Engineered Arts Ltd.
- Unitree Robotics Co., Ltd.
- Fourier Intelligence Co., Ltd.
- Xiaomi Corp.-Robotics Lab
- Samsung Electronics Co., Ltd.
- Apptronik Inc.
第七章 市场机会与未来展望
The humanoids market size is valued at USD 4.82 billion in 2025 and is forecast to reach USD 34.12 billion by 2030, advancing at a 47.9% CAGR.
Rapid cost declines in artificial intelligence hardware, demographic ageing in the G7 and China, and widening industrial labour gaps are converging to push humanoid robots from pilot projects to core operational assets across healthcare, manufacturing, and logistics. Venture investment flows exceeding USD 4 billion in 2024-2025, together with China's and South Korea's "Humanoid 2025" policies, are accelerating time-to-market for new platforms. Enterprises are prioritising human-scale form factors capable of using existing tools and infrastructure, while software advances turn once-static machines into adaptable co-workers. As these factors reinforce each other, the humanoids market is becoming a pivotal solution for countries seeking productivity gains without expanding their human workforce.
Global Humanoids Market Trends and Insights
Aging-Population Care Gap Intensifies Demand
Japan's population aged 65 years and older reached 29.1% in 2024, and healthcare worker deficits may exceed 2.4 million by 2030. Hospitals are turning to humanoids for continuous patient monitoring, medication rounds, and social interaction, trimming operating costs by 30-40% while keeping quality consistent. Honda's Haru units now assist nurses in Spanish geriatric wards, demonstrating cross-border relevance. Retail and hospitality operators facing similar labour gaps are introducing reception and service robots to protect customer experience despite shrinking staff levels. South Korea already operates 1,102 robots per 10,000 employees, the highest robot density worldwide.
AI Cost Curve Falling Below USD 25 k Per Unit
Economies of scale, standardised actuators, and low-cost GPUs are pushing manufactured costs down from USD 35,000 in 2025 to a targeted USD 13,000-17,000 by 2030. Tesla expects to build 10,000 Optimus units priced at USD 20,000-30,000 each, reflecting automotive-style throughput. Apptronik's partnership with Google DeepMind ties large-language-model reasoning to Apollo's manipulation skills, compressing what once required USD 100,000 servers onto edge processors. Battery pack prices, already 85% lower than 2010 levels thanks to the electric-vehicle industry, further erode total cost of ownership.
High Cap-ex & TCO Above USD 0.50/hr Compared with Cobots
Operating a humanoid costs USD 0.75-1.25 per hour today, versus USD 0.35-0.50 for six-axis cobots. Precision gearboxes, 25-plus degrees of freedom, and richer sensor arrays inflate both acquisition and maintenance outlays. Nevertheless, in tasks demanding human reach and navigation, cobots require costly re-engineering of facilities, offsetting their per-hour advantage. In developed economies where average factory wages top USD 45,000, a humanoid's USD 25,000-35,000 annual running cost is increasingly competitive.
Other drivers and restraints analyzed in the detailed report include:
- Factory Labour Shortages in G7 & China
- National "Humanoid 2025" Programmes (China, South Korea)
- Safety / Liability Regulation Uncertainty
For complete list of drivers and restraints, kindly check the Table Of Contents.
Segment Analysis
The wheel-drive class held 63% of 2024 revenues, underscoring current user preference for energy-efficient, low-maintenance mobility in flat-floored plants and fulfilment centres. This dominance meant the wheel cohort accounted for the largest slice of the humanoids market share that year. However, the biped category is expanding at a 59% CAGR, signalling that the humanoids market will pivot toward full human-environment compatibility as costs fall.
Improved model-predictive controllers, compliant ankle joints, and whole-body coordination algorithms are delivering steady-state walking above 1.5 m/s while cutting energy draw by 30%. Hybrid and multi-leg robots remain niche solutions for disaster response where debris or uneven terrain precludes wheels. As AI motion planners mature, buyers anticipate re-deploying the same biped unit across multiple sites, raising lifetime value and tightening the link between software updates and operational output.
Hardware captured 68% of the humanoids market size in 2024, reflecting large capital bills for actuators, composite frames, and high-resolution sensor stacks. Yet software revenue is tracking a 57.34% CAGR, outpacing any mechanical upgrade cycle.
Cloud-enhanced vision, natural-language models, and reinforcement-learning stacks enable the same chassis to perform kitting in the morning and concierge duties after hours. As recurring licence fees overtake one-off hardware margins, vendors are shifting to service-level agreements that guarantee uptime, security patches, and feature drops. This echo of the smartphone ecosystem positions code as the foremost differentiator even inside a physical-goods category, and heightens buyer focus on cybersecurity and data-ownership clauses.
The Humanoids Market Report is Segmented by Motion Type (Wheel-Drive, Biped, Hybrid/Multi-leg), Component (Hardware, Software, Services), End-User Industry (Healthcare Facilities, Retail & Shopping Centres, Manufacturing & Warehousing, and More), Form Factor (Full-Size Greater Than 140cm, Mid-Size 100-140cm, Small Less Than 100cm, and More), and Geography. The Market Forecasts are Provided in Terms of Value (USD).
Geography Analysis
North America retained 38% of global 2024 revenue, catalysed by USD 2 billion in venture rounds and early regulatory sandboxes that cut deployment risk. United States OEMs such as Tesla, Boston Dynamics, and Agility Robotics collectively secured USD 1.2 billion during 2024-2025, bankrolling commercial tooling and pilot roll-outs. Canada's universities specialise in compliant-actuator research, and Mexico supplies precision gear casings, threading NAFTA supply-chain integration into humanoid economics.
Asia-Pacific is the fastest-growing theatre, advancing at a 55% CAGR to 2030. China's USD 10 billion National Humanoid programme aligns provincial grants, military adoption, and purchasing quotas, while six local firms target >= 1,000 units each for 2025 volume. South Korea's KRW 3.5 trillion stimulus channels funds through its policy bank to private labs, fostering R&D and domestic content rules. Japan's automotive heritage yields high-precision strut and joint modules, and India supplies cloud-control middleware at lower cost. Collectively, these forces scale output and compress unit costs, bolstering the humanoids market across emerging Asian economies.
Europe posts steady, policy-led growth. Germany's Industrie 4.0 facilities adopt humanoids to keep high-mix assembly at home rather than offshoring. The EU's draft AI liability directive compels rigorous fail-safe designs, adding qualification overhead but reducing long-run reputational risk. France and the United Kingdom emphasise advanced haptic-sensor R&D, while Nordic eldercare pilots validate robots in long-term-care settings. Although certification timelines push some buyers to slower roll-outs, established automotive suppliers in Germany and Italy are lining up to build sub-assemblies, reinforcing trans-Atlantic competition.
- Honda Motor Co., Ltd.
- Toyota Motor Corporation
- SoftBank Robotics Group Corp.
- UBTECH Robotics Inc.
- PAL Robotics SL
- Hanson Robotics Ltd.
- Kawada Robotics Corporation
- Promobot LLC
- Invento Robotics Pvt. Ltd.
- ROBOTIS Co., Ltd.
- Boston Dynamics Inc.
- Tesla, Inc. (Optimus)
- Agility Robotics LLC
- Figure AI, Inc.
- Engineered Arts Ltd.
- Unitree Robotics Co., Ltd.
- Fourier Intelligence Co., Ltd.
- Xiaomi Corp. - Robotics Lab
- Samsung Electronics Co., Ltd.
- Apptronik Inc.
Additional Benefits:
- The market estimate (ME) sheet in Excel format
- 3 months of analyst support
TABLE OF CONTENTS
1 INTRODUCTION
- 1.1 Study Assumptions and Market Definition
- 1.2 Scope of the Study
2 RESEARCH METHODOLOGY
3 EXECUTIVE SUMMARY
4 MARKET LANDSCAPE
- 4.1 Market Overview
- 4.2 Market Drivers
- 4.2.1 Aging-population care gap intensifies demand
- 4.2.2 AI cost curve falling below USD 25k per unit
- 4.2.3 Factory labor shortages in G7 and China
- 4.2.4 National "Humanoid 2025" programs (China, S-Korea)
- 4.2.5 IEC/ISO elderly-care robot safety standards
- 4.2.6 EV motor and battery supply-chain spill-overs
- 4.3 Market Restraints
- 4.3.1 High cap-ex and TCO above USD 0.50 /hr compared with cobots
- 4.3.2 Safety / liability regulation uncertainty
- 4.3.3 Rare-earth magnet supply bottlenecks
- 4.3.4 Societal acceptance and labour-union pushback
- 4.4 Value / Supply-Chain Analysis
- 4.5 Regulatory Landscape
- 4.6 Technological Outlook
- 4.7 Porter's Five Forces Analysis
- 4.7.1 Bargaining Power of Suppliers
- 4.7.2 Bargaining Power of Buyers
- 4.7.3 Threat of New Entrants
- 4.7.4 Threat of Substitutes
- 4.7.5 Intensity of Competitive Rivalry
5 MARKET SIZE AND GROWTH FORECASTS (VALUE)
- 5.1 By Motion Type
- 5.1.1 Wheel-drive
- 5.1.2 Biped
- 5.1.3 Hybrid / Multi-leg
- 5.2 By Component
- 5.2.1 Hardware
- 5.2.2 Software
- 5.2.3 Services
- 5.3 By End-user Industry
- 5.3.1 Healthcare Facilities
- 5.3.2 Retail and Shopping Centres
- 5.3.3 Manufacturing and Warehousing
- 5.3.4 Hospitality (Hotels, Theme Parks)
- 5.3.5 Academic and Research Institutes
- 5.4 By Form Factor
- 5.4.1 Full-size (Greater than 140 cm)
- 5.4.2 Mid-size (100-140 cm)
- 5.4.3 Small (Less than 100 cm)
- 5.4.4 Upper-torso only
- 5.5 By Geography
- 5.5.1 North America
- 5.5.1.1 United States
- 5.5.1.2 Canada
- 5.5.1.3 Mexico
- 5.5.2 Europe
- 5.5.2.1 United Kingdom
- 5.5.2.2 Germany
- 5.5.2.3 France
- 5.5.2.4 Italy
- 5.5.2.5 Rest of Europe
- 5.5.3 Asia-Pacific
- 5.5.3.1 China
- 5.5.3.2 Japan
- 5.5.3.3 India
- 5.5.3.4 South Korea
- 5.5.3.5 Rest of Asia-Pacific
- 5.5.4 Middle East
- 5.5.4.1 Israel
- 5.5.4.2 Saudi Arabia
- 5.5.4.3 United Arab Emirates
- 5.5.4.4 Turkey
- 5.5.4.5 Rest of Middle East
- 5.5.5 Africa
- 5.5.5.1 South Africa
- 5.5.5.2 Egypt
- 5.5.5.3 Rest of Africa
- 5.5.6 South America
- 5.5.6.1 Brazil
- 5.5.6.2 Argentina
- 5.5.6.3 Rest of South America
- 5.5.1 North America
6 COMPETITIVE LANDSCAPE
- 6.1 Market Concentration
- 6.2 Strategic Moves
- 6.3 Market Share Analysis
- 6.4 Company Profiles (includes Global level Overview, Market level overview, Core Segments, Financials as available, Strategic Information, Market Rank/Share, Products and Services, Recent Developments)
- 6.4.1 Honda Motor Co., Ltd.
- 6.4.2 Toyota Motor Corporation
- 6.4.3 SoftBank Robotics Group Corp.
- 6.4.4 UBTECH Robotics Inc.
- 6.4.5 PAL Robotics SL
- 6.4.6 Hanson Robotics Ltd.
- 6.4.7 Kawada Robotics Corporation
- 6.4.8 Promobot LLC
- 6.4.9 Invento Robotics Pvt. Ltd.
- 6.4.10 ROBOTIS Co., Ltd.
- 6.4.11 Boston Dynamics Inc.
- 6.4.12 Tesla, Inc. (Optimus)
- 6.4.13 Agility Robotics LLC
- 6.4.14 Figure AI, Inc.
- 6.4.15 Engineered Arts Ltd.
- 6.4.16 Unitree Robotics Co., Ltd.
- 6.4.17 Fourier Intelligence Co., Ltd.
- 6.4.18 Xiaomi Corp. - Robotics Lab
- 6.4.19 Samsung Electronics Co., Ltd.
- 6.4.20 Apptronik Inc.
7 MARKET OPPORTUNITIES and FUTURE OUTLOOK
- 7.1 White-space and Unmet-need Assessment
