


 |
市场调查报告书
商品编码
1851615
氨:市场占有率分析、产业趋势、统计数据和成长预测(2025-2030 年)Ammonia - Market Share Analysis, Industry Trends & Statistics, Growth Forecasts (2025 - 2030) |
||||||
※ 本网页内容可能与最新版本有所差异。详细情况请与我们联繫。
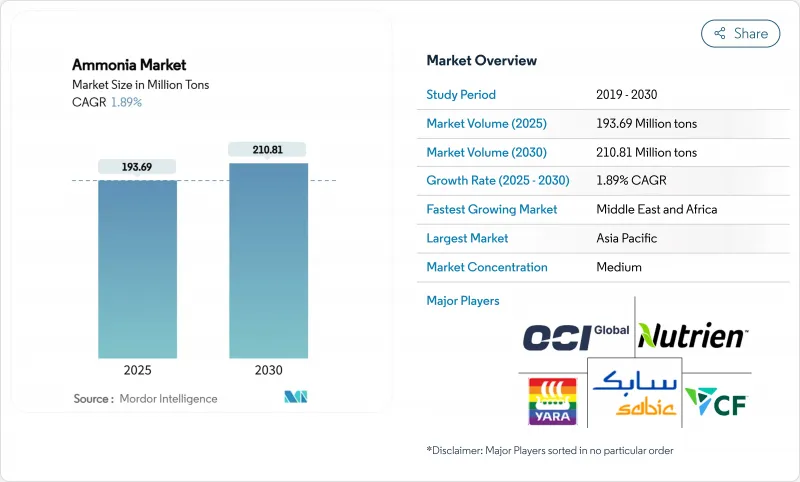
预计到 2025 年氨市场规模将达到 1.9369 亿吨,到 2030 年将达到 2.1081 亿吨,在预测期(2025-2030 年)内复合年增长率为 1.89%。
强劲的营收成长凸显了生产技术、原料策略和下游应用领域发生的根本性转变,而这些转变的驱动力包括日益严格的脱碳目标、天然气价格持续波动以及低碳船用燃料的广泛应用。对绿色和蓝色设施的战略投资、中国煤製气升级改造以及氨作为氢载体的兴起,正在重塑供应链格局。同时,由于安全要求不断提高和尿素供应过剩,短期价格仍将波动。能够获得低碳原料、再生能源和技术合作的生产商正在提升其成本竞争力,但欧洲的天然气相关资产仍面临利润率压力。随着这些结构性因素重塑氨市场,区域成长率、产品组合和贸易流量的差异远远超过关键吨位资料所显示的程度。
全球氨市场趋势与洞察
亚洲各地对低碳肥料的需求激增
亚洲农业向永续性转型,加速了低碳肥料的普及。中国正在对燃煤设施进行改造,引入可再生能源和碳捕获系统,从而推动了对可再生混合肥料的需求。印尼的GAIA计划正在部署首个天然气和电解氢共供的混合肥料厂,为转型设施提供了一个可扩展的模板。政策奖励,例如对永续投入品的优惠融资和对传统尿素厂更严格的排放限制,正在引导农民转向高级产品。这些影响的连锁反应已在模组化电解槽设备的订单以及肥料经销商与再生能源开发商之间签订的长期承购协议中显现出来。
采用氢气载体进行海上燃料库
航运业的脱碳承诺正将氨定位为可行的氢载体。日本和韩国于2024年完成了全球首例卡车到船舶的加註作业,证明了端到端操作的安全性,并增强了港口当局的信心。国际海事组织提出的2050年将航运排放减半的目标,促使航运公司签订绿色氨供应合约。船级社对可使用氨燃料引擎的核准以及沿海船舶设计的推广应用,正在降低技术风险,而碳价格预测则正在改善计划的经济效益。
天然气价格波动推高了欧洲的生产成本。
由于天然气现货价格持续高于2022年之前的水平,欧洲生产商面临长期的成本上涨。 CF Industries和BASF旗下的多家工厂已缩减产量,有效产能损失高达700万吨。俄罗斯尿素进口填补了这一缺口,使区域政策目标的实现更加复杂。除非能源供应合约能够确保价格竞争力,或蓝氨维修能够迅速推进,否则欧洲的尿素供应预计将落后于全球需求。
细分市场分析
到2024年,95%的氨市场吨位将以液态形式供应。与压缩氢气相比,液态氨具有更高的体积能量密度,便于海上燃料供应商进行经济高效的储存,并可用于远距管道混合。随着新的港口燃料库中心、现场冷冻系统和专用沿海运输船的运作,预计该细分市场将以1.94%的年增长率成长,略高于氨市场的整体成长速度。包括日本大型沿海运输船原型在内的技术进步,支援更大的小包裹尺寸,从而降低了每吨氨的运输成本。对低温隔热材料和检测系统的投资减少了蒸发损失,进一步增强了液态氨的流动性优势。
儘管气态氨对于某些需要即时气化的製程(例如某些聚合物和己内酰胺的合成)仍然至关重要,但其市场份额受到高昂处理成本的限制。安全法规限制了运输压力并要求使用厚壁钢瓶,与冷藏液体运输相比,这推高了物流成本。预计到2030年,液态氨产品仍将继续主导氨市场,儘管在一些特定的石化製程领域,液态氨市场预计会有所成长。
区域分析
到2024年,亚太地区将占全球氨市场份额的51.40%。中国的煤炭气化维修和印度日产750吨的Hygenco计划正在扩大低碳产能,而日本和韩国的港口已开始进行燃料库试验。提供可再生能源电力转移和税收优惠的区域性政策方案将进一步降低供应成本。位于印尼亚齐的混合型工厂为资源丰富但电力短缺的地区提供了一条合适的转型路径。
中东和非洲地区是成长最快的地区,预计2025年至2030年的复合年增长率将达到2.67%。埃及价值330亿美元的项目储备、摩洛哥价值10亿美元的达赫拉计划以及卡达价值12亿美元的棕地扩建项目,都显示各国雄心勃勃地希望透过绿色或蓝色氨出口,将太阳能和风能资源货币化。墨西哥湾沿岸工程公司与一家造船厂的合作,正在提供技术支援并加快建设进度。
北美将充分利用丰富的页岩气资源和碳捕获中心,以维持较低的边际生产成本。 CF Industries公司1040万吨的产能以及其在美国提案的37个计划,如果获得批准,预计将该地区的年产量从2100万吨提升至7900万吨。联邦清洁氢能税额扣抵将改善优质设施的经济效益,而墨西哥湾沿岸港口则提供了通往欧洲和亚洲市场的深水通道。
欧洲正面临高昂的天然气价格和不确定的碳关税。现货价格波动导致产量持续下降,但技术供应商正在加速维修生产线,采用可捕获高达99%二氧化碳的蓝氨技术。进口依赖度不断上升,俄罗斯尿素进口量的增加就是一个显着的例子。儘管欧盟致力于提升国内能源安全,但其资本配置优先考虑的是下游无污染燃料承购合同,而非新建国内产能。
受采矿业和船用燃料需求的推动,拉丁美洲和大洋洲将迎来进一步成长。巴西阿库港已确定兴建一座年产100万吨绿色氨的工厂,而澳洲铁矿石开采的扩张将促进炸药消费。
其他福利:
- Excel格式的市场预测(ME)表
- 3个月的分析师支持
目录
第一章 引言
- 研究假设和市场定义
- 调查范围
第二章调查方法
第三章执行摘要
第四章 市场情势
- 市场概览
- 市场驱动因素
- 亚洲各地对低碳肥料的需求激增
- 日本和韩国采用氨作为海上燃料库的氢气载体
- 中国尿素厂煤改气提振氨产量
- 火药製造中用量增加
- 对绿色氨的需求不断增长
- 市场限制
- 天然气价格波动推高了欧洲的生产成本。
- 安全性和毒性方面的担忧减缓了其在各行业的应用。
- 尿素供应过剩抑制了现货氨的需求
- 价值链分析
- 技术展望
- 波特五力模型
- 供应商的议价能力
- 买方的议价能力
- 新进入者的威胁
- 替代品的威胁
- 竞争程度
第五章 市场规模与成长预测
- 按类型
- 液体
- 气体
- 透过使用
- 氮肥中间体
- 冷媒(工业和低温运输)
- 用于炸药和采矿的硝酸盐
- 医药中间体
- 其他(清洁和家用产品、船用燃料和氢气装运船隻)
- 按最终用途行业划分
- 农业
- 纺织品
- 矿业
- 製药
- 参考
- 其他(食品饮料、橡胶、水处理、石油、纸浆和造纸业)
- 按地区
- 亚太地区
- 中国
- 印度
- 日本
- 韩国
- ASEAN
- 澳洲
- 纽西兰
- 亚太其他地区
- 北美洲
- 美国
- 加拿大
- 墨西哥
- 欧洲
- 德国
- 英国
- 法国
- 义大利
- 西班牙
- 北欧国家
- 其他欧洲地区
- 南美洲
- 巴西
- 阿根廷
- 南美洲其他地区
- 中东和非洲
- 沙乌地阿拉伯
- 阿拉伯聯合大公国
- 卡达
- 土耳其
- 南非
- 埃及
- 奈及利亚
- 其他中东和非洲地区
- 亚太地区
第六章 竞争情势
- 市场集中度
- 策略趋势
- 市占率(%)/排名分析
- 公司简介
- Acron PJSC
- BASF SE
- CF Industries Holdings Inc.
- CSBP
- Dyno Nobel
- EuroChem Group
- Group DF(Ostchem)
- Grupa Azoty
- IFFCO
- Industries Qatar
- JSC Togliattiazot
- Koch Fertilizer, LLC.
- LSB Industries
- Nutrien
- OCI
- Orica Limited
- PT Pupuk Sriwidjaja Palembang(Pusri)
- Rashtriya Chemicals and Fertilizers Limited
- SABIC
- Yara
第七章 市场机会与未来展望
The Ammonia Market size is estimated at 193.69 Million tons in 2025, and is expected to reach 210.81 Million tons by 2030, at a CAGR of 1.89% during the forecast period (2025-2030).
This steady topline belies a fundamental transition in production technologies, feedstock strategies, and downstream uses as decarbonization targets tighten, natural-gas price volatility persists, and low-carbon maritime fuels gain traction. Strategic investments in green and blue facilities, coal-to-gas upgrades in China, and the emergence of ammonia as a hydrogen carrier are repositioning supply chains, while rising safety requirements and urea oversupply keep short-term prices volatile. Producers able to lock in low-carbon feedstocks, secure renewable power, and form technology alliances are improving cost competitiveness, whereas Europe's gas-exposed assets remain under margin pressure. As these structural forces reshape the ammonia market, regional growth rates, product mixes, and trade flows are diverging more sharply than headline tonnage suggests.
Global Ammonia Market Trends and Insights
Surge in Low-Carbon Fertiliser Demand across Asia
Asia's agricultural pivot toward sustainability is accelerating low-carbon fertilizer uptake. China is upgrading coal-based assets with renewable electricity and carbon-capture systems, lifting demand for renewable ammonia blends. Indonesia's GAIA project introduces the first hybrid plant that co-feeds natural gas and electrolytic hydrogen, providing a scalable template for transition facilities. Policy incentives, such as preferential loan programs for sustainable inputs and tighter emission limits on conventional urea plants, are nudging farmers to premium products. The ripple effect is already evident in equipment orders for modular electrolysers and in long-term offtake contracts between fertilizer distributors and renewable electricity developers.
Adoption as Hydrogen Carrier for Maritime Bunkering
The maritime sector's decarbonization pledge is positioning ammonia as a practical hydrogen vector. Japan and South Korea completed the world's first truck-to-ship bunkering operation in 2024, demonstrating end-to-end handling safety and reinforcing confidence among port authorities. The International Maritime Organization's target to halve shipping emissions by 2050 has motivated carriers to lock in green ammonia supply agreements. Class-society approvals for ammonia-ready engines and the rollout of coastal carrier designs are lowering technical risk, while carbon-price forecasts improve project economics.
Volatile Natural-Gas Prices Inflating European Production Costs
European producers face chronic cost inflation as natural-gas spot prices remain above pre-2022 levels. Several plants operated by CF Industries and BASF have curtailed output, removing up to 7 million tons of effective capacity. Imports of Russian urea are back-filling the gap, complicating regional policy goals. Unless energy-sourcing contracts lock in competitive prices or blue-ammonia retrofits proceed swiftly, European supply is expected to lag global demand.
Other drivers and restraints analyzed in the detailed report include:
- Coal-to-Gas Conversion of Chinese Urea Plants
- Increasing Usage to Produce Explosives
- Safety & Toxicity Concerns
For complete list of drivers and restraints, kindly check the Table Of Contents.
Segment Analysis
Liquid product accounted for 95% of the ammonia market tonnage in 2024. This form benefits from higher volumetric energy density than compressed hydrogen, facilitating cost-effective storage for maritime bunker suppliers and long-distance pipeline blends. The segment is forecast to grow at 1.94% annually, slightly faster than the overall ammonia market, as new port bunkering hubs, on-site refrigeration systems, and specialized coastal carriers come online. Technological advances, including Japan's large-coastal-carrier prototypes, support larger parcel sizes that reduce delivered cost per ton. Investments in cryogenic insulation and detection systems mitigate boil-off losses, further reinforcing liquidity advantages.
The gaseous segment remains essential for processes requiring immediate gasification, such as certain polymer or caprolactam syntheses, yet its share is constrained by higher handling costs. Safety regulations limit transport pressures and demand thicker-walled cylinders, which inflates logistics expenses relative to refrigerated-liquid shipping. Although incremental growth is expected in niche petrochemical processes, liquid product will continue to dominate the ammonia market through 2030.
The Ammonia Market Report Segments the Industry by Type (Liquid and Gas), Application (Nitrogen Fertiliser Intermediate, Refrigerants (Industrial and Cold-Chain), Explosives and Mining Nitrates, and More), End-User Industry (Agriculture, Textiles, Mining, and More), and Geography (Asia-Pacific, North America, Europe, South America, and Middle East and Africa). The Market Forecasts are Provided in Terms of Volume (tons).
Geography Analysis
Asia-Pacific dominated the ammonia market with 51.40% share in 2024. China's coal-to-gas revamps and India's 750-ton-per-day Hygenco project expand low-carbon capacity, while Japanese and South Korean ports pioneer bunkering pilots. Regional policy packages offering renewable-power wheeling and tax rebates further lower delivered costs. Indonesia's hybrid plant in Aceh showcases transition pathways suited to resource-rich, power-constrained locations.
The Middle East and Africa region is the fastest-growing geography with a 2.67% CAGR projected for 2025-2030. Egypt's USD 33 billion deal pipeline, Morocco's billion-dollar Dakhla project, and Qatar's USD 1.2 billion brownfield expansion illustrate sovereign ambitions to monetize solar and wind resources through green or blue ammonia exports. Gulf Coast engineering firms and shipyard alliances provide technical expertise, accelerating construction timelines.
North America leverages abundant shale gas and carbon-capture hubs to keep marginal production costs low. CF Industries' 10.4 million-ton capacity and 37 US project proposals could raise regional output from 21 million to 79 million tons annually if sanctioned. Federal clean-hydrogen tax credits improve economics for blue facilities, and Gulf Coast ports offer deep-water access to European and Asian markets.
Europe wrestles with high gas prices and uncertain carbon-border tariffs. Production curtailments continue as spot prices remain volatile, though technology providers are accelerating blue-ammonia retrofits with up to 99% CO2 capture rates. Import dependence is rising, highlighted by increasing Russian urea inflows. Although the European Union seeks to promote domestic energy security, capital allocation favors downstream clean-fuel offtake agreements more than new indigenous capacity.
Latin America and Oceania add incremental growth through mining and bunker-fuel demand. Brazil's Port of Acu reserves land for a 1 million-ton green-ammonia facility, while Australia's iron-ore expansion drives explosives consumption.
- Acron PJSC
- BASF SE
- CF Industries Holdings Inc.
- CSBP
- Dyno Nobel
- EuroChem Group
- Group DF (Ostchem)
- Grupa Azoty
- IFFCO
- Industries Qatar
- JSC Togliattiazot
- Koch Fertilizer, LLC.
- LSB Industries
- Nutrien
- OCI
- Orica Limited
- PT Pupuk Sriwidjaja Palembang (Pusri)
- Rashtriya Chemicals and Fertilizers Limited
- SABIC
- Yara
Additional Benefits:
- The market estimate (ME) sheet in Excel format
- 3 months of analyst support
TABLE OF CONTENTS
1 Introduction
- 1.1 Study Assumptions and Market Definition
- 1.2 Scope of the Study
2 Research Methodology
3 Executive Summary
4 Market Landscape
- 4.1 Market Overview
- 4.2 Market Drivers
- 4.2.1 Surge in Low-Carbon Fertiliser Demand across Asia
- 4.2.2 Ammonia Adoption as Hydrogen Carrier for Maritime Bunkering in Japan and South Korea
- 4.2.3 Coal-to-Gas Conversion of Chinese Urea Plants Boosting Ammonia Off-take
- 4.2.4 Increasing Usage to Produce Explosives
- 4.2.5 Rising Demand for Green Ammonia
- 4.3 Market Restraints
- 4.3.1 Volatile Natural-Gas Prices Inflating European Production Costs
- 4.3.2 Safety and Toxicity Concerns Slowing its usage across various industries
- 4.3.3 Urea Over-supply Suppressing Spot Ammonia Demand
- 4.4 Value Chain Analysis
- 4.5 Technological Outlook
- 4.6 Porter's Five Forces
- 4.6.1 Bargaining Power of Suppliers
- 4.6.2 Bargaining Power of Buyers
- 4.6.3 Threat of New Entrants
- 4.6.4 Threat of Substitute Products and Services
- 4.6.5 Degree of Competition
5 Market Size and Growth Forecasts (Volume)
- 5.1 By Type
- 5.1.1 Liquid
- 5.1.2 Gas
- 5.2 By Application
- 5.2.1 Nitrogen Fertiliser Intermediate
- 5.2.2 Refrigerants (Industrial and Cold-Chain)
- 5.2.3 Explosives and Mining Nitrates
- 5.2.4 Pharmaceutical Intermediates
- 5.2.5 Others (Cleaning and Household Products and Marine Bunker Fuel / Hydrogen Carrier)
- 5.3 By End-use Industry
- 5.3.1 Agriculture
- 5.3.2 Textiles
- 5.3.3 Mining
- 5.3.4 Pharmaceutical
- 5.3.5 Referigeration
- 5.3.6 Others (Food and Beverage, Rubber, Water Treatment, Petroleum, and Pulp and Paper Industries)
- 5.4 By Geography
- 5.4.1 Asia-Pacific
- 5.4.1.1 China
- 5.4.1.2 India
- 5.4.1.3 Japan
- 5.4.1.4 South Korea
- 5.4.1.5 ASEAN
- 5.4.1.6 Australia
- 5.4.1.7 New Zealand
- 5.4.1.8 Rest of Asia-Pacific
- 5.4.2 North America
- 5.4.2.1 United States
- 5.4.2.2 Canada
- 5.4.2.3 Mexico
- 5.4.3 Europe
- 5.4.3.1 Germany
- 5.4.3.2 United Kingdom
- 5.4.3.3 France
- 5.4.3.4 Italy
- 5.4.3.5 Spain
- 5.4.3.6 Nordics
- 5.4.3.7 Rest of Europe
- 5.4.4 South America
- 5.4.4.1 Brazil
- 5.4.4.2 Argentina
- 5.4.4.3 Rest of South America
- 5.4.5 Middle East and Africa
- 5.4.5.1 Saudi Arabia
- 5.4.5.2 United Arab Emirates
- 5.4.5.3 Qatar
- 5.4.5.4 Turkey
- 5.4.5.5 South Africa
- 5.4.5.6 Egypt
- 5.4.5.7 Nigeria
- 5.4.5.8 Rest of Middle East and Africa
- 5.4.1 Asia-Pacific
6 Competitive Landscape
- 6.1 Market Concentration
- 6.2 Strategic Moves
- 6.3 Market Share (%)/Ranking Analysis
- 6.4 Company Profiles (includes Global level Overview, Market level overview, Core Segments, Financials as available, Strategic Information, Market Rank/Share for key companies, Products and Services, and Recent Developments)
- 6.4.1 Acron PJSC
- 6.4.2 BASF SE
- 6.4.3 CF Industries Holdings Inc.
- 6.4.4 CSBP
- 6.4.5 Dyno Nobel
- 6.4.6 EuroChem Group
- 6.4.7 Group DF (Ostchem)
- 6.4.8 Grupa Azoty
- 6.4.9 IFFCO
- 6.4.10 Industries Qatar
- 6.4.11 JSC Togliattiazot
- 6.4.12 Koch Fertilizer, LLC.
- 6.4.13 LSB Industries
- 6.4.14 Nutrien
- 6.4.15 OCI
- 6.4.16 Orica Limited
- 6.4.17 PT Pupuk Sriwidjaja Palembang (Pusri)
- 6.4.18 Rashtriya Chemicals and Fertilizers Limited
- 6.4.19 SABIC
- 6.4.20 Yara
7 Market Opportunities and Future Outlook
- 7.1 Ammonia Refrigeration Retrofitting in Food Retail
- 7.2 Carbon Capture and Storage (CCS) Integration for Blue Ammonia
- 7.3 White-space and Unmet-need Assessment
 无水氨蒸发器市场:按类型、热源、容量、终端用户产业、应用和销售管道,全球预测,2026-2032年
 氨市场分析及预测(至2035年):类型、产品、应用、技术、终端用户、製程、组件、简介
 2026-2034年全球氨市场规模、份额、趋势和成长分析报告
 2026年全球氨市场报告全球蓝色低碳氨市场按产品类型、技术、原料、应用和最终用途产业分類的预测(2026-2032年)数位氨水感测器市场按感测器类型、部署模式、最终用户、应用和销售管道-全球预测,2026-2032年数位氨水监测探头市场:按产品类型、技术、安装类型、应用和销售管道,全球预测(2026-2032年)液态有机氢载体技术市场:依技术、经营模式、应用和最终用途划分-2026-2032年全球预测电子级氨市场按应用、产品类型、终端用户产业和分销管道划分-2026-2032年全球预测蓝氨燃料市场按生产技术、工厂类型、终端用户产业和应用划分-全球预测,2026-2032年