


 |
市场调查报告书
商品编码
1851650
资料湖:市场份额分析、行业趋势、统计数据和成长预测(2025-2030 年)Data Lake - Market Share Analysis, Industry Trends & Statistics, Growth Forecasts (2025 - 2030) |
||||||
※ 本网页内容可能与最新版本有所差异。详细情况请与我们联繫。
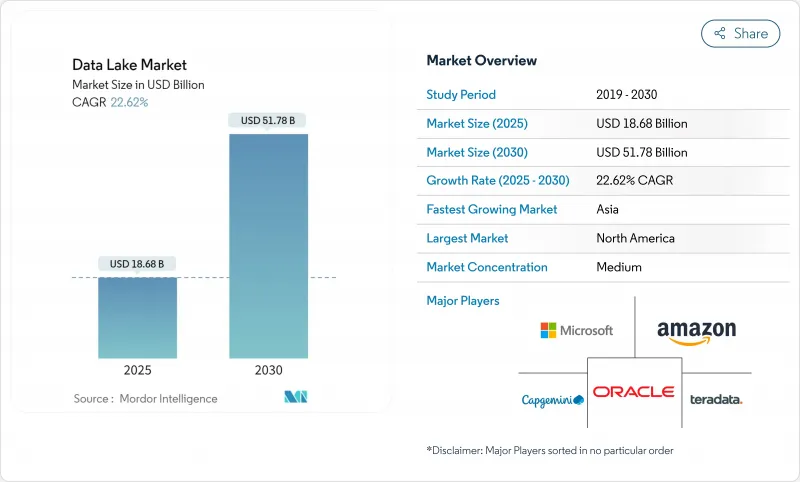
预计到 2025 年,数据湖市场规模将达到 186.8 亿美元,到 2030 年将达到 517.8 亿美元,复合年增长率为 22.62%。
成长的驱动力来自生成式人工智慧管道产生的非结构化资料量呈指数级增长、监管机构不断扩大的记录保存要求,以及向湖仓式架构的转变——这种架构将湖仓和仓库的资源整合到单一层级。财富 500 强企业在采用湖仓式架构后,整体成本降低了 35% 至 40%,而即时 ESG 和风险压力工作负载的应用情境正在扩展到工业和金融领域。无伺服器开放表格式如今已成为多重云端可携性策略的基础,而自动化管治层正在涌现,旨在避免「资料沼泽」的陷阱,同时又不阻碍创新。
全球数据湖市场趋势与洞察
GenAI工作负载驱动下非结构化和多模态资料的爆炸性成长
生成式人工智慧应用会产生大量的图像、音讯和文字数据,这些数据需要基于读取模式的储存。企业预计,到 2025 年,全球 175 Zetta位元组资料空间中将有 30% 需要即时处理,而这种需求并不适合传统的静态资料仓储。谷歌云端的 Lakehouse 蓝图展示了原生格式储存与向量索引结合如何加速底层模型的微调,同时降低储存成本。企业若延迟采用这项技术,可能面临创新週期延长和人工智慧工作负载单位成本上升的风险。
欧洲资料居住要求加速了云端基础湖的普及应用
欧盟的资料管治和资料法律正迫使企业将敏感工作负载在地化。超大规模云端服务供应商正在积极回应:AWS 已投资 78 亿欧元,提供内建资料位置控制功能的独立云端区域。企业目前正在部署区域分段的资料湖,以满足驻留规则,同时透过联合引擎保持查询。
元资料漂移会造成「资料沼泽」。
当资料摄取速度超过目录更新速度时,资料湖就会变成搜寻的储存库。到 2025 年,全球数据量将达到 163 Zetta位元组,这将增加数据孤立且缺乏上下文资讯的风险。企业正在透过采用 Unity Catalog 等自动化血缘追踪工具来应对这项挑战。如果没有类似的控制措施,管治成本可能会抵销湖屋整合带来的预期节省。
细分市场分析
到2024年,解决方案将占资料湖市场收入的70%,届时资料湖市场规模将达到130.8亿美元。企业采用标准化的储存引擎、查询加速器和管治套件是人工智慧环境的基石,这推动了解决方案的主导地位。随着工作负载的不断演变,供应商正在将成本优化仪表板、自动分层储存和原生OpenTable支援等功能捆绑在一起,以保持竞争力。
到2030年,服务子细分市场将以25.8%的复合年增长率成长,反映出市场对迁移蓝图、效能调优和全天候维运服务的需求。由于能够重构传统Hadoop平台的人才短缺,许多企业正在与承诺提供可预测服务等级协议(SLA)的专家签订合约。由于人才市场紧张,专业服务预订量将继续以高于整体资料湖市场成长的速度成长。
到 2024 年,云端部署将占据资料湖市场 65% 的份额,因为企业需要即时扩展性和整合安全性。 Amazon S3 等弹性物件储存透过实现生命週期自动化和冷资料自动分层到低成本层,降低了资本支出。分析引擎可以按需启动,从而使运算成本与计划进度保持一致。
到 2030 年,混合云和多重云端配置的复合年增长率将达到 24%。 OpenTable 格式允许使用单一元元资料定义来覆写本机和公共云端储存桶,从而减少了资料复製的需求。区域合规性法规进一步推动了混合云策略的发展,使企业能够在主权区域内锁定受监管的工作负载,同时透过跨云架构进行查询。因此,混合环境资料湖的市场规模正随着主权云的推出而同步查询。
区域分析
北美地区将占2024年总收入的38%,并在架构成熟度方面持续保持领先地位。金融机构正在延长时间序列资料的保留期限,以适应不断演进的压力测试范本;医院网路正在建立多模态病患图谱,以支援人工智慧主导的诊断。创业投资也鼓励成立专注于管治的Start-Ups,从而确保生态系统的蓬勃发展。
亚太地区是成长最快的区域,预计到2030年将维持24.1%的复合年增长率。日本、印度和新加坡等国政府正在资助主权云端计划,这刺激了对符合区域标准的云湖的需求。中国电信业者正在分析大量的5G日誌以进行容量规划,而印尼的金融科技公司正在共用诈骗情报湖以遏制网路犯罪。像日本Wasabi这样的供应商已经设立了亚太总部,旨在抓住预计36%的IaaS成长机会。
在欧洲严格的资料主权指令下,资料安全技术的采用速度加快。欧洲资料策略鼓励对本地託管进行投资;AWS 将于 2025 年底前在勃兰登堡开设区域以满足居住要求;製造商即时储存范围 3 的排放以用于 CSRD 报告;银行在符合审核要求的「湖」式资料中心中改进巴塞尔协议 III 的计算。欧洲银行管理局 2025 年的压力测试范本进一步强化了「湖」式资料中心必须满足的技术要求。
其他福利:
- Excel格式的市场预测(ME)表
- 3个月的分析师支持
目录
第一章 引言
- 研究假设和市场定义
- 调查范围
第二章调查方法
第三章执行摘要
第四章 市场情势
- 市场概览
- 市场驱动因素
- GenAI工作负载驱动下非结构化和多模态资料的爆炸性成长
- 欧洲的资料驻留强制规定加速了云端基础湖的普及应用
- Lakehouse 融合方案为财富 500 强企业降低 35-40% 的总拥有成本
- 用于多重云端移植的无伺服器表格形式
- 各产业即时ESG范围3资料撷取要求
- 金融服务监管压力测试要求保留长达十年的逐笔交易资料保存
- 市场限制
- 元资料漂移会造成“资料沼泽”,并增加管治成本。
- 新兴地区湖泊工程师短缺
- 对延迟敏感的工作负载仍然更倾向于使用资料仓储而不是资料湖。
- 不透明的基于消费量的云端定价模式使预算预测变得复杂。
- 技术展望
- 波特五力模型
- 供应商的议价能力
- 买方的议价能力
- 新进入者的威胁
- 替代品的威胁
- 竞争对手之间的竞争
第五章 市场规模与成长预测
- 报价
- 解决方案
- 资料发现与目录
- 资料整合和 ETL/ELT
- 分析和视觉化工具
- 管治与安全平台
- 服务
- 专业服务(咨询、整合)
- 託管服务
- 解决方案
- 透过部署
- 云
- 公共云端
- 私有云端
- 混合/多重云端
- 本地部署
- 云
- 按组织规模
- 大公司
- 中小企业
- 按业务职能
- 营运和供应链
- 金融与风险
- 销售与行销
- 人力资源
- 按行业
- 资讯科技和电信
- BFSI
- 医疗保健和生命科学
- 零售与电子商务
- 製造业和工业
- 媒体与娱乐
- 政府/公共部门
- 能源与公共产业
- 其他(教育、酒店管理)
- 按地区
- 北美洲
- 美国
- 加拿大
- 墨西哥
- 南美洲
- 巴西
- 阿根廷
- 智利
- 秘鲁
- 其他南美洲
- 欧洲
- 德国
- 英国
- 法国
- 义大利
- 西班牙
- 其他欧洲地区
- 亚太地区
- 中国
- 日本
- 印度
- 澳洲
- 纽西兰
- 亚太其他地区
- 中东
- 阿拉伯聯合大公国
- 沙乌地阿拉伯
- 土耳其
- 其他中东地区
- 非洲
- 南非
- 其他非洲地区
- 北美洲
第六章 竞争情势
- Strategic Developments
- Vendor Positioning Analysis
- 公司简介
- Amazon Web Services(AWS)
- Microsoft Corporation
- Google LLC
- IBM Corporation
- Oracle Corporation
- Snowflake Inc.
- SAP SE
- Cloudera Inc.
- Teradata Corporation
- Informatica Inc.
- Databricks Inc.
- Hitachi Vantara LLC
- Dell Technologies Inc.
- Atos SE
- SAS Institute Inc.
- Zaloni Inc.
- Dremio Corporation
- Qubole Inc.
- Talend SA
- HPE(Ezmeral)
第七章 市场机会与未来展望
The data lakes market is valued at USD 18.68 billion in 2025 and is on track to reach USD 51.78 billion by 2030, registering a 22.62% CAGR.
Growth stems from surging unstructured data volumes generated by generative-AI pipelines, expanding regulatory record-keeping mandates, and the shift toward lakehouse architectures that collapse lake and warehouse footprints into a single tier. Fortune 500 firms report 35-40% total-cost savings after embracing lakehouses, while real-time ESG and risk-stress workloads are extending use cases into industrial and financial domains. Serverless open-table formats now anchor multi-cloud portability strategies, and automated governance layers are emerging to prevent "swamp" pitfalls without throttling innovation.
Global Data Lake Market Trends and Insights
Explosion of unstructured and multimodal data from GenAI workloads
Generative-AI applications create vast image, audio, and text payloads that demand schema-on-read storage. Enterprises expect 30% of the global 175 zettabyte data sphere to require real-time processing by 2025, a profile unsuited to rigid warehouses. Data lakes therefore become the default landing zone for multi-modal corpora used in prompt-engineering loops.Google Cloud's lakehouse blueprint shows how native-format storage paired with vector indexing accelerates foundation-model fine-tuning while lowering storage bills. Firms delaying adoption risk slower innovation cycles and higher unit-costs on AI workloads.
Data-residency mandates in Europe accelerating cloud-based lake adoption
The EU Data Governance Act and Data Act compel organizations to localize sensitive workloads. Hyperscalers are responding: AWS is investing EUR 7.8 billion in a sovereign-cloud region that ships with embedded data-location controls. Enterprises now deploy region-segmented data lakes that meet residency rules yet remain queryable through federated engines, sparking demand for lineage-rich metadata catalogs capable of surfacing cross-border data usage in audit reports.
Metadata drift creating "data swamps"
When ingestion outpaces catalog updates, data lakes devolve into unsearchable repositories. By 2025, global data volume will reach 163 zettabytes, heightening the risk of siloed files with missing context. Enterprises are responding by adopting automated lineage trackers such as Unity Catalog, which logs every read-write and flags orphaned assets. Without similar controls, governance overhead can erase savings projected from lakehouse consolidation.
Other drivers and restraints analyzed in the detailed report include:
- Lakehouse convergence delivering 35-40% TCO savings
- Serverless table formats unlocking multi-cloud portability
- Skilled lake-engineering talent shortfall in emerging regions
For complete list of drivers and restraints, kindly check the Table Of Contents.
Segment Analysis
Solutions generated 70% of data lakes market revenue in 2024, equating to a data lakes market size of USD 13.08 billion. The dominance comes from enterprises standardizing on storage engines, query accelerators, and governance suites that form the backbone of AI-ready environments. Vendors bundle cost-optimizer dashboards, automated tiering, and native open-table support, maintaining relevance as workloads evolve.
The services sub-segment is racing ahead at a 25.8% CAGR to 2030, reflecting demand for migration blueprints, performance tuning, and 24X7 managed operations. Many firms lack staff who can re-platform legacy Hadoop estates, so they contract specialists that promise predictable SLA outcomes. The tight talent market ensures professional-services bookings will keep growing faster than the overall data lakes market
Cloud deployments captured 65% of the data lakes market share in 2024 as organizations sought instant scalability and integrated security. Elastic object stores like Amazon S3 eliminate CapEx while delivering lifecycle automation that auto-tiers cold data to low-cost classes. Analytics engines then spin up on demand, keeping compute spend aligned with project tempo.
Hybrid and multi-cloud configurations are expanding at 24% CAGR to 2030. Open-table formats let one metadata definition span on-prem and public-cloud buckets, slashing replication needs. Regional compliance rules further fuel hybrid strategies, as firms pin regulated workloads in sovereign regions yet still query them through cross-cloud fabrics. As a result, the data lakes market size for hybrid environments is rising in lockstep with sovereign-cloud launches.
The Data Lakes Market Report is Segmented by Offering (Solutions, and Services), Deployment (Cloud, and Hybrid/Multi-Cloud), Organization Size (Large Enterprises, and SMEs), Business Function (Operations and Supply-Chain, Finance and Risk, and More), End-User Vertical (IT and Telecom, Healthcare and Life Sciences, and More), and Geography (North America, Asia, and More). The Market Forecasts are Provided in Terms of Value (USD).
Geography Analysis
North America generated 38% of 2024 revenue and continues to set benchmarks in architecture maturity. Financial institutions lengthen time-series retention to meet evolving stress-test templates, while hospital networks build multimodal patient graphs that underpin AI-driven diagnostics. Venture capital also fuels governance-start-up formation, ensuring a vibrant ecosystem.
Asia-Pacific is the fastest-expanding region, clocking a 24.1% CAGR through 2030. Governments in Japan, India, and Singapore sponsor sovereign-cloud projects, spurring demand for region-compliant lake zones. Telcos in China analyze massive 5G logs for capacity planning, whereas Indonesian fintechs share fraud-intelligence lakes to curb cybercrime. Vendors establishing APAC headquarters, such as Wasabi in Japan, aim to catch the projected 36% IaaS upturn.
Europe accelerates adoption under strict data-sovereignty mandates. The European Strategy for Data drives investment in local hosting, and AWS will open a Brandenburg region by late 2025 to satisfy residency rules. Manufacturers store real-time Scope-3 emissions for CSRD reporting, and banks refine Basel III calculations inside audit-ready lakes. The European Banking Authority's 2025 stress-test templates reinforce technical requirements that lakehouses fulfill.
- Amazon Web Services (AWS)
- Microsoft Corporation
- Google LLC
- IBM Corporation
- Oracle Corporation
- Snowflake Inc.
- SAP SE
- Cloudera Inc.
- Teradata Corporation
- Informatica Inc.
- Databricks Inc.
- Hitachi Vantara LLC
- Dell Technologies Inc.
- Atos SE
- SAS Institute Inc.
- Zaloni Inc.
- Dremio Corporation
- Qubole Inc.
- Talend SA
- HPE (Ezmeral)
Additional Benefits:
- The market estimate (ME) sheet in Excel format
- 3 months of analyst support
TABLE OF CONTENTS
1 Introduction
- 1.1 Study Assumptions and Market Definition
- 1.2 Scope of the Study
2 Research Methodology
3 Executive Summary
4 Market Landscape
- 4.1 Market Overview
- 4.2 Market Drivers
- 4.2.1 Explosion of Unstructured and Multimodal Data from GenAI Workloads
- 4.2.2 Data-Residency Mandates in Europe Accelerating Cloud-based Lake Adoption
- 4.2.3 Lakehouse Convergence Driving 35-40% TCO Savings for Fortune-500 Firms
- 4.2.4 Serverless Table Formats Unlocking Multi-Cloud Portability
- 4.2.5 Real-Time ESG Scope-3 Data Capture Requirements in Industrial Sector
- 4.2.6 Regulatory Stress-Testing in Financial Services Demanding Decade-Scale Tick Data Retention
- 4.3 Market Restraints
- 4.3.1 Metadata Drift Creating "Data Swamps" and Raising Governance Cost
- 4.3.2 Skilled Lake Engineering Talent Shortfall in Emerging Regions
- 4.3.3 Latency-Sensitive Workloads Still Favoring Warehouses over Lakes
- 4.3.4 Opaque Consumption-Based Cloud Pricing Complicating Budget Forecasts
- 4.4 Technological Outlook
- 4.5 Porter's Five Forces
- 4.5.1 Bargaining Power of Suppliers
- 4.5.2 Bargaining Power of Buyers
- 4.5.3 Threat of New Entrants
- 4.5.4 Threat of Substitutes
- 4.5.5 Intensity of Competitive Rivalry
5 Market Size and Growth Forecasts (Value)
- 5.1 By Offering
- 5.1.1 Solutions
- 5.1.1.1 Data Discovery and Cataloging
- 5.1.1.2 Data Integration and ETL/ELT
- 5.1.1.3 Analytics and Visualization Tools
- 5.1.1.4 Governance and Security Platforms
- 5.1.2 Services
- 5.1.2.1 Professional Services (Consulting, Integration)
- 5.1.2.2 Managed Services
- 5.1.1 Solutions
- 5.2 By Deployment
- 5.2.1 Cloud
- 5.2.1.1 Public Cloud
- 5.2.1.2 Private Cloud
- 5.2.1.3 Hybrid/Multi-Cloud
- 5.2.2 On-Premise
- 5.2.1 Cloud
- 5.3 By Organization Size
- 5.3.1 Large Enterprises
- 5.3.2 Small and Mid-Size Enterprises (SMEs)
- 5.4 By Business Function
- 5.4.1 Operations and Supply-Chain
- 5.4.2 Finance and Risk
- 5.4.3 Sales and Marketing
- 5.4.4 Human Resources
- 5.5 By End-User Vertical
- 5.5.1 IT and Telecom
- 5.5.2 BFSI
- 5.5.3 Healthcare and Life Sciences
- 5.5.4 Retail and E-commerce
- 5.5.5 Manufacturing and Industrial
- 5.5.6 Media and Entertainment
- 5.5.7 Government and Public Sector
- 5.5.8 Energy and Utilities
- 5.5.9 Others (Education, Hospitality)
- 5.6 By Geography
- 5.6.1 North America
- 5.6.1.1 United States
- 5.6.1.2 Canada
- 5.6.1.3 Mexico
- 5.6.2 South America
- 5.6.2.1 Brazil
- 5.6.2.2 Argentina
- 5.6.2.3 Chile
- 5.6.2.4 Peru
- 5.6.2.5 Rest of South America
- 5.6.3 Europe
- 5.6.3.1 Germany
- 5.6.3.2 United Kingdom
- 5.6.3.3 France
- 5.6.3.4 Italy
- 5.6.3.5 Spain
- 5.6.3.6 Rest of Europe
- 5.6.4 Asia-Pacific
- 5.6.4.1 China
- 5.6.4.2 Japan
- 5.6.4.3 India
- 5.6.4.4 Australia
- 5.6.4.5 New Zealand
- 5.6.4.6 Rest of Asia-Pacific
- 5.6.5 Middle East
- 5.6.5.1 United Arab Emirates
- 5.6.5.2 Saudi Arabia
- 5.6.5.3 Turkey
- 5.6.5.4 Rest of Middle East
- 5.6.6 Africa
- 5.6.6.1 South Africa
- 5.6.6.2 Rest of Africa
- 5.6.1 North America
6 Competitive Landscape
- 6.1 Strategic Developments
- 6.2 Vendor Positioning Analysis
- 6.3 Company Profiles (includes Global level Overview, Market level overview, Core Segments, Financials as available, Strategic Information, Products and Services, and Recent Developments)
- 6.3.1 Amazon Web Services (AWS)
- 6.3.2 Microsoft Corporation
- 6.3.3 Google LLC
- 6.3.4 IBM Corporation
- 6.3.5 Oracle Corporation
- 6.3.6 Snowflake Inc.
- 6.3.7 SAP SE
- 6.3.8 Cloudera Inc.
- 6.3.9 Teradata Corporation
- 6.3.10 Informatica Inc.
- 6.3.11 Databricks Inc.
- 6.3.12 Hitachi Vantara LLC
- 6.3.13 Dell Technologies Inc.
- 6.3.14 Atos SE
- 6.3.15 SAS Institute Inc.
- 6.3.16 Zaloni Inc.
- 6.3.17 Dremio Corporation
- 6.3.18 Qubole Inc.
- 6.3.19 Talend SA
- 6.3.20 HPE (Ezmeral)
7 Market Opportunities and Future Outlook
- 7.1 White-space and Unmet-need Assessment
 2026年全球网格资料湖平台市场报告2026年全球资料仓储湖平台市场报告2026年全球资料湖市场报告
 资料湖市场分析及预测(至2035年):按类型、产品类型、服务、技术、组件、应用、部署类型、最终用户和功能划分
 全球资料湖市场规模、份额、趋势和成长分析报告(2026-2034)
 资料湖市场报告:按组件、部署类型、组织规模、业务功能、最终用户产业和地区划分,2026-2034 年资料湖市场-2026-2031年预测
 资料湖市场预测至 2032 年:按组件、部署模型、资料类型、组织规模、最终用户和地区分類的全球分析
 资料湖市场-全球产业规模、份额、趋势、机会和预测,按组件、部署模式、组织规模、业务职能、产业垂直领域、地区和竞争格局细分,2020-2030 年预测
 资料湖市场按组件、部署类型、组织规模、垂直产业和地区划分