


 |
市场调查报告书
商品编码
1851651
Edge Analytics:市场占有率分析、产业趋势、统计数据和成长预测(2025-2030 年)Edge Analytics - Market Share Analysis, Industry Trends & Statistics, Growth Forecasts (2025 - 2030) |
||||||
※ 本网页内容可能与最新版本有所差异。详细情况请与我们联繫。
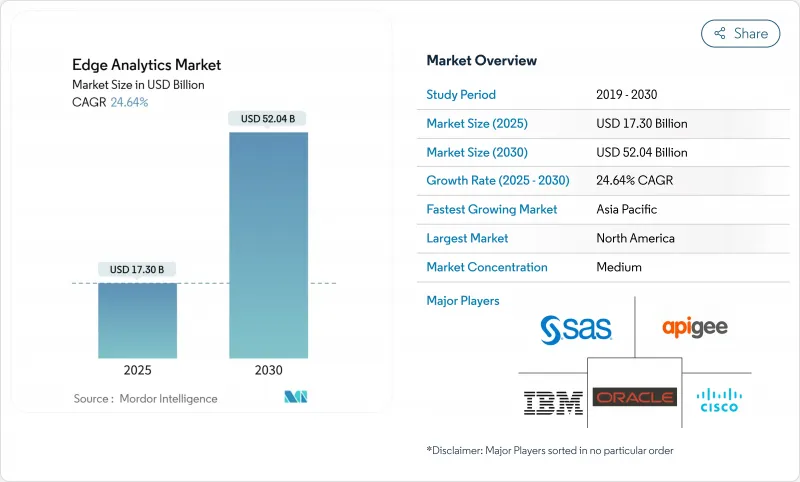
预计到 2025 年,边缘分析市场规模将达到 173 亿美元,到 2030 年将达到 520.4 亿美元,复合年增长率为 24.64%。
物联网终端的快速扩张、5G网路覆盖范围的扩大(支援低延迟资料路径)以及人工智慧晶片技术的持续进步(将推理引擎部署在网路边缘)共同推动了边缘分析市场的成长。供应商正优先考虑坚固耐用的微型资料中心、液冷设计以及联邦学习框架,这些框架能够在训练全局模型的同时,将敏感资料保留在本地。企业也在整合云端原生编配工具,以标准化跨数千个边缘节点的应用传输,从而缩短引进週期并提高投资报酬率。此外,监管机构推动资料主权架构的措施也对边缘分析市场产生了影响,尤其是在医疗保健和金融领域,这些领域必须兼顾即时决策支援和严格的隐私保护要求。
全球边缘分析市场趋势与洞察
物联网终端的激增
全球设备每天产生 3.2877 亿 TB 的数据,迫使分析工作转向本地处理,以节省频宽并提供即时洞察。工业工厂目前透过数百万个感测器传输振动和温度指标,而运行最佳化模型的边缘加速器能够以低于 10 毫秒的延迟处理这些海量数据。随着预测性维护检查的应用范围从重型机械扩展到医疗穿戴式设备,边缘分析市场正在扩大其营运规模,并成为企业数据策略中不可或缺的一部分。
对超低延迟分析的需求
自主机器人、远端手术设备和防碰撞系统需要在 5 毫秒内做出决策。边缘分析技术可以消除 50-150 毫秒的往返时间,从而降低关键任务故障的风险。将缺陷检测演算法从区域资料中心迁移到本地节点的製造商报告称,产量比率提高了两位数,这进一步证明了分散式智慧的商业价值。
持续的资料安全和主权风险
每个边缘网关都存在攻击面,攻击者可以透过实体存取或未修补的韧体来利用这些攻击。医疗服务提供者还需要遵守基于位置的资料居住要求,这推动了可信任执行环境和零信任迭加层的采用,从而实现端对端流量加密。
细分市场分析
预测引擎是边缘分析市场中成长最快的层,年复合成长率高达 25%。此层在基础说明可视性的基础上增加了决策自动化功能,能够在检测到异常情况后推荐最佳应对措施。儘管到 2024 年,说明模组仍将占总收入的 39%,但用户需求显然正在转向能够驱动产出并最大限度降低风险的更高阶洞察。边缘设备现在搭载了紧凑型强化学习代理,可以即时优化机器人分体,这表明这种转变已获得商业性认可。
预测演算法不断弥合当今仪錶板与完全自动化之间的差距。透过关联温度高峰或交通高峰,可以预测维护窗口和库存需求。诊断分析虽然规模较小,但能够揭示根本原因,从而防止问题再次发生。将这些技术堆迭结合起来,供应商可以打包分层服务:以解释性仪錶板作为入门级功能,并为高级用户添加指导性附加元件。因此,边缘分析产业正朝着基于结果的合约模式不断成熟。
到2024年,本地部署节点将占边缘分析市场规模的56%。对于资料敏感型产业而言,本地部署节点仍然是首选,因为这些产业无法汇出个人识别资讯或国家安全资讯。例如,医院网路会在内部管理影像伺服器,以便放射科医生无需外部连结即可存取扫描影像。然而,随着服务供应商推出符合居住规定的区域,云端管理边缘运算正在快速扩张,预计到2030年将以27.5%的复合年增长率成长。
从长远来看,混合拓朴结构正逐渐成为主流。敏感工作负载在本地执行推理,而批量趋势分析则在集中式云端夜间运行。中央主机推送容器更新、协调策略并收集汇总资讯以经营团队仪表板,从而在不牺牲敏捷性的前提下实现控制。减少基础设施重复建设并将运算资源靠近资料来源,既符合预算目标,也符合合规性要求。
边缘分析市场报告按部署类型(本地部署、云端部署)、组件(解决方案、服务)、技术(说明分析、诊断性分析、预测性分析、规范性分析)、最终用户行业(银行、金融服务和保险、IT 和通讯、製造业、医疗保健、零售业、其他)和地区对行业进行分类。
区域分析
北美地区将继续保持领先地位,2024 年将占全球营收的 43%,这主要得益于其成熟的超大规模资料中心布局和早期 5G商业化战略。通讯业者正在将网路覆盖范围扩展到二线都会区,使零售商能够将微型资料中心部署在更靠近郊区门市的位置。政府激励措施鼓励製造商采用智慧工厂计划,并在生产线边缘整合人工智慧主导的製程控制。隐私保护法规仍然对创新持开放态度,前提是加密和审核追踪符合行业标准。政策的明确性正在缩短采购週期,从而支撑医疗保健、零售和能源产业的稳定需求。
亚太地区是成长最快的地区,预计2025年至2030年将以27%的复合年增长率成长。中国正在扩大区域边缘设施的规模,以整合来自智慧交通号誌和工业机器人的感测器数据。日本汽车巨头正在部署预测性品质控制流程以降低返工成本,而印度行动电话营运商则正在利用新的频谱资源,为物流园区推出私人5G网路。跨境资料流动的监管立场各不相同,跨国公司正转向在地化部署,通常使用开放原始码技术堆迭以避免厂商锁定。对国内半导体晶圆厂的投资进一步支持了区域自主供应链的建设,并增强了边缘计划的韧性。
在GDPR和提案的人工智慧责任法的引导下,欧洲正稳步推进人工智慧技术的应用。德国率先开展工业4.0计划,透过OPC UA网关和容器化推理维修传统工厂,力求在创新与风险管治之间取得平衡。法国主导智慧交通试点项目,并利用路边设备的即时视讯分析技术提升公共反应速度。北欧业者优先考虑环保的氢动力边缘站点,以符合ESG(环境、社会和治理)指令。标准化组织正在合作制定安全启动、远端认证和资料交换框架,从而促进互通性,这将惠及更广泛的边缘分析市场。
其他福利:
- Excel格式的市场预测(ME)表
- 3个月的分析师支持
目录
第一章 引言
- 研究假设和市场定义
- 调查范围
第二章调查方法
第三章执行摘要
第四章 市场情势
- 市场概览
- 市场驱动因素
- 物联网终端的激增
- 对超低延迟分析的需求
- 快速部署 5G 可解锁边缘应用程式场景
- 云端原生工具链简化边缘部署
- 设备端协作学习增强资料隐私
- 用于高热密度人工智慧的液冷微型资料中心
- 市场限制
- 持续的资料安全和主权风险
- 与棕地技术系统整合的复杂性
- 微机器学习/边缘人工智慧工程人才短缺
- 分散式运算节点中基于ESG主导的功率限制
- 关键法规结构评估
- 价值链分析
- 技术展望
- 波特五力模型
- 供应商的议价能力
- 买方的议价能力
- 新进入者的威胁
- 替代品的威胁
- 竞争对手之间的竞争
- 关键相关人员影响评估
- 主要用例和案例研究
- 宏观经济因素对市场的影响
- 投资分析
第五章 市场区隔
- 依部署类型
- 本地部署
- 云
- 按组件
- 解决方案
- 服务
- 按最终用户行业划分
- BFSI
- 资讯科技/通讯
- 製造业
- 卫生保健
- 零售
- 其他的
- 透过技术
- 说明分析
- 诊断分析
- 预测分析
- 指示性分析
- 按地区
- 北美洲
- 美国
- 加拿大
- 墨西哥
- 南美洲
- 巴西
- 阿根廷
- 其他南美洲
- 欧洲
- 英国
- 德国
- 法国
- 义大利
- 西班牙
- 北欧国家
- 其他欧洲地区
- 中东和非洲
- 中东
- 沙乌地阿拉伯
- 阿拉伯聯合大公国
- 土耳其
- 其他中东地区
- 非洲
- 南非
- 埃及
- 奈及利亚
- 其他非洲地区
- 亚太地区
- 中国
- 印度
- 日本
- 韩国
- ASEAN
- 澳洲
- 纽西兰
- 亚太其他地区
- 北美洲
第六章 竞争情势
- 市场集中度
- 策略趋势
- 市占率分析
- 公司简介
- Cisco Systems Inc.
- IBM Corporation
- Microsoft Corporation
- Apigee Corporation
- Dell Technologies Inc.
- Intel Corporation
- Oracle Corporation
- SAS Institute Inc.
- Amazon Web Services Inc.
- Google Cloud Platform
- Hewlett Packard Enterprise
- Schneider Electric SE
- Huawei Technologies Co.
- SAP SE
- Siemens AG
- GE Digital
- Foghorn Systems
- Edge Impulse Inc.
- Greenwave Systems
- Predixion Software
- AGT International Inc.
第七章 市场机会与未来展望
The edge analytics market size stands at USD 17.30 billion in 2025 and is on track to reach USD 52.04 billion by 2030, reflecting a 24.64% CAGR.
Growth is propelled by the rapid expansion of IoT end-points, wider 5G coverage that supports low-latency data paths, and ongoing advances in AI-enabled silicon that places inference engines at the network edge. Vendors are prioritizing ruggedized micro-data centers, liquid-cooling designs, and federated learning frameworks that keep sensitive data local while still training global models. Enterprises are also integrating cloud-native orchestration tools to standardize application delivery across thousands of edge nodes, thereby compressing deployment cycles and raising ROI expectations. The edge analytics market is further influenced by regulatory drives toward data-sovereign architectures, especially in healthcare and finance where real-time decision support must coexist with strict privacy mandates.
Global Edge Analytics Market Trends and Insights
Proliferation of IoT end-points
The global device base is generating 328.77 million TB of data every day, forcing analytics to migrate toward local processing so that bandwidth is conserved and insights arrive in real time. Industrial plants now stream vibration and temperature metrics from millions of sensors, and edge accelerators running optimized models handle this influx with sub-10 ms latency. As predictive maintenance checks extend from heavy machinery to medical wearables, the edge analytics market gains a larger operational footprint and becomes an indispensable layer in enterprise data strategy.
Demand for ultra-low-latency analytics
Autonomous robots, tele-surgery rigs, and collision-avoidance systems need decisions within 5 ms, a target unattainable when packets traverse distant clouds. Edge analytics eliminates the 50-150 ms round-trip and lowers the risk of mission-critical failures. Manufacturers that moved defect-detection algorithms from regional data centers to on-site nodes report double-digit yield improvements, reinforcing the business case for distributed intelligence.
Persistent data-security & sovereignty risks
Each edge gateway introduces an attack surface that adversaries can exploit through physical access or unpatched firmware. Finance and healthcare operators must also align with location-based data residency mandates, prompting adoption of trusted execution environments and zero-trust overlays that encrypt traffic end-to-end.
Other drivers and restraints analyzed in the detailed report include:
- Rapid 5G roll-out unlocking edge use-cases
- Cloud-native toolchains simplifying edge deployments
- Integration complexity with brownfield OT systems
For complete list of drivers and restraints, kindly check the Table Of Contents.
Segment Analysis
Prescriptive engines are the fastest-advancing layer in the edge analytics market, growing at a 25% CAGR. They add decision automation to basic descriptive visibility, recommending the next best action once anomalies are detected. In 2024, descriptive modules still held 39% of revenue, but user demand has clearly pivoted toward higher-order insights that lift output and minimize risk. Edge devices now host compact reinforcement-learning agents that optimize robotics pathing on the fly, illustrating the commercial pull behind the transition.
Predictive algorithms remain a bridge between current dashboards and full automation. They enable forecast maintenance windows and inventory needs by correlating temperature spikes or traffic surges. Diagnostic analytics, though smaller, supplies root-cause clarity that prevents recurrence. Together these stacks help vendors package tiered offerings, embedding descriptive dashboards as entry points and layering prescriptive add-ons for premium subscribers. In turn, the edge analytics industry continues to mature toward outcome-based contracting.
On-premises nodes accounted for 56% of the edge analytics market size in 2024. They remain the first choice for data-sensitive sectors that cannot export personally identifiable or national-security information. Hospital networks, for instance, maintain imaging servers in-house so radiologists access scans without traversing external links. However, cloud-managed edges are scaling quicker, charting a 27.5% CAGR to 2030 as providers launch regional zones that meet residency rules.
Hybrid topology is emerging as the long-term norm. Sensitive workloads infer locally while batch trend analytics run in centralized clouds overnight. Central consoles push container updates, harmonize policy, and collect aggregated insights for executive dashboards, thereby delivering control without sacrificing agility. The arrangement reduces infrastructure duplication and keeps compute near data origin, aligning with both budget and compliance targets.
The Edge Analytics Market Report Segments the Industry Into by Deployment Type (On-Premises, and Cloud), Component (Solutions, and Services), Technology (Descriptive Analytics, Diagnostic Analytics, Predictive Analytics, and Prescriptive Analytics), End User Industry (BFSI, IT and Telecommunication, Manufacturing, Healthcare, Retail, and Others), and Geography.
Geography Analysis
North America retained leadership with 43% revenue in 2024 thanks to a mature hyperscale data-center footprint and early 5G monetization strategies. Telcos widened coverage to secondary metros, letting retailers place micro-data centers closer to suburban stores. Government incentives encouraged manufacturers to adopt smart-factory programs, embedding AI-driven process control at the line edge. Privacy rulings remain receptive to innovation provided encryption and audit trails meet industry norms. Policy clarity shortens procurement cycles and underpins steady demand across healthcare, retail, and energy domains.
Asia Pacific is the fastest-growing territory, forecast to log a 27% CAGR during 2025-2030. China scales provincial edge facilities that ingest sensor feeds from smart traffic lights and industrial robotics. Japan's automotive majors deploy predictive quality loops that slice rework costs, while India's mobile operators leverage new spectrum to launch private 5G campuses for logistics parks. Diverse regulatory positions on cross-border data flows push multinationals toward localized deployments, often using open-source stacks to avoid vendor lock-in. Investments in domestic semiconductor fabs further support a self-sustaining regional supply chain and embed resilience into edge projects.
Europe shows robust but measured uptake, guided by GDPR and proposed AI liability laws. Germany pioneers Industrie 4.0 projects that retrofit heritage plants with OPC UA gateways and containerized inference, balancing innovation with risk governance. France leads smart-transport pilots where real-time video analytics on roadside units improve public-safety response times. Nordic operators prioritize green hydrogen-powered edge sites to respect ESG mandates. Standard-setting bodies collaborate on secure boot, remote attestation, and data-exchange frameworks, fostering an interoperability ethos that benefits the wider edge analytics market.
- Cisco Systems Inc.
- IBM Corporation
- Microsoft Corporation
- Apigee Corporation
- Dell Technologies Inc.
- Intel Corporation
- Oracle Corporation
- SAS Institute Inc.
- Amazon Web Services Inc.
- Google Cloud Platform
- Hewlett Packard Enterprise
- Schneider Electric SE
- Huawei Technologies Co.
- SAP SE
- Siemens AG
- GE Digital
- Foghorn Systems
- Edge Impulse Inc.
- Greenwave Systems
- Predixion Software
- AGT International Inc.
Additional Benefits:
- The market estimate (ME) sheet in Excel format
- 3 months of analyst support
TABLE OF CONTENTS
1 INTRODUCTION
- 1.1 Study Assumptions and Market Definition
- 1.2 Scope of the Study
2 RESEARCH METHODOLOGY
3 EXECUTIVE SUMMARY
4 MARKET LANDSCAPE
- 4.1 Market Overview
- 4.2 Market Drivers
- 4.2.1 Proliferation of IoT end-points
- 4.2.2 Demand for ultra-low-latency analytics
- 4.2.3 Rapid 5G roll-out unlocking edge use-cases
- 4.2.4 Cloud-native toolchains simplifying edge deployments
- 4.2.5 On-device federated learning enhancing data privacy
- 4.2.6 Liquid-cooling micro-data-centres enabling thermal-dense AI
- 4.3 Market Restraints
- 4.3.1 Persistent data-security & sovereignty risks
- 4.3.2 Integration complexity with brownfield OT systems
- 4.3.3 Scarcity of tiny-ML / edge-AI engineering talent
- 4.3.4 ESG-driven power-cap caps on distributed compute nodes
- 4.4 Evaluation of Critical Regulatory Framework
- 4.5 Value Chain Analysis
- 4.6 Technological Outlook
- 4.7 Porter's Five Forces
- 4.7.1 Bargaining Power of Suppliers
- 4.7.2 Bargaining Power of Buyers
- 4.7.3 Threat of New Entrants
- 4.7.4 Threat of Substitutes
- 4.7.5 Competitive Rivalry
- 4.8 Impact Assessment of Key Stakeholders
- 4.9 Key Use Cases and Case Studies
- 4.10 Impact on Macroeconomic Factors of the Market
- 4.11 Investment Analysis
5 MARKET SEGMENTATION
- 5.1 By Deployment Type
- 5.1.1 On-Premises
- 5.1.2 Cloud
- 5.2 By Component
- 5.2.1 Solutions
- 5.2.2 Services
- 5.3 By End-User Industry
- 5.3.1 BFSI
- 5.3.2 IT & Telecommunication
- 5.3.3 Manufacturing
- 5.3.4 Healthcare
- 5.3.5 Retail
- 5.3.6 Others
- 5.4 By Technology
- 5.4.1 Descriptive Analytics
- 5.4.2 Diagnostic Analytics
- 5.4.3 Predictive Analytics
- 5.4.4 Prescriptive Analytics
- 5.5 By Geography
- 5.5.1 North America
- 5.5.1.1 United States
- 5.5.1.2 Canada
- 5.5.1.3 Mexico
- 5.5.2 South America
- 5.5.2.1 Brazil
- 5.5.2.2 Argentina
- 5.5.2.3 Rest of South America
- 5.5.3 Europe
- 5.5.3.1 United Kingdom
- 5.5.3.2 Germany
- 5.5.3.3 France
- 5.5.3.4 Italy
- 5.5.3.5 Spain
- 5.5.3.6 Nordics
- 5.5.3.7 Rest of Europe
- 5.5.4 Middle East and Africa
- 5.5.4.1 Middle East
- 5.5.4.1.1 Saudi Arabia
- 5.5.4.1.2 United Arab Emirates
- 5.5.4.1.3 Turkey
- 5.5.4.1.4 Rest of Middle East
- 5.5.4.2 Africa
- 5.5.4.2.1 South Africa
- 5.5.4.2.2 Egypt
- 5.5.4.2.3 Nigeria
- 5.5.4.2.4 Rest of Africa
- 5.5.5 Asia-Pacific
- 5.5.5.1 China
- 5.5.5.2 India
- 5.5.5.3 Japan
- 5.5.5.4 South Korea
- 5.5.5.5 ASEAN
- 5.5.5.6 Australia
- 5.5.5.7 New Zealand
- 5.5.5.8 Rest of Asia-Pacific
- 5.5.1 North America
6 COMPETITIVE LANDSCAPE
- 6.1 Market Concentration
- 6.2 Strategic Moves
- 6.3 Market Share Analysis
- 6.4 Company Profiles (includes Global level Overview, Market level overview, Core Segments, Financials as available, Strategic Information, Market Rank/Share for key companies, Products and Services, and Recent Developments)
- 6.4.1 Cisco Systems Inc.
- 6.4.2 IBM Corporation
- 6.4.3 Microsoft Corporation
- 6.4.4 Apigee Corporation
- 6.4.5 Dell Technologies Inc.
- 6.4.6 Intel Corporation
- 6.4.7 Oracle Corporation
- 6.4.8 SAS Institute Inc.
- 6.4.9 Amazon Web Services Inc.
- 6.4.10 Google Cloud Platform
- 6.4.11 Hewlett Packard Enterprise
- 6.4.12 Schneider Electric SE
- 6.4.13 Huawei Technologies Co.
- 6.4.14 SAP SE
- 6.4.15 Siemens AG
- 6.4.16 GE Digital
- 6.4.17 Foghorn Systems
- 6.4.18 Edge Impulse Inc.
- 6.4.19 Greenwave Systems
- 6.4.20 Predixion Software
- 6.4.21 AGT International Inc.
7 MARKET OPPORTUNITIES AND FUTURE OUTLOOK
- 7.1 White-space and Unmet-need Assessment
 边缘分析市场 - 2026-2031 年预测
 边缘分析市场,全球预测至 2032 年:按组件、部署模式、组织规模、应用、最终用户和地区划分
 边缘分析市场规模、份额和成长分析(按类型、组件、部署类型、应用、最终用途和地区划分)-2026-2033年产业预测
 边缘分析市场按组件、应用、部署类型和行业划分 - 全球预测 2025-2032 年
 边缘分析市场规模、份额、趋势分析报告:按类型、组件、部署模型、应用、产业、地区、细分预测,2025-2030 年全球 SQL记忆体内市场规模(按类型、应用、地区、范围和预测)
 全球边缘分析市场,2024-2028