


 |
市场调查报告书
商品编码
1851657
服务提供自动化:市场占有率分析、产业趋势、统计数据和成长预测(2025-2030 年)Service Delivery Automation - Market Share Analysis, Industry Trends & Statistics, Growth Forecasts (2025 - 2030) |
||||||
※ 本网页内容可能与最新版本有所差异。详细情况请与我们联繫。
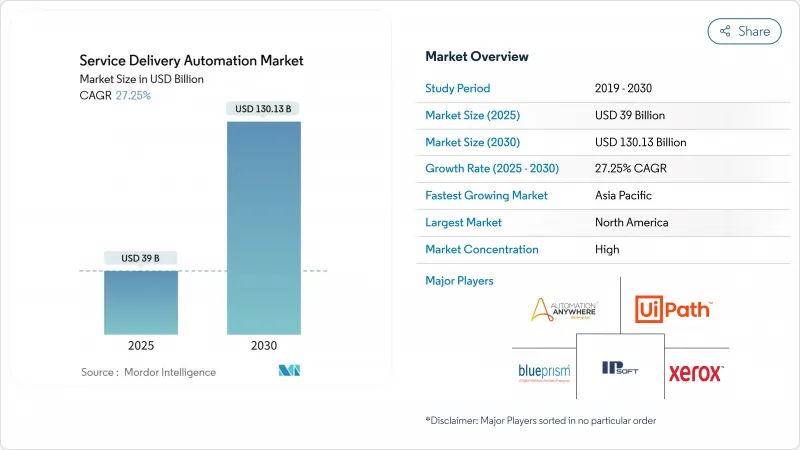
预计到 2025 年,服务提供自动化市场规模将达到 390 亿美元,到 2030 年将达到 1,301.3 亿美元,年复合成长率为 27.25%。
企业寻求降低营运成本、缩短週期时间并提高面向客户和后勤部门流程的准确性,是推动市场需求的主要因素。超自动化(RPA、AI 和低程式码工具的结合)的应用场景正从执行简单任务扩展到认知决策,推动其从最初的试点阶段发展到企业级推广。随着主流平台整合生成式 AI、降低整体拥有成本并转向基于使用量的云端交付模式,供应商之间的竞争日益激烈。北美地区的投资额最高,而亚太地区则呈现最强劲的成长势头,当地服务中心和数位化优先的中小企业正在大规模采用云端自动化。
全球服务提供自动化市场趋势与洞察
需要削减成本
随着企业不断推动劳力密集、高容量工作流程的自动化,每个流程的平均成本节省可达 30% 至 40%。采用 RPA 的银行通常在第一年就能获得 3 至 10 倍的投资报酬率,且异常处理错误显着减少。一家平台供应商的内部调查显示,88% 的员工表示,在重复性任务自动化后,他们的工作满意度有所提高,这表明成本节约与员工体验提升之间存在着密切的联繫。这种趋势在银行、金融服务和保险 (BFSI)、通讯以及共享服务中心等行业尤其明显,这些行业的薪资差距通常较大。
营运效率和服务等级协定 (SLA) 要求
日益严格的服务水准目标迫使企业加快流程週期,同时减少返工。实施服务提供自动化的财务管理团队报告称,报告错误减少了 90%,结帐速度比传统人工方法快 85 倍。依赖快速问题解决的订阅制企业也能从客户回应指标中获益,因为自动化分诊机器人可以在几分钟内解决服务工单。
熟练的自动化架构师短缺
认知自动化计划需要多学科人才,包括程式工程、资料科学和风险控制。然而,由于需求远超培训能力,高阶架构师仍供不应求,导致高价值配置延迟,迫使企业聘请昂贵的顾问。低程式码公民开发人员工具有所帮助,但复杂的跨系统编配仍然依赖经验丰富的架构师。
细分市场分析
在完善的运作手册脚本和清晰的投资报酬率 (ROI) 基准的驱动下,IT 流程自动化将在 2024 年占据服务提供自动化市场 56% 的份额。服务台团队若能实现密码重设、备份检查和事件路由的自动化,可将平均解决时间缩短高达 40%。同时,认知/人工智慧自动化领域正以 40.20% 的复合年增长率 (CAGR) 高速成长,这得益于大规模语言模型和影像分析技术的进步,这些技术使机器人能够解读非结构化输入。保险公司目前正在部署认知机器人来评估理赔文件并即时标记异常情况,从而提高效率并开拓新的收入来源。随着企业将人工智慧迭加到其底层 RPA 资产上,服务提供自动化市场预测将出现一个以智慧编配为中心的平台更新周期。
这种演进正在改变采购标准。买家现在寻求的是能够在单一授权下整合任务自动化、决策支援和持续学习的解决方案。供应商透过整合原生人工智慧或与超大规模人工智慧服务商合作来应对这一需求,从而形成一种融合趋势,将支出从仅包含脚本的小众工具转向整合套件。因此,服务提供自动化市场正朝着更少但覆盖面更广的配置,在单一管治框架下同时满足IT和业务营运的需求。
到2024年,软体平台将占总收入的61.56%。这些平台目前整合了电脑视觉、流程挖掘和管治主机等功能,以加速价值验证的建构。然而,预计服务将以15.00%的复合年增长率超越软体。随着自动化扩展到数百个流程,企业需要蓝图设计、变更管理、机器人健康监控和持续改进计划,而这些内容内部团队难以应对。因此,顾问公司和系统整合商正在整合价值评估框架、公民开发人员赋能框架和卓越中心营运框架。由此,服务提供自动化市场的预算结构正稳步从纯粹的授权转向持续的託管服务。
託管服务领域的服务提供自动化市场规模正在迅速扩张,尤其是在那些持续合规性测试和审核日誌记录必不可少的监管行业。供应商现在提供「自动化即服务」模式,并制定了涵盖服务等级协定 (SLA) 合规性、版本升级和安全性修补程式的责任共用矩阵。这种订阅式服务对缺乏内部 IT 维运团队但仍需要企业级可靠性的中小型企业极具吸引力。
服务提供自动化市场报告按类型(IT流程自动化、业务流程自动化、其他)、组件(软体平台、服务)、部署模式(本地部署、云端部署)、组织规模(大型企业、中小企业)、最终用户垂直行业(银行、金融服务和保险、IT服务、通讯和媒体、其他)和地区对产业进行分类。
区域分析
北美仍然是服务提供自动化市场最大的中心,这得益于其高昂的人事费用、成熟的云端基础设施以及主要平台供应商的总部所在地。金融机构和医疗保健系统引领这一趋势,它们通常会整合认知机器人和分析技术来预测异常情况,并在服务等级协定 (SLA) 违约发生之前加以预防。生成式人工智慧实验十分普遍,一些公司正在试行大规模语言模型,用于撰写法律摘要和合规性说明。
亚太地区是成长最快的区域。印度和菲律宾正在建立全球服务中心,试图透过利用数位化员工来降低人事费用;与此同时,中国保险公司正在推动理赔自动化,以应对保单数量的激增。政府对智慧製造和物流数位化的奖励策略正在推动仓库自动化,而仓库自动化依赖编配机器人来调度自动导引车(AGV)。本地供应商正在提供价格敏感型捆绑产品,以加速其在东协市场中型企业的渗透。
在欧洲,我们看到北欧和西方经济体正在稳步采用自动化技术。欧盟的《一般资料保护规则)要求企业建立控制机制,记录所有机器人操作,并将自动化流程与审核追踪结合。德国和比荷卢经济联盟的製造企业集团正在实现现场报告的自动化,北欧公共机构正在部署聊天机器人,以多种语言处理公民咨询。各方都在谨慎决策。 IT 支出方倾向于投资报酬率透明的计划,推动分阶段推广,而分阶段推广仍是整体服务提供自动化市场的重要组成部分。
其他福利:
- Excel格式的市场预测(ME)表
- 3个月的分析师支持
目录
第一章 引言
- 研究假设和市场定义
- 调查范围
第二章调查方法
第三章执行摘要
第四章 市场情势
- 市场概览
- 市场驱动因素
- 需要削减成本
- 对营运效率和服务水准协议的需求
- 数位优先和云端优先转型
- RPA平台成熟度和更低的整体拥有成本
- 超自动化融合(iPaaS+RPA+LCAP)
- 生成式人工智慧副驾驶赋能公民开发者
- 市场限制
- 熟练的自动化架构师短缺
- 高昂的初始整合和变更管理成本
- 多租户工作流程中的安全性和合规性漏洞
- 自动化能耗的ESG审查
- 关键法规结构评估
- 价值链分析
- 技术展望
- 波特五力模型
- 供应商的议价能力
- 买方的议价能力
- 新进入者的威胁
- 替代品的威胁
- 竞争对手之间的竞争
- 关键相关人员影响评估
- 主要用例和案例研究
- 宏观经济因素对市场的影响
- 投资分析
第五章 市场区隔
- 按类型
- IT流程自动化
- 业务流程自动化
- 机器人流程自动化
- 基于认知/人工智慧的自动化
- 按组件
- 软体平台
- 服务(咨询、整合、支援)
- 透过部署模式
- 本地部署
- 云
- 杂交种
- 按组织规模
- 大公司
- 小型企业
- 按最终用户行业划分
- 银行、金融服务和保险(BFSI)
- 资讯科技服务
- 通讯与媒体
- 医疗保健和製药
- 零售和消费品
- 製造与物流
- 饭店和交通运输
- 其他行业
- 按地区
- 北美洲
- 美国
- 加拿大
- 墨西哥
- 南美洲
- 巴西
- 阿根廷
- 其他南美洲
- 欧洲
- 英国
- 德国
- 法国
- 义大利
- 西班牙
- 北欧国家
- 其他欧洲地区
- 中东和非洲
- 中东
- 沙乌地阿拉伯
- 阿拉伯聯合大公国
- 土耳其
- 其他中东地区
- 非洲
- 南非
- 埃及
- 奈及利亚
- 其他非洲地区
- 亚太地区
- 中国
- 印度
- 日本
- 韩国
- ASEAN
- 澳洲
- 纽西兰
- 亚太其他地区
- 北美洲
第六章 竞争情势
- 市场集中度
- 策略趋势
- 市占率分析
- 公司简介
- UiPath SRL
- Automation Anywhere Inc.
- IBM Corporation
- Blue Prism Ltd
- NICE Ltd
- IPsoft Inc.
- Xerox Holdings Corporation
- Celaton Limited
- Arago GmbH
- Accenture plc
- AutomationEdge Technologies
- Pegasystems Inc.
- Microsoft Corporation
- SAP SE
- ServiceNow Inc.
- WorkFusion Inc.
- Kofax Inc.
- Cognizant Technology Solutions
- Infosys Ltd
- Tech Mahindra Ltd
第七章 市场机会与未来展望
The service delivery automation market is valued at USD 39 billion in 2025 and is projected to grow at a 27.25% CAGR, reaching USD 130.13 billion by 2030.
Demand stems from enterprises seeking lower operating costs, faster cycle times, and higher accuracy across customer-facing and back-office processes. Hyperautomation- the combination of RPA, AI, and low-code tools- is expanding use cases from simple task execution to cognitive decision making, pushing adoption beyond early pilots into enterprise-wide rollouts. Vendor competition is intensifying as leading platforms embed generative AI, reducing total cost of ownership,, and shifting to usage-based cloud delivery. North America accounts for the largest regional spend, yet Asia-Pacific shows the steepest growth curve as local service centers and digital-first SMEs embrace cloud automation at scale.
Global Service Delivery Automation Market Trends and Insights
Cost-reduction imperative
Enterprises continue to automate labor-intensive, high-volume workflows and record average savings of 30-40% per process. Banks that deploy RPA often earn 3-10 times ROI in year one and cut exception-handling errors markedly. Internal surveys by platform vendors reveal that 88% of employees experience higher job satisfaction after repetitive tasks are automated, signaling that cost savings align with workforce experience gains. This sentiment is strongest in BFSI, telecommunications and shared service centers where wage differentials are high.
Operational efficiency and SLA demand
Tighter service-level targets have forced organizations to accelerate process cycle times while reducing rework. Financial control teams that add service delivery automation report 90% fewer reporting errors and close books up to 85 times faster than previously manual workflows. Customer response metrics also benefit: automated triage bots resolve service tickets within minutes, boosting retention in subscription-based businesses where renewal hinges on rapid issue resolution.
Skilled automation architect scarcity
Cognitive automation projects require multi-disciplinary talent covering process engineering, data science and risk controls. Yet senior architects remain in short supply as demand outpaces training pipelines, delaying high-value deployments and forcing companies to contract premium-priced consultants. Low-code citizen-developer tooling helps, but complex cross-system orchestration still relies on experienced designers.
Other drivers and restraints analyzed in the detailed report include:
- Digital-first and cloud-first transformation
- RPA maturity and lower TCO
- High up-front integration and change-management cost
For complete list of drivers and restraints, kindly check the Table Of Contents.
Segment Analysis
IT Process Automation held 56% of service delivery automation market share in 2024 owing to well-defined run-book scripts and clear ROI benchmarks. Service desk teams that automate password resets, backup checks and incident routing cut mean-time-to-resolve by up to 40%. In parallel, the Cognitive/AI-based Automation segment is expanding at a 40.20% CAGR, fueled by advances in large language models and image analytics that let bots interpret unstructured inputs. Underwriters now deploy cognitive bots to assess claim documents and flag anomalies in real time, unlocking new revenue streams alongside efficiency wins. As firms layer AI onto foundational RPA estates, the service delivery automation market anticipates a platform refresh cycle centred on intelligent orchestration.
This evolution changes purchasing criteria. Buyers increasingly seek solutions that combine task automation, decision support and continuous learning inside one license. Vendors respond by embedding native AI or partnering with hyperscale AI services, creating a convergence that shifts spend away from niche script-only tools toward unified suites. The service delivery automation market is therefore tilting toward fewer but broader deployments that serve both IT and business operations under a single governance framework.
Software Platforms represented 61.56% of 2024 revenue because every automation journey begins with a licence. These platforms now ship with built-in computer vision, process mining and governance consoles that accelerate proof-of-value builds. However, Services are projected to outpace software at a 15.00% CAGR. As automation scales to hundreds of processes, enterprises need roadmap design, change management, bot health monitoring, and continuous improvement programs that internal teams struggle to absorb. Consulting firms and system integrators thus bundle frameworks for value assessment, citizen-developer enablement and center-of-excellence operation. The result is a steady shift in budget mix from pure licences toward ongoing managed services inside the service delivery automation market.
The service delivery automation market size for managed services is expanding particularly fast in regulated industries where continuous compliance testing and audit logs are mandatory. Vendors now offer "automation-as-a-service" models with shared responsibility matrices covering SLA adherence, version upgrades and security patching. This subscription-oriented delivery appeals to SMEs that lack an internal IT operations bench yet want enterprise-grade reliability.
The Service Delivery Automation Market Report Segments the Industry Into by Type (IT Process Automation, Business Process Automation, and More), Component (Software Platforms, and Services), Deployment Mode (On-Premise, and Cloud), Organization Size (Large Enterprises, and Small and Medium Enterprises), End-User Industry (BFSI, Information Technology Services, Telecommunications and Media, and More), and Geography.
Geography Analysis
North America remains the largest hub for the service delivery automation market, supported by high labor costs, mature cloud infrastructure and headquarters of leading platform vendors. Financial institutions and healthcare systems spearhead adoption, often integrating cognitive bots with analytics to predict exceptions and pre-empt SLA breaches. Generative AI experimentation is widespread, with firms piloting large language models to draft legal summaries and compliance narratives.
Asia-Pacific records the steepest growth trajectory. India and the Philippines host global service centers keen to reduce attrition costs through digital workers, while Chinese insurers automate claims to manage surging policy volumes. Government stimulus for smart manufacturing and logistics digitization fuels warehouse automation that relies on orchestration bots to schedule AGVs. Local vendors offer price-sensitive bundles, accelerating penetration into medium-sized enterprises across ASEAN markets.
Europe exhibits steady uptake across Northern and Western economies. The EU's General Data Protection Regulation prompts businesses to embed controls that log every bot action, aligning automation with audit trails. Manufacturing conglomerates in Germany and Benelux automate shop-floor reporting, while public agencies in the Nordics deploy chatbots to handle citizen queries in multiple languages. Decision making is cautious: IT spending favors projects with transparent payback, driving phased roll-outs that still contribute significant volume to the overall service delivery automation market.
- UiPath SRL
- Automation Anywhere Inc.
- IBM Corporation
- Blue Prism Ltd
- NICE Ltd
- IPsoft Inc.
- Xerox Holdings Corporation
- Celaton Limited
- Arago GmbH
- Accenture plc
- AutomationEdge Technologies
- Pegasystems Inc.
- Microsoft Corporation
- SAP SE
- ServiceNow Inc.
- WorkFusion Inc.
- Kofax Inc.
- Cognizant Technology Solutions
- Infosys Ltd
- Tech Mahindra Ltd
Additional Benefits:
- The market estimate (ME) sheet in Excel format
- 3 months of analyst support
TABLE OF CONTENTS
1 INTRODUCTION
- 1.1 Study Assumptions and Market Definition
- 1.2 Scope of the Study
2 RESEARCH METHODOLOGY
3 EXECUTIVE SUMMARY
4 MARKET LANDSCAPE
- 4.1 Market Overview
- 4.2 Market Drivers
- 4.2.1 Cost-reduction Imperative
- 4.2.2 Demand for Operational Efficiency and SLAs
- 4.2.3 Digital-First and Cloud-first Transformation
- 4.2.4 RPA Platform Maturity and Lower TCO
- 4.2.5 Hyperautomation Convergence (iPaaS + RPA + LCAP)
- 4.2.6 Generative-AI Copilots Enabling Citizen Developers
- 4.3 Market Restraints
- 4.3.1 Scarcity of Skilled Automation Architects
- 4.3.2 High Up-front Integration and Change-management Cost
- 4.3.3 Multitenant Workflow Security and Compliance Gaps
- 4.3.4 ESG Scrutiny on Automation Energy Footprint
- 4.4 Evaluation of Critical Regulatory Framework
- 4.5 Value Chain Analysis
- 4.6 Technological Outlook
- 4.7 Porter's Five Forces
- 4.7.1 Bargaining Power of Suppliers
- 4.7.2 Bargaining Power of Buyers
- 4.7.3 Threat of New Entrants
- 4.7.4 Threat of Substitutes
- 4.7.5 Competitive Rivalry
- 4.8 Impact Assessment of Key Stakeholders
- 4.9 Key Use Cases and Case Studies
- 4.10 Impact on Macroeconomic Factors of the Market
- 4.11 Investment Analysis
5 MARKET SEGMENTATION
- 5.1 By Type
- 5.1.1 IT Process Automation
- 5.1.2 Business Process Automation
- 5.1.3 Robotic Process Automation
- 5.1.4 Cognitive/AI-based Automation
- 5.2 By Component
- 5.2.1 Software Platforms
- 5.2.2 Services (Consulting, Integration, Support)
- 5.3 By Deployment Mode
- 5.3.1 On-premise
- 5.3.2 Cloud
- 5.3.3 Hybrid
- 5.4 By Organization Size
- 5.4.1 Large Enterprises
- 5.4.2 Small and Medium Enterprises
- 5.5 By End-user Industry
- 5.5.1 Banking, Financial Services and Insurance (BFSI)
- 5.5.2 Information Technology Services
- 5.5.3 Telecommunications and Media
- 5.5.4 Healthcare and Pharmaceuticals
- 5.5.5 Retail and Consumer Goods
- 5.5.6 Manufacturing and Logistics
- 5.5.7 Hospitality and Transportation
- 5.5.8 Other Industries
- 5.6 By Geography
- 5.6.1 North America
- 5.6.1.1 United States
- 5.6.1.2 Canada
- 5.6.1.3 Mexico
- 5.6.2 South America
- 5.6.2.1 Brazil
- 5.6.2.2 Argentina
- 5.6.2.3 Rest of South America
- 5.6.3 Europe
- 5.6.3.1 United Kingdom
- 5.6.3.2 Germany
- 5.6.3.3 France
- 5.6.3.4 Italy
- 5.6.3.5 Spain
- 5.6.3.6 Nordics
- 5.6.3.7 Rest of Europe
- 5.6.4 Middle East and Africa
- 5.6.4.1 Middle East
- 5.6.4.1.1 Saudi Arabia
- 5.6.4.1.2 United Arab Emirates
- 5.6.4.1.3 Turkey
- 5.6.4.1.4 Rest of Middle East
- 5.6.4.2 Africa
- 5.6.4.2.1 South Africa
- 5.6.4.2.2 Egypt
- 5.6.4.2.3 Nigeria
- 5.6.4.2.4 Rest of Africa
- 5.6.5 Asia-Pacific
- 5.6.5.1 China
- 5.6.5.2 India
- 5.6.5.3 Japan
- 5.6.5.4 South Korea
- 5.6.5.5 ASEAN
- 5.6.5.6 Australia
- 5.6.5.7 New Zealand
- 5.6.5.8 Rest of Asia-Pacific
- 5.6.1 North America
6 COMPETITIVE LANDSCAPE
- 6.1 Market Concentration
- 6.2 Strategic Moves
- 6.3 Market Share Analysis
- 6.4 Company Profiles (includes Global level Overview, Market level overview, Core Segments, Financials as available, Strategic Information, Market Rank/Share for key companies, Products and Services, and Recent Developments)
- 6.4.1 UiPath SRL
- 6.4.2 Automation Anywhere Inc.
- 6.4.3 IBM Corporation
- 6.4.4 Blue Prism Ltd
- 6.4.5 NICE Ltd
- 6.4.6 IPsoft Inc.
- 6.4.7 Xerox Holdings Corporation
- 6.4.8 Celaton Limited
- 6.4.9 Arago GmbH
- 6.4.10 Accenture plc
- 6.4.11 AutomationEdge Technologies
- 6.4.12 Pegasystems Inc.
- 6.4.13 Microsoft Corporation
- 6.4.14 SAP SE
- 6.4.15 ServiceNow Inc.
- 6.4.16 WorkFusion Inc.
- 6.4.17 Kofax Inc.
- 6.4.18 Cognizant Technology Solutions
- 6.4.19 Infosys Ltd
- 6.4.20 Tech Mahindra Ltd
7 MARKET OPPORTUNITIES AND FUTURE OUTLOOK
- 7.1 White-space and Unmet-need Assessment


