


 |
市场调查报告书
商品编码
1851713
智慧废弃物管理:市场占有率分析、产业趋势、统计数据和成长预测(2025-2030 年)Smart Waste Management - Market Share Analysis, Industry Trends & Statistics, Growth Forecasts (2025 - 2030) |
||||||
※ 本网页内容可能与最新版本有所差异。详细情况请与我们联繫。
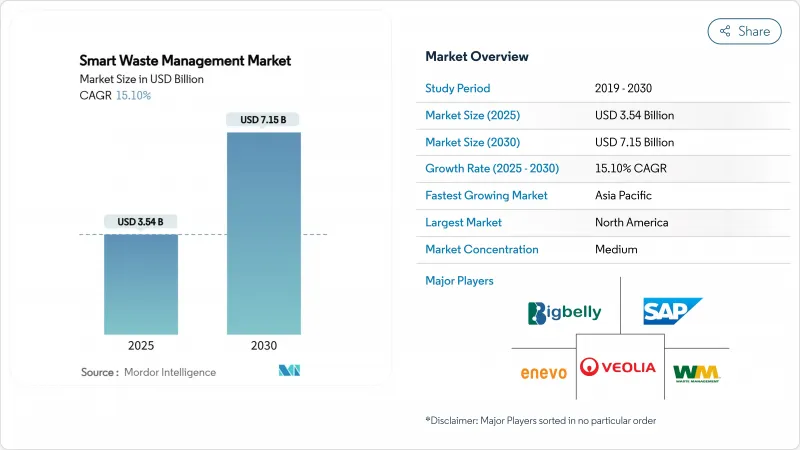
预计到 2025 年,智慧废弃物管理市场规模将达到 35.4 亿美元,到 2030 年将成长至 71.5 亿美元,在此期间的复合年增长率为 15.1%。
快速的都市化、日益严格的碳排放法规以及掩埋的垃圾掩埋费,使得数据驱动的废弃物服务成为城市的一项必要支出,而非可有可无的升级选项。物联网感测器价格的下降、5G和低功耗广域网路(LPWAN)覆盖范围的扩大以及人工智慧平台的日趋成熟,使得即时垃圾收集过程得以可视化,这不仅有助于城市降低燃料成本,还能展现其对循环经济法规的遵守。碳信用计画如今已将回收的有机垃圾货币化,而计量收费模式则为城市提供了新的经常性收入来源。创业投资人正将大量资金投入人工智慧机器人分类新兴企业,而现有垃圾运输企业也正在加速整合以确保技术实力,从而创造出一个创新与规模并存的平衡环境。
全球智慧废弃物管理市场趋势与洞察
数据主导的路线优化可降低燃油消耗
即时料位感测器和人工智慧路线规划引擎可将车辆行驶里程减少 25%,柴油消费量减少 10%。动态路线规划避免了清空半满箱的习惯,从而在保持正常服务的同时,减少了交通拥堵和二氧化碳排放。车队管理人员更倾向于使用能够视觉化预测料位曲线的云端仪錶板,以便工作人员仅在有利时才离开料场。该模型在人口密集的都市区网格和郊区都能灵活扩展,因此对预算紧张的公共部门极具吸引力。随着碳定价机制的日益普及,检验的燃油节省量还可以转化为可交易的排碳权,进一步增强了基于感测器的最佳化技术的投资价值。
小费制度可提高地方政府的投资报酬率
马萨诸塞州和缅因州的城镇采用按量付费(PAYT)模式,已将垃圾吨位减少了44%,并将垃圾收集成本从房产税转移到了用户直接付费。安装在垃圾桶上的荷重元会传输重量数据,计费系统会将这些数据转换为家庭帐单,从而形成一个透明的回馈循环,鼓励居民进行垃圾回收。财务负责人讚赏该模式将服务使用量与成本回收挂钩,从而稳定预算;而环保人士则强调了仅对产生的废弃物收费所带来的社会公平效益。该系统能够产生稳定的现金流,这些现金流可以再投资于感测器部署和回收基础设施建设,从而在智慧废弃物管理市场中形成减少废弃物和增强财务韧性的良性循环。
老旧车辆的维修成本很高
对感测器、远端资讯处理系统、液压系统和称重感测器进行全面升级,每辆卡车的成本可能高达 25,000 美元,这给市政财政造成了巨大压力,尤其是在依赖老旧车队的较小辖区。分散的驾驶室布局和专有的车载电脑需要定制接口,这延长了安装週期并推高了人事费用。这迫使城市根据车辆更换週期分阶段部署,从而抑制了依赖数据密度的网路效应。供应商推出了将硬体摊销打包到月费中的订阅模式,但资产负债表的限制导致采用率不均衡,抑制了智慧废弃物管理市场各细分领域的成长潜力。
细分市场分析
到2024年,分析和彙报将占智慧废弃物管理市场32%的份额,到2030年将以17.21%的复合年增长率成长。城市正逐渐采用云端仪錶板,将原始感测器读数转化为易于理解的关键绩效指标(KPI),例如漏收警报、每吨垃圾的燃油消费量和温室气体减排量。预测模型整合了历史收集趋势、天气模式和事件日历,提前数天安排动态路线,从而提高卡车运转率和居民满意度。车队管理模组迭加即时GPS轨迹和诊断警报,最大限度地减少计划外停机时间,延长资产使用寿命。行动工作人员工具则为驾驶室平板电脑提供逐嚮导航更新,从而在分析洞察和现场执行之间形成反馈闭环。
不同解决方案支柱的整合产生了协同效应:资产管理引擎根据行人足迹资料推荐最佳垃圾箱摆放位置;远端监控系统可对威胁回收品质的污染事件发出警报;人工智慧视讯分析可检测非法倾倒事件并将带有地理标记的证据传输给执法部门。这种跨模组工作流程增加了供应商的转换成本,从而巩固了供应商的地位并提高了合约总额,进而支撑了智慧废弃物管理市场强劲的收入成长动能。
预计到2024年,软体产品将占智慧废弃物管理市场规模的41%,并在2030年之前以20.11%的复合年增长率加速成长,因为市政当局为了避免巨额资本支出而采用订阅定价模式。云端架构提供无线功能更新和网路安全补丁,无需现场维护。供应商API可实现与城市ERP系统、碳排放登记系统和市民报告应用程式的即插即用连接,从而释放网路效应,扩大目标用户群。虽然硬体仍然是资料收集的核心,但通用感测器的价格逐年下降,使得支出结构向软体功能和增值分析方向转变。
随着整合商制定变革管理蓝图、培训员工并监控资料品质仪錶盘,服务收入也同步成长。託管服务协议将保障、分析最佳化和合规性报告打包成可预测的月费,使供应商的奖励与客户的最终成果保持一致。这种经常性收入模式吸引了私募股权的投资兴趣,并推动了产业整合,重塑了智慧废弃物管理市场的竞争格局。
智慧废弃物管理系统市场报告按解决方案(车队管理、远端监控、分析、其他)、组件(硬体、软体、其他)、废弃物类型(工业废弃物、生活废弃物、其他)、应用(智慧收集、智慧处理、其他)、部署(云端基础、本地部署)和地区进行细分。
区域分析
到2024年,北美将占据智慧废弃物管理市场38%的份额,这主要得益于成熟的通讯网路、早期碳定价机制以及联邦政府津贴智慧城市部署而提供的基础设施津贴。 Big Belly公司的太阳能小型垃圾桶已展现出显着的成本节约优势,在纽约和波士顿等地,垃圾收集量减少了高达80%。加拿大的有机物分流抵销通讯协定允许像SusGlobal位于贝尔维尔的工厂这样的计划将10.5万个检验信用额度货币化,从而缩短投资回收期。此外,区域卡车运输公司也正在利用《通货膨胀削减法案》提供的清洁车队税额扣抵,加速电动卡车与感测器路线规划软体结合的试点计画。
亚太地区是成长最快的地区,年复合成长率达16.7%,主要得益于都市化和各国数位基础建设项目的推动。日本川越市部署了配备太阳能电池板、压缩机和蜂窝调製解调器的SmaGO垃圾桶,这些设备可将垃圾桶的满溢状态传输至控制室,从而减少了旅游区的垃圾溢出申诉。韩国加强了RoHS框架,推动了对人工智慧分类技术的投资。中国的「零废弃城市」试点计画透过整合感测器网络,显着减少了垃圾掩埋量和二氧化碳排放量。多边金融机构提供优惠贷款,将废弃物管理硬体、网路连接和分析功能打包,降低了二线城市的进入门槛,并扩大了整体智慧废弃物管理市场。
由于二十年来不断发展的循环经济政策,欧洲在循环经济领域维持了强劲的普及势头。 《巴塞尔公约》的合规性、不断上涨的掩埋税以及严格的回收目标,正迫使各市政当局对每一吨垃圾进行数位追踪。威立雅集团斥资40亿欧元推出的「绿色升级」计划,透过实施先进的危险废弃物追踪和资源回收系统,展现了其大规模推进循环经济的承诺。威立雅的废弃物焚化发电厂正在整合碳捕获模组和即时排放仪錶盘,以支援欧盟的永续财务资讯揭露要求,这充分体现了合规性与技术如何协同运作。跨国合作计画正在规范应用程式介面(API)模式,并将垃圾桶感测器资料提供给各国统计机构,进一步建构了该地区智慧废弃物管理市场的数位基础设施。
美国是北美智慧废弃物管理市场中最大的国家。其领先地位得益于各大城市和市政当局广泛实施的策略性废弃物管理计画。预计到2024年,美国对智慧废弃物管理解决方案的接受度很高。推动美国市场成长的因素包括政府为促进永续性所做的努力、智慧城市废弃物管理倡议在高度都市化地区的普及,以及对高效废弃物收集和处理方法的日益重视。
加拿大是智慧废弃物管理解决方案的快速成长市场,预计2024年至2029年年平均成长率约为13%。该市场以工业化进程加快和住宅区规模扩大为特征,从而催生了对智慧废弃物管理解决方案的强劲需求。加拿大各城市和市政当局正积极寻求创新解决方案,以应对废弃物管理挑战、提高效率并促进永续性。政府为创造更清洁的环境和减少废弃物而采取的各项倡议,正在推动加拿大各地智慧废弃物管理系统的普及应用。
欧洲已展现出对智慧废弃物管理解决方案的坚定承诺,这得益于全部区域不断进步的环境政策和技术创新。市场格局涵盖德国、英国、法国、西班牙和义大利等主要国家,它们都为区域市场的发展做出了重要贡献。该地区的成长动力来自日益加快的都市化、日益严格的废弃物管理法规以及智慧城市废弃物管理倡议的广泛应用。
德国在欧洲智慧废弃物管理市场占据领先地位,预计2024年将占约21%的市场。德国的领先地位归功于其先进的废弃物管理基础设施和对技术创新的高度重视。德国采用五阶段废弃物等级制度:预防、再利用准备、回收、替代回收方式及处置。
英国预计将成为欧洲成长潜力最大的国家,2024年至2029年的预期成长率约为18%。该国市场的快速扩张得益于感测器、物联网设备和数据分析技术的日益普及,这些技术旨在优化废弃物收集并提高效率。英国致力于环境永续性和智慧城市废弃物管理,因此对智慧废弃物管理技术进行了大量投资,尤其是在都市区。
亚太地区是智慧废弃物管理解决方案的活力市场,其特点是快速的都市化、日益增强的环保意识以及政府倡议的不断增加。主要市场包括中国、印度、澳洲和日本,它们各自为该地区的市场发展做出了独特的贡献。推动该地区转型发展的因素包括智慧城市废弃物管理措施、日益增长的环境问题以及快速发展的都市区对高效废弃物管理系统的需求。
中国已成为亚太地区最大的市场,展现出对智慧废弃物管理解决方案的强劲需求。中国在市场上的领先地位得益于智慧城市废弃物管理技术的广泛应用以及对废弃物管理基础设施的大量投资。国务院致力于建造零废弃物城市,并将人工智慧融入废弃物管理系统,这体现了中国对先进废弃物管理解决方案的坚定承诺。
澳洲是亚太地区成长最快的市场,在智慧废弃物管理方面取得了显着进展。该国的成长得益于其对永续性和环境保护措施的高度重视。人工智慧智慧废弃物系统和先进废弃物分类技术的引入,体现了澳洲致力于创新废弃物管理解决方案的决心,尤其是在都市区。
世界其他地区,包括拉丁美洲、中东和非洲,也越来越多地采用智慧废弃物管理解决方案。快速的都市化、工业化以及人们对永续废弃物管理实践日益增长的兴趣,是这些地区市场成长的关键驱动因素。儘管市场仍在发展中,但对智慧城市废弃物管理专案的大量投资,尤其是在中东地区,正在为智慧废弃物管理解决方案创造新的机会。在该地区,阿联酋处于市场领先地位,而巴西则展现出最快的成长潜力,这得益于智慧城市技术的日益普及以及政府为推广永续废弃物管理实践而采取的倡议。
其他福利:
- Excel格式的市场预测(ME)表
- 3个月的分析师支持
目录
第一章 引言
- 研究假设和市场定义
- 调查范围
第二章调查方法
第三章执行摘要
第四章 市场洞察
- 市场概览
- 产业吸引力:波特五力分析
- 供应商的议价能力
- 买方的议价能力
- 新进入者的威胁
- 替代品的威胁
- 竞争对手之间的竞争
- 新冠疫情副作用及其他宏观经济因素对市场的影响
第五章 市场动态
- 市场驱动因素
- 废弃物量增加推动市场发展
- 智慧城市的日益普及将刺激市场发展。
- 市场挑战
- 高昂的实施成本
第六章 技术概览
- 技术概述
- 创新技术革新废弃物管理
- 智慧废弃物管理阶段 - 按连接器
- 智慧废弃物管理市场中的感测器应用
- 智慧废弃物管理阶段
- 智慧收藏
- 智慧处理
- 智慧型能源回收
- 智慧处理
第七章 市场区隔
- 透过解决方案
- 车队管理
- 远端监控
- 分析
- 废弃物类型
- 工业废弃物
- 生活废弃物
- 按地区
- 北美洲
- 美国
- 加拿大
- 欧洲
- 德国
- 英国
- 法国
- 西班牙
- 义大利
- 亚洲
- 印度
- 中国
- 澳洲
- 日本
- 澳洲和纽西兰
- 拉丁美洲
- 中东和非洲
- 北美洲
第八章 竞争情势
- 公司简介
- SAP SE
- Veolia Environmental Services
- Enevo
- Waste Management Inc.
- Bigbelly Inc.
- Covanta Holding Corporation
- Evoeco
- Pepperl+Fuchs GmbH
- IBM Corporation
- BIN-e
第九章 投资分析
第十章:市场的未来
The smart waste management market size stood at USD 3.54 billion in 2025 and is forecast to rise to USD 7.15 billion by 2030, translating to a 15.1% CAGR during the period.
Rapid urbanisation, tightening carbon regulations and mounting landfill levies make data-driven waste services a fiscal necessity for municipalities rather than an optional upgrade. Lower IoT sensor prices, wider 5G and LPWAN footprints and maturing AI platforms enable real-time collection visibility that slashes fuel expenditure while proving compliance with circular-economy rules. Carbon-credit programmes now monetise diverted organics, and pay-as-you-throw schemes give cities new recurring revenue streams. Venture investors channel capital into AI robotic-sorting start-ups, and incumbent haulers accelerate consolidation to secure technology capabilities, creating a balanced landscape where innovation and scale coexist.
Global Smart Waste Management Market Trends and Insights
Data-driven route optimisation cuts fuel use
Real-time fill-level sensors and AI routing engines shorten vehicle kilometres travelled by 25% and reduce diesel consumption by 10%, attacking the single largest controllable cost in collection operations. Dynamic routing ends the practice of emptying half-full bins, lessening traffic congestion and CO2 emissions while sustaining service regularity. Fleet managers prefer cloud dashboards that visualise predicted fill curves so that crews leave depots only when beneficial. The model scales gracefully across dense urban grids and suburban zones, proving attractive to budget-constrained public works departments. As carbon pricing gains traction, verified fuel savings also translate into tradable carbon credits, reinforcing the investment case for sensor-based optimisation.
Pay-as-you-throw programmes boost municipal ROI
Massachusetts and Maine towns applying PAYT have cut disposed tonnage by 44% and shifted collection costs from property taxes to direct user fees. Bin-mounted load cells transmit weight data that billing engines convert into household invoices, creating a transparent feedback loop that nudges residents toward recycling. Finance directors welcome the model's ability to stabilise budgets by linking service usage to cost recovery, while environmental officers highlight the social equity benefits of charging only for waste generated. The mechanism generates reliable cash flows that can be reinvested in sensor roll-outs or recycling infrastructure, reinforcing a virtuous cycle of waste minimisation and fiscal resilience within the smart waste management market.
High retrofit costs for legacy fleets
A complete sensor, telematics and hydraulic-weight-cell upgrade can reach USD 25,000 per truck, straining municipal capital limits, especially in smaller jurisdictions reliant on ageing vehicles. Fragmented cab-ling layouts and proprietary onboard computers demand custom interfaces, stretching installation timelines and inflating labour bills. Cities therefore phase deployments over replacement cycles, stalling network effects that depend on data density. Suppliers react with subscription models bundling hardware amortisation into monthly fees, yet balance-sheet restrictions keep adoption uneven, tempering growth potential within segments of the smart waste management market.
Other drivers and restraints analyzed in the detailed report include:
- Growth of smart-city budgets
- Stricter e-waste take-back mandates
- Patchy LPWAN / 5G coverage in rural routes
For complete list of drivers and restraints, kindly check the Table Of Contents.
Segment Analysis
Analytics and Reporting held 32% share of the smart waste management market in 2024 and is forecast to post a 17.21% CAGR through 2030. Cities gravitate to cloud dashboards that translate raw sensor readings into digestible KPIs such as missed pickup alerts, fuel burned per tonne and greenhouse-gas abatement. Predictive models ingest historical fill trends, weather patterns and event calendars to schedule dynamic routes days ahead, lifting truck utilisation rates and resident satisfaction simultaneously. Fleet-management modules overlay live GPS breadcrumbs and diagnostic alerts, minimising unscheduled downtime and extending asset life. Mobile workforce tools then deliver turn-by-turn updates to in-cab tablets, closing the feedback loop between analytics insights and frontline execution.
Synergies grow as separate solution pillars converge. Asset-management engines now recommend optimal bin-placement based on pedestrian footfall data, while remote monitoring flags contamination events that threaten recycling quality. AI video analytics spot illegal dumping incidents, forwarding geotagged evidence to enforcement teams. These cross-module workflows create switching costs that solidify vendor positions and expand total contract values, underpinning robust revenue momentum for the smart waste management market.
Software products captured 41% of the smart waste management market size in 2024 and are projected to accelerate at 20.11% CAGR to 2030 as municipalities embrace subscription pricing that sidesteps heavy capex. Cloud architectures deliver over-the-air feature updates and cybersecurity patches, eliminating field visits. Vendor APIs facilitate plug-and-play links with city ERPs, carbon registries and citizen-reporting apps, unlocking network effects that widen the addressable base. Hardware still underpins data capture, yet commoditised sensors fall in price each year, shifting the spending mix toward software functionality and value-added analytics.
Service revenue grows in tandem as integrators design change-management roadmaps, train crews, and monitor data-quality dashboards. Managed-service contracts bundle warranty, analytics tuning, and compliance reporting into predictable monthly fees, aligning supplier incentives with customer outcomes. This recurring-revenue profile attracts private-equity interest and fuels consolidation plays that reshape the competitive contours of the smart waste management market.
The Smart Waste Management System Market Report is Segmented by Solution (Fleet Management, Remote Monitoring, Analytics, and More), Component (Hardware, Software, and More), Waste Type (Industrial Waste, Residential Waste, and More), Application (Smart Collection, Smart Processing, and More), Deployment (Cloud-Based and On-Premises), and Geography.
Geography Analysis
North America held 38% of the smart waste management market share in 2024 on the back of mature telecom networks, early carbon-pricing schemes, and federal infrastructure grants that subsidise smart-city deployments. Bigbelly's solar compacting bins cut pickups by up to 80% in New York and Boston, validating cost savings that unlocked follow-on rollouts. Canada's offset protocol for organics diversion lets projects such as SusGlobal's Belleville facility monetise 105,000 verified credits, enhancing payback periods. Regional haulers also capitalise on the Inflation Reduction Act, which offers clean-fleet tax credits, accelerating electric-truck pilots tied to sensorised routing software.
Asia Pacific is the fastest-growing region at a 16.7% CAGR, propelled by urbanisation and national digital-infrastructure programmes. Japan's Kawagoe City deploys SmaGO bins equipped with solar panels, compressors and cellular modems that message fill status to control rooms, cutting overflow complaints at tourist sites. South Korea's tightened RoHS framework drives AI sorting investments, and China's Zero-Waste City pilots showcase measurable landfill and CO2 reductions via integrated sensor networks. Multilateral lenders provide concessional loans that bundle waste-management hardware, connectivity and analytics, lowering entry barriers for secondary-tier cities and expanding the overall smart waste management market.
Europe sustains robust adoption thanks to 20 years of circular-economy policy evolution. Basel-Convention conformity, landfill-tax escalators and aggressive recycling targets spur municipalities to track every tonne digitally. Veolia's EUR 4 billion GreenUp plan deploys advanced hazardous-waste tracking and resource-regeneration systems, signalling corporate commitment at scale veolia.com. Energy-from-waste plants integrate carbon-capture modules with real-time emissions dashboards that feed into EU sustainable-finance disclosures, showing how compliance and technology interlock. Cross-border initiatives standardise API schemas so bin-sensor data can feed national statistical agencies, further entrenching digital infrastructure across the region's smart waste management market.
The United States dominates the North American smart waste management market as the largest country segment. The nation's leadership position is supported by the extensive implementation of strategic waste management programs across major cities and municipalities. With approximately 88% share of the North American market in 2024, the United States demonstrates strong adoption of smart waste management solutions. The country's growth is driven by government initiatives promoting sustainability, the penetration of smart city waste management initiatives across highly urbanized regions, and an increasing focus on efficient waste collection and disposal practices.
Canada represents a growing market for smart waste management solutions, with a forecasted growth rate of approximately 13% from 2024 to 2029. The country's market is characterized by increasing industrialization and expansion of the residential sector, which creates substantial demand for smart waste management solutions. Canadian cities and municipalities are actively seeking innovative solutions to address waste management challenges, improve efficiency, and promote sustainability. The government's initiatives to create a clean environment and reduce waste material are driving the adoption of smart waste management systems across the country.
Europe demonstrates a strong commitment to smart waste management solutions, supported by progressive environmental policies and technological innovation across the region. The market landscape spans key countries, including Germany, the United Kingdom, France, Spain, and Italy, each contributing significantly to the regional market development. The region's growth is driven by increasing urbanization, stringent waste management regulations, and widespread adoption of smart city waste management initiatives.
Germany leads the European smart waste management market with approximately 21% share of the regional market in 2024. The country's dominance is attributed to its advanced waste management infrastructure and strong focus on technological innovation. Germany applies a five-stage waste hierarchy: prevention, reuse preparation, recycling, alternative forms of recovery, and disposal, making it one of the most advanced nations in terms of waste management technology and systems globally.
The United Kingdom exhibits the highest growth potential in the European region, with a projected growth rate of approximately 18% from 2024 to 2029. The country's rapid market expansion is driven by the increasing implementation of sensors, IoT devices, and data analytics to optimize waste collection and improve efficiency. The UK's commitment to environmental sustainability and smart city waste management initiatives has led to significant investments in smart waste management technologies, particularly in urban areas.
The Asia-Pacific region represents a dynamic market for smart waste management solutions, characterized by rapid urbanization, increasing environmental awareness, and growing government initiatives. Key markets include China, India, Australia, and Japan, each contributing uniquely to the regional market development. The region's transformation is driven by smart city waste management initiatives, rising environmental concerns, and the need for efficient waste management systems in rapidly growing urban areas.
China emerges as the largest market in the Asia-Pacific region, demonstrating strong adoption of smart waste management solutions. The country's leadership in the market is supported by extensive implementation of smart city waste management technologies and significant investments in waste management infrastructure. The Chinese State Council's initiatives for developing zero-waste cities and the integration of artificial intelligence in waste management systems showcase the country's commitment to advanced waste management solutions.
Australia represents the fastest-growing market in the Asia-Pacific region, showing remarkable progress in smart waste management adoption. The country's growth is driven by a strong focus on sustainability initiatives and environmental protection measures. The implementation of AI-powered smart waste systems and advanced waste sorting technologies demonstrates Australia's commitment to innovative waste management solutions, particularly in urban areas.
The Rest of the World region, encompassing Latin America, the Middle East, and Africa, shows increasing adoption of smart waste management solutions. The market growth in these regions is primarily driven by rapid urbanization, industrialization, and an increasing focus on sustainable waste management practices. While the market is still developing, significant investments in smart city waste management initiatives, particularly in the Middle East, are creating new opportunities for smart waste management solutions. The United Arab Emirates leads the market in this region, while Brazil shows the fastest growth potential, driven by increasing adoption of smart city technologies and government initiatives promoting sustainable waste management practices.
List of Companies Covered in this Report:
- SAP SE
- Veolia Environmental Services
- Enevo
- Waste Management Inc.
- Bigbelly Inc.
- Covanta Holding Corporation
- Evoeco
- Pepperl+Fuchs GmbH
- IBM Corporation
- BIN-e
Additional Benefits:
- The market estimate (ME) sheet in Excel format
- 3 months of analyst support
TABLE OF CONTENTS
1 INTRODUCTION
- 1.1 Study Assumptions and Market Definition
- 1.2 Scope of the Study
2 RESEARCH METHODOLOGY
3 EXECUTIVE SUMMARY
4 MARKET INSIGHTS
- 4.1 Market Overview
- 4.2 Industry Attractiveness - Porter's Five Forces Analysis
- 4.2.1 Bargaining Power of Suppliers
- 4.2.2 Bargaining Power of Buyers
- 4.2.3 Threat of New Entrants
- 4.2.4 Threat of Substitutes
- 4.2.5 Intensity of Competitive Rivalry
- 4.3 Impact of COVID-19 Aftereffects and Other Macroeconomic Factors on the Market
5 MARKET DYNAMICS
- 5.1 Market Drivers
- 5.1.1 Increasing Volumes of Waste to Boost the Market
- 5.1.2 Rising Adoption of Smart Cities to Flourish the Market
- 5.2 Market Challenges
- 5.2.1 High Costs of Implementation
6 Technology Snapshot
- 6.1 Technology Overview
- 6.2 Innovative Technologies Revolutionizing Waste Management
- 6.3 Smart Waste Management Stages - By Connectors
- 6.4 Application of Sensors in the Smart Waste Management Market
- 6.5 Smart Waste Management Stages
- 6.5.1 Smart Collection
- 6.5.2 Smart Processing
- 6.5.3 Smart Energy Recovery
- 6.5.4 Smart Disposal
7 MARKET SEGMENTATION
- 7.1 By Solution
- 7.1.1 Fleet Management
- 7.1.2 Remote Monitoring
- 7.1.3 Analytics
- 7.2 By Waste Type
- 7.2.1 Industrial Waste
- 7.2.2 Residential Waste
- 7.3 By Geography
- 7.3.1 North America
- 7.3.1.1 United States
- 7.3.1.2 Canada
- 7.3.2 Europe
- 7.3.2.1 Germany
- 7.3.2.2 United Kingdom
- 7.3.2.3 France
- 7.3.2.4 Spain
- 7.3.2.5 Italy
- 7.3.3 Asia
- 7.3.3.1 India
- 7.3.3.2 China
- 7.3.3.3 Australia
- 7.3.3.4 Japan
- 7.3.3.5 Australia and New Zealand
- 7.3.4 Latin America
- 7.3.5 Middle East and Africa
- 7.3.1 North America
8 COMPETITIVE LANDSCAPE
- 8.1 Company Profiles
- 8.1.1 SAP SE
- 8.1.2 Veolia Environmental Services
- 8.1.3 Enevo
- 8.1.4 Waste Management Inc.
- 8.1.5 Bigbelly Inc.
- 8.1.6 Covanta Holding Corporation
- 8.1.7 Evoeco
- 8.1.8 Pepperl+Fuchs GmbH
- 8.1.9 IBM Corporation
- 8.1.10 BIN-e
9 INVESTMENT ANALYSIS
10 FUTURE OF THE MARKET
 2032 年废弃物互联网和人工智慧废弃物追踪市场预测:按组件、废弃物类型、部署、技术、最终用户和地区进行的全球分析
 2025年智慧废弃物管理全球市场报告
 智慧废弃物管理市场按产品类型、废弃物类型、製程类型、技术、最终用户和部署模式划分 - 2025-2030 年全球预测智慧食品盒市场(按组件、产品类型、技术、应用和最终用户划分)—2025 年至 2030 年全球预测
 全球智慧废弃物管理市场规模(按废弃物类型、方法、来源、区域覆盖范围和预测)
 智慧废弃物管理市场规模、份额、趋势及预测(按成分、废弃物类型、方法、来源和地区),2025 年至 2033 年2032 年数位废弃物管理解决方案市场预测:按组件、废弃物类型、方法、技术、应用、最终用户和地区进行的全球分析
 智慧废弃物管理市场(全球)(2025-2029)
 区块链废弃物追踪市场:到 2033 年的市场分析和预测 - 按类型、按产品、按服务、按技术、按组件、按应用、按流程、按部署、按最终用户、按解决方案
 智慧废弃物管理市场规模、份额、成长分析,按废弃物类型、方法、来源、地区 - 产业预测,2024-2031