


 |
市场调查报告书
商品编码
1851736
支付安全:市场份额分析、行业趋势、统计数据和成长预测(2025-2030 年)Payment Security - Market Share Analysis, Industry Trends & Statistics, Growth Forecasts (2025 - 2030) |
||||||
※ 本网页内容可能与最新版本有所差异。详细情况请与我们联繫。
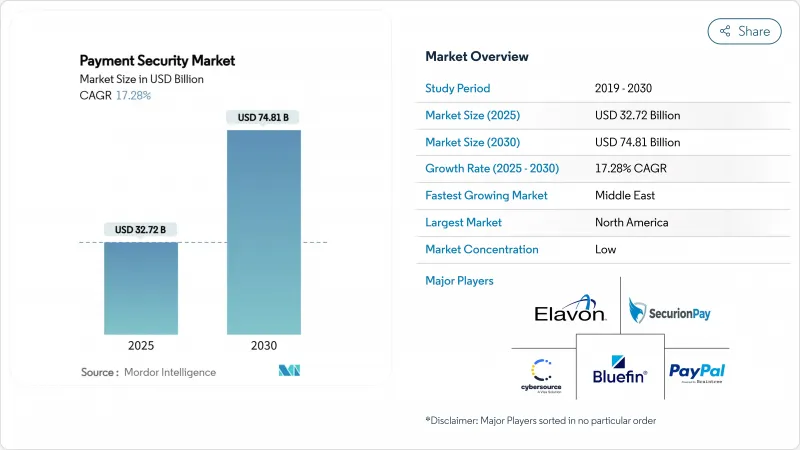
全球支付安全市场预计到 2025 年将达到 337.2 亿美元,到 2030 年将达到 748.1 亿美元,复合年增长率为 17.28%。
这一强劲的发展趋势与日益严格的监管、数位通路交易量的成长以及检测技术的不断创新相吻合。为因应PCI DSS 4.0的最后期限而进行的持续合规投资、人工智慧在诈欺分析中的广泛应用以及行动优先钱包的普及,正在影响着企业的支出重点。儘管令牌化和加密仍然是基础,但随着发卡机构和商家应对合成身分攻击,即时行为分析和多因素认证正在占据越来越大的预算份额。与技术升级同步,各支付网路和处理商之间也在加速整合竞争情报,透过整合威胁情报平台和扩大全球商家基础来保护其在支付安全市场的份额。
全球支付安全市场趋势与洞察
PCI DSS 4.0 合规性监理加大
符合 PCI DSS 4.0 标准(该标准将于 2025 年 3 月起强制执行)正在重塑北美各地的安全预算。企业在 1 级合规方面每年需支出高达 25 万美元,这反映了该标准新增的 64 项要求,涵盖持续日誌分析和付款页面脚本完整性。违规罚款最高可达每月 50 万美元,促使企业立即采取补救措施,并推动令牌化和自动化加密服务的快速普及。欧洲收购方已开始将 PSD3 条款与 PCI 控制措施进行映射,由此产生的连锁反应将使投资动能持续到 2027 年。
基于人工智慧的诈欺分析正在兴起
金融机构正在加速从基于规则的引擎向自适应机器学习模型转型,这些模型能够即时分析超过100个情境讯号。 Visa报告称,到2024年,人工智慧应用将拦截价值400亿美元的非法贸易,误报率降低85%,核准率提高。云端处理器将这些模型以微服务的形式整合,使商家无需耗费大量集成工作即可微调风险阈值。新兴市场可以透过消除对传统本地基础设施的需求,实现云端规模带来的优势。
中小企业初始整合成本高昂
中小企业 (SME) 的年度安全支出通常在 5,000 美元到 50,000 美元之间,这对于整体 IT 预算较小的新兴经济体而言,无疑是一笔不小的开支,给其现金流带来了压力。许多中小企业依赖捆绑式云端订阅服务来进行复杂的范围界定,但对资料驻留和供应商锁定的担忧减缓了它们向云端迁移的步伐。因此,低成本的插件解决方案在低流量的网上商店中占据主导地位,导致高级风险分析方面存在空白。随着成本曲线的下降,提供基于使用量的分级服务的安全厂商有望抓住中小企业的潜在需求。
细分市场分析
到2024年,代币化将占据支付安全市场31%的份额,这凸显了其在从商家系统中移除主帐号和缩小审核范围方面的重要作用。 Visa在2024年处理了100亿笔代币化交易,较去年同期成长45%,展现了其在实体店和电商领域的可扩展性。资料外洩的处罚在银行业和医疗保健行业尤为严厉。整合机器学习管道的诈欺侦测平台预计将以21.03%的复合年增长率成长,反映出市场对能够从不断演变的攻击向量中自我学习的自适应控制的需求。其他新兴解决方案,例如量子安全密码学和分散式帐本检验,目前主要针对特定应用场景,但随着标准的成熟,它们将展现出长期的成长潜力。能够将代币服务与人工智慧驱动的分析相结合的供应商可以提供整合服务,在降低人工审核成本的同时,减少误报。这种能力有助于提升销售,使整合平台成为支付安全市场整体收入的重要贡献者。
各类解决方案的成长将影响支付安全市场规模的预测,尤其是在支出从基础合规工具转向智慧编配引擎的情况下。供应商之间的竞争侧重于功能的广度而非单一功能,并且倾向于签订长期合同,特别是与那些偏好集成审核报告仪錶板的公司签订合同。随着收购方环境中令牌库密度的增加,对虚拟金钥管理模组的需求正在加速成长,因为供应链晶片短缺可能会影响硬体 HSM 的更新计画。
2024年,基于Web的部署将主导支付安全市场,占据47%的市场份额,这主要得益于根深蒂固的桌面购物模式和成熟的支付网关整合。然而,行动平台才是真正的成长引擎,预计到2030年将以23.15%的复合年增长率成长。中国目前已有82%的线上购物篮支付透过行动电子钱包完成,而印度的UPI系统现在能够实现亚秒级的P2P转账,速度已超过银行卡支付。这些趋势推动了应用层对生物识别、网路代币配置和设备认证的需求。因此,安全蓝图的核心重点是建立SDK,使商家能够在原生行动应用程式、浏览器和渐进式网页应用程式流程中编配通用的策略。
全通路策略正在缩小实体店刷卡和非刷卡交易安全标准之间长久以来的差距。在NFC和MPoC指南的支援下,店内「轻触智慧型手机」倡议方式引入了与电商相同的即时风险洞察。行动互联网的兴起也使得网路平台能够采用现代化的会话完整性控制,从而确保零售商在整个客户互动週期中提供一致的客户体验。
支付安全市场按解决方案类型(加密、令牌化等)、平台(行动端、网页端、店内/POS)、组织规模(中小企业、大型企业)、终端用户行业(零售和电子商务、银行、金融服务和保险等)以及地区进行细分。市场预测以美元计价。
区域分析
预计到2024年,北美将贡献支付安全市场30%的收入,这主要得益于PCI DSS 4.0的早期迁移以及大型全通路商户的持续升级。企业预算优先考虑人工智慧驱动的风险引擎,而卡片组织则将增值保全服务捆绑到处理费中。儘管与3DS 2.2延迟相关的实施挑战仍在影响核准率,但监管确定性以及更清晰的执行时间表正在支撑稳定的采购流程。诸如万事达卡在2024年以26.5亿美元收购Recorded Future等策略性收购,凸显了将原生威胁情报源整合到网路堆迭中的持续趋势。
亚太地区仍是成长的中心。在政府支持的即时支付基础设施和积极的普惠金融政策的推动下,行动钱包目前已占电子商务交易总额的70%。基础设施的飞跃式发展使商家能够跳过传统的磁条系统,并儘早采用云端原生网关。跨国二维码联盟,例如新加坡PayNow与泰国PromptPay的合作,进一步增加了需要端到端安全保障的交易数量。因此,该地区的需求倾向于轻量级SDK,这些SDK整合了设备绑定和行为生物识别技术,且不会增加结帐流程的阻力。
欧洲在严格的消费者保护标准和快速的POS技术更新週期之间取得了平衡。 PCI MPoC和PSD3在27个成员国之间建构了统一的合规框架,推动了汽车、旅馆和运输业非接触式和物联网终端的普及。同时,从中东和非洲地区到2030年将以20.52%的复合年增长率(CAGR)领跑,这主要得益于行动支付平台为此前银行帐户服务的人群提供的服务。区域监管机构正在加速推进数位身分框架的建设,并支援託管在符合本地标准的资料中心的云端令牌库。儘管这些措施将扩大该地区的整体支付安全市场规模,但中小企业的购买力仍然有限。
其他福利:
- Excel格式的市场预测(ME)表
- 3个月的分析师支持
目录
第一章 引言
- 研究假设和市场定义
- 调查范围
第二章调查方法
第三章执行摘要
第四章 市场情势
- 市场概览
- 市场驱动因素
- 北美地区对PCI-DSS 4.0合规性的监管更加严格
- 基于人工智慧的诈欺分析在云端支付处理商中迅速普及
- 先买后付(BNPL)模式的成长需要安全的代币库。
- 欧洲物联网POS终端快速成长
- 亚洲新兴市场行动优先钱包蓬勃发展
- 市场限制
- 对于中小型商家而言,系统整合的初始成本很高。
- 3-D Secure 2.2 部署中的交易延迟问题
- 新兴国家资料保护法律的碎片化和重迭
- 消费者对行为生物辨识技术的隐私担忧
- 价值链分析
- 监理展望
- 波特五力分析
- 供应商的议价能力
- 买方/消费者的议价能力
- 新进入者的威胁
- 替代品的威胁
- 竞争对手之间的竞争
- 评估市场宏观经济趋势
第五章 市场规模与成长预测
- 按解决方案类型
- 加密
- 分词
- 诈欺检测与预防
- 其他解决方案
- 按平台
- 基于行动装置的
- 基于网路的
- 店内/POS
- 按组织规模
- 中小企业
- 大公司
- 按最终用户行业划分
- 零售与电子商务
- BFSI
- 卫生保健
- 资讯科技和电讯
- 旅游与饭店
- 政府机构
- 其他行业
- 按地区
- 北美洲
- 美国
- 加拿大
- 墨西哥
- 欧洲
- 英国
- 德国
- 法国
- 义大利
- 西班牙
- 其他欧洲地区
- 亚太地区
- 中国
- 印度
- 日本
- 韩国
- 亚太其他地区
- 南美洲
- 巴西
- 阿根廷
- 其他南美洲
- 中东
- 阿拉伯聯合大公国
- 沙乌地阿拉伯
- 其他中东地区
- 非洲
- 南非
- 奈及利亚
- 其他非洲地区
- 北美洲
第六章 竞争情势
- 市场集中度
- 策略趋势
- 市占率分析
- 公司简介
- Visa Inc.(CyberSource Corporation)
- Bluefin Payment Systems LLC
- PayPal Holdings Inc.(Braintree)
- Elavon Inc.
- SecurionPay
- Global Payments Inc.
- Worldline SA
- Broadcom Inc.(Symantec)
- Stripe Inc.
- Fiserv Inc.(First Data)
- Signifyd Inc.
- Adyen NV
- Shift4 Payments Inc.
- TokenEx Inc.
- Forter Ltd.
- ACI Worldwide Inc.
- RSA Security LLC
- F5 Inc.(Shape Security)
- Thales Group(Gemalto)
- Transaction Network Services(TNS)
第七章 市场机会与未来展望
The global payment security market size holds a current value of USD 33.72 billion in 2025 and is forecast to advance to USD 74.81 billion by 2030, translating into a 17.28% CAGR.
This solid trajectory aligns with tightening regulatory mandates, rising transaction volumes across digital channels, and continued innovation in detection technologies. Continuous compliance investments linked with the final PCI DSS 4.0 deadline, wide-scale application of artificial intelligence in fraud analytics, and the proliferation of mobile-first wallets are shaping enterprise spending priorities. Tokenization and encryption remain foundational, yet real-time behavioral analytics and multi-factor authentication are taking a larger budget share as issuers and merchants confront synthetic identity attacks. Parallel to technology upgrades, competitive consolidation among networks and processors is accelerating as firms integrate threat-intelligence platforms and expand global merchant bases to defend share in the payment security market
Global Payment Security Market Trends and Insights
Regulatory push for PCI DSS 4.0 compliance
Mandatory adherence to PCI DSS 4.0 beginning in March 2025 is reshaping security budgets across North America. Enterprises face annual outlays that climb to USD 250,000 at Level 1, reflecting the standard's 64 new requirements covering continuous log analysis and payment-page script integrity. Non-compliance fines of up to USD 500,000 per month sharpen the focus on immediate remediation, prompting rapid adoption of tokenization and automated encryption services. European acquirers are already mapping PSD3 provisions to PCI controls, creating a spill-over effect that sustains investment momentum through 2027.
Surge in AI-based fraud analytics
Financial institutions increasingly pivot from rule-based engines to adaptive machine-learning models that inspect more than 100 contextual signals in real time. Visa reports that AI applications blocked USD 40 billion in fraudulent transactions during 2024, cutting false positives by 85% and improving authorization rates. Cloud processors embed these models as micro-services, allowing merchants to fine-tune risk thresholds without lengthy integrations. Emerging markets benefit from cloud scale because it removes the need for legacy on-premise infrastructure, a dynamic that supports uniform global deployment of next-generation fraud analytics.
High upfront integration costs for SMEs
Typical annual security spend for a small merchant can range from USD 5,000 to USD 50,000, an amount that strains cash flows in emerging economies where total IT budgets are modest. Complex scoping exercises push many SMEs toward bundled cloud subscriptions, yet concerns around data residency and vendor lock-in slow conversions. As a result, low-cost plug-in solutions dominate lower-volume web stores, leaving gaps in advanced risk analytics. Security vendors that can tier services according to volume thresholds are expected to capture latent SME demand once cost curves decline.
Other drivers and restraints analyzed in the detailed report include:
- Expansion of BNPL requiring secure token vaults
- Rapid growth of IoT-enabled POS terminals
- Transaction-latency issues in 3-D Secure 2.2 roll-outs
For complete list of drivers and restraints, kindly check the Table Of Contents.
Segment Analysis
Tokenization accounted for 31% of payment security market share in 2024, underscoring its role in removing primary account numbers from merchant systems and shrinking audit scope. Visa processed 10 billion tokenized transactions in 2024, up 45% from the prior year, proving scalability in both in-store and e-commerce settings. Encryption remains mandatory for data-in-transit, particularly in banking and healthcare where breach disclosure rules impose heavy penalties. Fraud detection platforms that embed machine-learning pipelines are projected to expand at 21.03% CAGR, reflecting demand for adaptive controls that self-learn from evolving attack vectors. Other emerging solutions, including quantum-safe cryptography and distributed-ledger verification, currently capture niche use-cases but hold long-term upside as standards mature. Vendors able to interlink token services with AI-driven analytics create combined offerings that minimize manual review costs while keeping false positives in check. This capability supports upsell cycles, positioning integrated platforms for outsized contribution to overall payment security market revenue.
Growth across solution types will influence payment security market size forecasts, specifically by shifting spend from basic compliance tools to intelligent orchestration engines. Vendors competing on breadth rather than point functionality tend to secure longer-term contracts, especially with enterprises that favor consolidated dashboards for audit reporting. As token vault density increases inside acquirer environments, supply-chain chip shortages may hit hardware HSM refresh plans, thereby accelerating interest in virtualized key-management modules.
Web-based deployments led the payment security market in 2024 with a 47% share, driven by entrenched desktop shopping patterns and mature gateway integrations. However, mobile platforms are the clear growth engine at 23.15% CAGR through 2030. China already records that 82% of online baskets close via mobile wallets, while India's UPI system enables sub-second peer-to-merchant transfers that now outpace card usage. These trends elevate requirements for biometric authentication, network-token provisioning, and device attestation directly in the app layer. As a result, security roadmaps center on building SDKs that allow merchants to orchestrate common policies across native mobile, browser, and progressive web-app flows.
Omnichannel strategies are narrowing the historical gap between card-present and card-not-present security standards. In-store tap-to-phone initiatives, enabled by NFC and MPoC guidelines, introduce the same real-time risk insights present in e-commerce. The rise of mobile also acts as a forcing function for web platforms to adopt modern session integrity controls, ensuring that customer experience remains consistent across a retailer's full engagement cycle.
Payment Security Market is Segmented by Solution Type (Encryption, Tokenization and More), Platform (Mobile-Based, Web-Based, In-Store / POS), Organization Size (Small & Medium-Sized Enterprises (SMEs), Large Enterprises), End-User Industry (Retail & E-Commerce, BFSI and More), Geography. The Market Forecasts are Provided in Terms of Value (USD).
Geography Analysis
North America contributed 30% of payment security market revenue in 2024, boosted by early PCI DSS 4.0 migrations and continued upgrades among large omnichannel merchants. Enterprise budgets prioritise AI-powered risk engines, while card networks bundle value-added security services inside processing tariffs. Implementation challenges linked to 3DS 2.2 latency still influence approval ratios, yet the regulatory certainty of defined enforcement timelines underpins steady procurement pipelines. Strategic acquisitions, such as Mastercard's USD 2.65 billion purchase of Recorded Future in 2024, highlight an ongoing drive to embed native threat-intelligence feeds inside network stacks.
Asia-Pacific remains the growth nucleus. Mobile wallets now drive 70% of total ecommerce volume, supported by government-backed real-time payment rails and aggressive financial inclusion policies. Infrastructure leapfrogging lets merchants skip legacy mag-stripe systems, installing cloud-native gateways from inception. Cross-border QR alliances, typified by the linkage between Singapore's PayNow and Thailand's PromptPay, further increase transaction counts that must be secured end-to-end. As a result, regional demand skews toward lightweight SDKs that embed device binding and behavioral biometrics without adding checkout friction.
Europe balances strong consumer-protection norms with rapid POS technology refresh cycles. PCI MPoC and PSD3 create a harmonised compliance backdrop across 27 member states, spurring automotive, hospitality, and transport sectors to adopt contactless and IoT-enabled terminals. Meanwhile, the Middle East and Africa show the highest CAGR at 20.52% through 2030, driven by mobile-money platforms that serve previously unbanked populations. Regional regulators accelerate digital-identity frameworks, supporting cloud token vaults hosted in locally compliant data centres. These initiatives collectively expand regional payment security market size, although SME affordability constraints persist.
- Visa Inc. (CyberSource Corporation)
- Bluefin Payment Systems LLC
- PayPal Holdings Inc. (Braintree)
- Elavon Inc.
- SecurionPay
- Global Payments Inc.
- Worldline SA
- Broadcom Inc. (Symantec)
- Stripe Inc.
- Fiserv Inc. (First Data)
- Signifyd Inc.
- Adyen N.V.
- Shift4 Payments Inc.
- TokenEx Inc.
- Forter Ltd.
- ACI Worldwide Inc.
- RSA Security LLC
- F5 Inc. (Shape Security)
- Thales Group (Gemalto)
- Transaction Network Services (TNS)
Additional Benefits:
- The market estimate (ME) sheet in Excel format
- 3 months of analyst support
TABLE OF CONTENTS
1 INTRODUCTION
- 1.1 Study Assumptions and Market Definition
- 1.2 Scope of the Study
2 RESEARCH METHODOLOGY
3 EXECUTIVE SUMMARY
4 MARKET LANDSCAPE
- 4.1 Market Overview
- 4.2 Market Drivers
- 4.2.1 Regulatory Push for PCI-DSS 4.0 Compliance in North America
- 4.2.2 Surge in AI-based Fraud Analytics among Cloud Payment Processors
- 4.2.3 Expansion of Buy-Now-Pay-Later (BNPL) Requiring Secure Token Vaults
- 4.2.4 Rapid Growth of IoT-Enabled POS Terminals in Europe
- 4.2.5 Mobile-First Wallet Boom across Emerging Asian Markets
- 4.3 Market Restraints
- 4.3.1 High Up-front Integration Costs for Small & Mid-Sized Merchants
- 4.3.2 Transaction-Latency Issues in 3-D Secure 2.2 Roll-outs
- 4.3.3 Fragmented & Overlapping Data-Protection Statutes in Emerging Nations
- 4.3.4 Consumer Privacy Concerns over Behavioral Biometrics
- 4.4 Value Chain Analysis
- 4.5 Regulatory Outlook
- 4.6 Porter's Five Forces Analysis
- 4.6.1 Bargaining Power of Suppliers
- 4.6.2 Bargaining Power of Buyers/Consumers
- 4.6.3 Threat of New Entrants
- 4.6.4 Threat of Substitutes
- 4.6.5 Intensity of Competitive Rivalry
- 4.7 Assessment of Macro Economic Trends on the Market
5 MARKET SIZE AND GROWTH FORECASTS (VALUES)
- 5.1 By Solution Type
- 5.1.1 Encryption
- 5.1.2 Tokenization
- 5.1.3 Fraud Detection & Prevention
- 5.1.4 Other Solutions
- 5.2 By Platform
- 5.2.1 Mobile-Based
- 5.2.2 Web-Based
- 5.2.3 In-Store / POS
- 5.3 By Organization Size
- 5.3.1 Small & Medium-Sized Enterprises (SMEs)
- 5.3.2 Large Enterprises
- 5.4 By End-user Industry
- 5.4.1 Retail and E-commerce
- 5.4.2 BFSI
- 5.4.3 Healthcare
- 5.4.4 IT and Telecom
- 5.4.5 Travel and Hospitality
- 5.4.6 Government
- 5.4.7 Other Industries
- 5.5 By Geography
- 5.5.1 North America
- 5.5.1.1 United States
- 5.5.1.2 Canada
- 5.5.1.3 Mexico
- 5.5.2 Europe
- 5.5.2.1 United Kingdom
- 5.5.2.2 Germany
- 5.5.2.3 France
- 5.5.2.4 Italy
- 5.5.2.5 Spain
- 5.5.2.6 Rest of Europe
- 5.5.3 Asia-Pacific
- 5.5.3.1 China
- 5.5.3.2 India
- 5.5.3.3 Japan
- 5.5.3.4 South Korea
- 5.5.3.5 Rest of Asia-Pacific
- 5.5.4 South America
- 5.5.4.1 Brazil
- 5.5.4.2 Argentina
- 5.5.4.3 Rest of South America
- 5.5.5 Middle East
- 5.5.5.1 United Arab Emirates
- 5.5.5.2 Saudi Arabia
- 5.5.5.3 Rest of Middle East
- 5.5.6 Africa
- 5.5.6.1 South Africa
- 5.5.6.2 Nigeria
- 5.5.6.3 Rest of Africa
- 5.5.1 North America
6 COMPETITIVE LANDSCAPE
- 6.1 Market Concentration
- 6.2 Strategic Moves
- 6.3 Market Share Analysis
- 6.4 Company Profiles (includes Global-level Overview, Market-level Overview, Core Segments, Financials as available, Strategic Information, Market Rank/Share, Products & Services, Recent Developments)
- 6.4.1 Visa Inc. (CyberSource Corporation)
- 6.4.2 Bluefin Payment Systems LLC
- 6.4.3 PayPal Holdings Inc. (Braintree)
- 6.4.4 Elavon Inc.
- 6.4.5 SecurionPay
- 6.4.6 Global Payments Inc.
- 6.4.7 Worldline SA
- 6.4.8 Broadcom Inc. (Symantec)
- 6.4.9 Stripe Inc.
- 6.4.10 Fiserv Inc. (First Data)
- 6.4.11 Signifyd Inc.
- 6.4.12 Adyen N.V.
- 6.4.13 Shift4 Payments Inc.
- 6.4.14 TokenEx Inc.
- 6.4.15 Forter Ltd.
- 6.4.16 ACI Worldwide Inc.
- 6.4.17 RSA Security LLC
- 6.4.18 F5 Inc. (Shape Security)
- 6.4.19 Thales Group (Gemalto)
- 6.4.20 Transaction Network Services (TNS)
7 MARKET OPPORTUNITIES AND FUTURE OUTLOOK
- 7.1 White-space and Unmet-Need Assessment


