


 |
市场调查报告书
商品编码
1851744
威胁情报:市场占有率分析、产业趋势、统计数据和成长预测(2025-2030 年)Threat Intelligence - Market Share Analysis, Industry Trends & Statistics, Growth Forecasts (2025 - 2030) |
||||||
※ 本网页内容可能与最新版本有所差异。详细情况请与我们联繫。
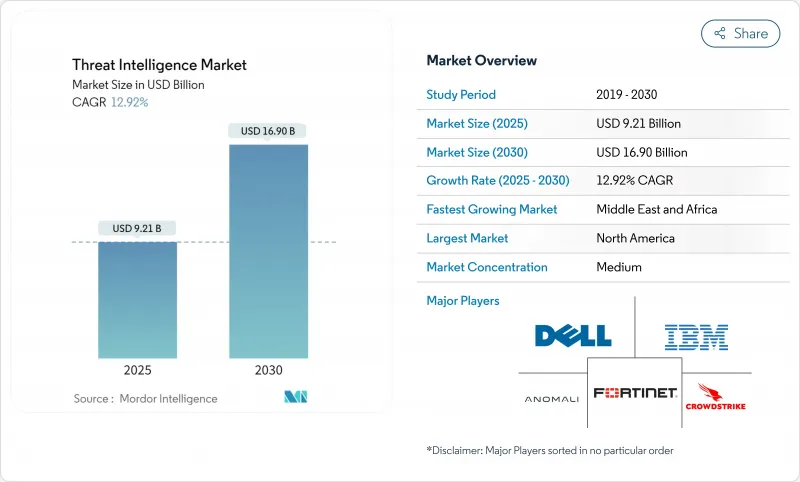
预计到 2025 年,威胁情报市场规模将达到 92.1 亿美元,到 2030 年将达到 169 亿美元,复合年增长率为 12.92%。
云端技术的日益普及、攻击者对人工智慧的快速应用,以及欧盟网路资讯安全指令(EU-NIS2 Directive)等监管框架的不断完善,都在推动主动情报平台领域的投资成长。安全领导者正优先考虑富含上下文资讯的分析,以加快响应速度并降低安全漏洞成本;与此同时,保险公司和投资者在评估网路风险之前,也越来越多地审查即时情报资讯。儘管主要供应商之间的整合正在扩大平台范围,但在需要特定行业情报时,专业供应商仍然发挥着至关重要的作用。威胁情况依然动盪不安,国家级网路活动活性化,资金筹措勒索软体集团,这些因素共同推动了所有关键领域的持续投资。
全球威胁情报市场趋势与洞察
AI主导的多态恶意软体瞄准云端原生工作负载
人工智慧产生的多态恶意软体能够动态重写程式码,绕过传统的特征码侦测工具,迫使防御者依赖行为分析。 IBM 的研究表明,此类恶意软体现在无需人工干预即可进行勒索谈判,并根据云端配置改变策略,这使得事件回应更加复杂。美国司法部近期捣毁了一个利用人工智慧漏洞窃取价值 2.63 亿美元加密货币的组织,凸显了此类金融风险的巨大程度。北美企业正在增加机器学习侦测方面的预算,这使得威胁情报市场对于保护云端工作负载至关重要。
关键基础设施营运商的欧盟-NIS2合规支出
NIS2指令将于2024年10月生效,届时约30万家欧洲营业单位将需要进行风险评估、事件报告和供应链审计。违规罚款最高可达1000万欧元或全球营业额的2%,将促使董事会优先考虑即时情报。欧盟以外的跨国公司在服务欧盟客户时也需要遵守该指令,这为提供符合审核要求的情报资料来源的供应商创造了商机。
传统SOC中的STIX/TAXII互通性差距
儘管 STIX 和 TAXII 已于 2021 年成为 OASIS 标准,但许多传统平台仍然使用专有格式,阻碍了资料的无缝共用。研究表明,整合复杂性和不一致的编码是主要障碍。因此,企业正在推迟平台升级并削减短期支出。
细分市场分析
平台型威胁情报市场占据主导地位,其解决方案在2024年占据全球收入的56%。光是微软Defender威胁情报每天就能处理78兆个讯号,凸显了其规模优势。这项优势也解释了为何基于平台的威胁情报市场规模预计将持续成长至2030年。领先的供应商正在将人工智慧融入行为分析,从而减轻分析师的工作量并提高侦测的准确性。
託管服务和专业服务以14.5%的复合年增长率超过了产品成长速度,反映出人才短缺和日益复杂的市场环境。 SANS的研究表明,许多公司正在将威胁情报搜寻功能外包以弥补技能缺口。尤其是在威胁情报产业的中端市场,将实施与培训相结合的伙伴关係能够为买家提供更快的价值,并推动服务的普及。
到2024年,本地部署将占总支出的55%,因为监管严格的行业更倾向于本地资料储存。儘管如此,云端託管平台仍以16.8%的复合年增长率成长,显示市场对服务提供者的安全加固和FedRAMP扩展充满信心,微软Defender威胁情报已获得「高」级认证。业内人士预计,在预测期的后半段,基于云端的威胁情报市场将超越本地部署市场。
混合方法将传统感测器与SaaS分析结合,吸引了那些以自身节奏进行现代化改造的组织。随着金融监管机构发布安全云采用蓝图,其中特别提到了持续智慧的集成,这种趋势正在加速发展。
区域分析
北美地区预计到2024年将占全球收入的38%,这主要得益于成熟的云端运算应用、公私资讯共用以及厂商的积极布局。各州立法机构正在推进资讯自由法案,而联邦机构则在支援即时数据交换平台,这将增强威胁情报市场。针对云端工作负载的AI恶意软体仍然是该地区的首要关注点,相关平台的支出仍然强劲。
在欧洲,随着NIS2的强制实施,威胁情报市场规模从2万家公司扩大到30万家,前景更加光明。诸如《网路弹性法案》等配套法规进一步推动了整个供应链持续漏洞资讯的需求。能够提供包含多语言威胁资料且可直接用于审核的彙报的供应商将占据有利地位。
到2030年,中东地区的复合年增长率将达到15.8%,是全球成长最快的地区。阿联酋和沙乌地阿拉伯的国家机构正在投资建立特定产业的融合中心,能源巨头也因即时数据流而获得了网路保险折扣。该地区日益紧张的地缘政治局势,提升了威胁情报市场对公共和私营部门的战略价值。
亚太地区的网路攻击数量正以两位数的速度成长,尤其是在印尼,每週发生的攻击事件超过 3300 起。快速的数位化加上各国不同的主权规则,导致需求分散:日本、韩国和澳洲正在主导零信任试点项目,将即时情报纳入存取决策;而中国和印度的资料本地化法律则更倾向于使用国内云端节点。
在南美洲,中型银行、金融服务和保险机构(BFSI)透过外包威胁搜寻来克服技能短缺,从而推动了威胁搜寻技术的普及,并在较小规模上提高了全球收入。
其他福利:
- Excel格式的市场预测(ME)表
- 3个月的分析师支持
目录
第一章 引言
- 研究假设和市场定义
- 调查范围
第二章调查方法
第三章执行摘要
第四章 市场情势
- 市场概览
- 市场驱动因素
- AI驱动的多态恶意软体瞄准北美云端原生工作负载
- 关键基础设施营运商为遵守欧盟NIS2法规而进行的支出
- 亚太大型企业零信任部署
- RaaS卡特尔推动加密钱包监控的需求
- 为一家中型南美银行、金融服务和保险机构提供威胁狩猎外包服务
- 网路保险保费折扣与即时威胁保障挂钩(中东能源)
- 市场限制
- 传统SOC中的STIX/TAXII互通性差距
- 可操作情报数据的订阅成本不断上涨
- 资料主权障碍(中国CSL、印度DPDP等)
- 资源受限团队中的分析师疲劳和警报过载
- 监理展望
- 技术展望
- 波特五力分析
- 新进入者的威胁
- 买方的议价能力
- 供应商的议价能力
- 替代品的威胁
- 竞争对手之间的竞争
- 评估宏观经济因素对市场的影响
第五章 市场规模与成长预测
- 按组件
- 解决方案
- 威胁情报平台
- 安全资讯和事件管理 (SIEM) 资讯流
- 威胁狩猎/分析工具
- 服务
- 託管/外包服务
- 专业咨询
- 培训和支持
- 解决方案
- 透过部署
- 本地部署
- 云
- 杂交种
- 按威胁情报类型
- 策略
- 战术上的
- 手术
- 技术的
- 按组织规模
- 大公司
- 小型企业
- 按最终用户行业划分
- BFSI
- 资讯科技/通讯
- 零售与电子商务
- 製造业
- 医疗保健和生命科学
- 政府/国防
- 能源与公共产业
- 其他的
- 按地区
- 北美洲
- 美国
- 加拿大
- 墨西哥
- 南美洲
- 巴西
- 阿根廷
- 智利
- 秘鲁
- 其他南美洲
- 欧洲
- 德国
- 英国
- 法国
- 义大利
- 西班牙
- 其他欧洲地区
- 亚太地区
- 中国
- 日本
- 韩国
- 印度
- 澳洲
- 纽西兰
- 亚太其他地区
- 中东
- 阿拉伯聯合大公国
- 沙乌地阿拉伯
- 土耳其
- 其他中东地区
- 非洲
- 南非
- 其他非洲地区
- 北美洲
第六章 竞争情势
- Strategic Developments
- Vendor Positioning Analysis
- 公司简介
- IBM Corporation
- Cisco Systems Inc.
- Dell Technologies Inc.
- CrowdStrike Holdings Inc.
- Check Point Software Technologies Ltd.
- Trend Micro Incorporated
- Palo Alto Networks Inc.
- Fortinet Inc.
- Rapid7 Inc.
- Secureworks Inc.
- FireEye-Trellix
- Recorded Future Inc.
- Anomali Inc.
- LookingGlass Cyber Solutions Inc.
- LogRhythm Inc.
- McAfee LLC
- Broadcom Inc.(Symantec)
- Juniper Networks Inc.
- F-Secure Corporation
- SentinelOne Inc.
- Microsoft Corp.(Defender Threat Intelligence)
第七章 市场机会与未来展望
The threat intelligence market is valued at USD 9.21 billion in 2025 and is forecast to reach USD 16.90 billion by 2030, reflecting a CAGR of 12.92%.
Expanding cloud adoption, rapid attacker use of AI, and tighter regulatory frameworks such as the EU-NIS2 directive are lifting spending on proactive intelligence platforms. Security leaders are prioritizing context-rich analytics that shorten response times and lower breach costs, while insurers and investors now examine live intelligence feeds before underwriting cyber risk. Consolidation among large vendors is accelerating platform breadth, yet specialist providers remain relevant where sector-specific intelligence is required. Heightened nation-state activity and ransomware cartel funding through cryptocurrencies are expected to keep the threat environment volatile, sustaining investment momentum across every major vertical.
Global Threat Intelligence Market Trends and Insights
AI-driven Polymorphic Malware Targeting Cloud-Native Workloads
AI-generated polymorphic malware can rewrite its code on the fly, defeating traditional signature tools and forcing defenders to rely on behavioural analytics. IBM research shows such malware now negotiates ransoms without human contact and pivots tactics based on cloud configuration, complicating incident response. The U.S. Department of Justice recently dismantled a ring that stole USD 263 million in cryptocurrency through AI-enabled exploits, underscoring the financial risk. North American enterprises are boosting budget for machine-learning detection, making the threat intelligence market essential for cloud workload protection.
EU-NIS2 Compliance Spend by Critical Infrastructure Operators
Effective October 2024, the NIS2 directive subjects roughly 300,000 European entities to mandatory risk assessments, incident reporting, and supply-chain scrutiny. Penalties can reach EUR 10 million or 2% of global turnover, pushing boards to prioritise real-time intelligence. Multinationals outside the bloc must also comply when serving EU customers, widening opportunity for vendors that package ready-to-audit intelligence feeds.
STIX/TAXII Interoperability Gaps in Legacy SOCs
Although STIX and TAXII became OASIS standards in 2021, many legacy platforms still process proprietary formats, preventing seamless data sharing. An exploratory study identified integration complexity and inconsistent notation as primary hurdles. As a result, organisations delay platform upgrades, restraining short-term spending.
Other drivers and restraints analyzed in the detailed report include:
- Zero Trust Roll-outs in APAC Large Enterprises
- RaaS Cartels Fuelling Crypto-Wallet Monitoring Demand
- Escalating Subscription Costs for Actionable Intel Data
For complete list of drivers and restraints, kindly check the Table Of Contents.
Segment Analysis
Solutions generated 56% of global revenue in 2024, giving platforms an outsized hold on the threat intelligence market. Microsoft Defender Threat Intelligence alone processes 78 trillion signals per day, highlighting scale advantages. This dominance underlines why the threat intelligence market size attached to platforms is expected to keep rising through 2030. Leading vendors incorporate AI for behaviour analytics, easing analyst workload and improving detection fidelity.
Managed and professional services are outpacing product growth with a 14.5% CAGR, reflecting talent shortages and rising complexity. SANS surveys show many enterprises outsource hunting duties to close skill gaps. Partnerships that wrap training around deployments allow buyers to derive quicker value, propelling service uptake, especially across the threat intelligence industry's mid-market segment.
On-premise deployments held 55% of spending in 2024 as heavily regulated sectors prefer local data residency. Even so, cloud-hosted platforms are the fastest riser at 16.8% CAGR, signalling confidence in provider hardening and FedRAMP expansions such as Microsoft Defender Threat Intelligence gaining High attestation. Segment observers see the threat intelligence market size for cloud deliveries eclipsing on-premise totals late in the forecast window.
Hybrid approaches blend legacy sensors with SaaS analytics, appealing to organisations modernising at their own pace. Financial regulators now publish blueprints for secure cloud adoption that specifically mention continuous intelligence integration, accelerating momentum.
The Threat Intelligence Market Report is Segmented by Component (Solutions, and Services), Deployment (On-Premise, Cloud, and Hybrid), Threat-Intelligence Type (Strategic, Tactical, Operational, and Technical), Organization Size (Large Enterprises, and Small and Medium-Sized Enterprises), End-User Industry (BFSI, IT and Telecommunications, and More), and Geography. The Market Forecasts are Provided in Terms of Value (USD).
Geography Analysis
North America commanded 38% of 2024 revenue owing to mature cloud uptake, joint public-private information sharing, and deep vendor presence. Legislators continue to refine disclosure laws, while federal bodies sponsor real-time data-exchange platforms that reinforce the threat intelligence market. AI-enabled malware against cloud workloads remains the top regional concern, keeping platform spending buoyant.
Europe's outlook brightens under NIS2, which scales mandatory coverage from 20 000 to 300 000 entities, greatly enlarging the addressable threat intelligence market. Complementary legislation such as the Cyber Resilience Act furthers demand for continuous vulnerability context across supply chains. Vendors that package audit-ready reporting with multi-lingual threat data are well positioned.
The Middle East shows the fastest CAGR at 15.8% through 2030. National agencies in the UAE and Saudi Arabia invest in sector-focused fusion centres while energy majors receive cyber-insurance discounts tied to live feeds. Rising geopolitical tension in the region elevates the strategic value of the threat intelligence market for both public and private sectors.
Asia-Pacific sees a double-digit attack uptick, notably in Indonesia where weekly incidents top 3,300. Rapid digitalisation, paired with diverse sovereignty rules, produces fragmented demand. Japan, South Korea, and Australia lead Zero Trust pilots that embed live intelligence into access decisions, while China and India's data-localisation laws create preferences for in-country cloud nodes.
South America's adoption is spurred by mid-tier BFSI outsourcing threat-hunting to overcome skills shortages, adding to global revenue even if from a smaller base.
- IBM Corporation
- Cisco Systems Inc.
- Dell Technologies Inc.
- CrowdStrike Holdings Inc.
- Check Point Software Technologies Ltd.
- Trend Micro Incorporated
- Palo Alto Networks Inc.
- Fortinet Inc.
- Rapid7 Inc.
- Secureworks Inc.
- FireEye - Trellix
- Recorded Future Inc.
- Anomali Inc.
- LookingGlass Cyber Solutions Inc.
- LogRhythm Inc.
- McAfee LLC
- Broadcom Inc. (Symantec)
- Juniper Networks Inc.
- F-Secure Corporation
- SentinelOne Inc.
- Microsoft Corp. (Defender Threat Intelligence)
Additional Benefits:
- The market estimate (ME) sheet in Excel format
- 3 months of analyst support
TABLE OF CONTENTS
1 Introduction
- 1.1 Study Assumptions and Market Definition
- 1.2 Scope of the Study
2 Research Methodology
3 Executive Summary
4 Market Landscape
- 4.1 Market Overview
- 4.2 Market Drivers
- 4.2.1 AI-Driven Polymorphic Malware Targeting Cloud-Native Workloads in North America
- 4.2.2 EU-NIS2 Compliance Spend by Critical Infrastructure Operators
- 4.2.3 Zero-Trust Roll-outs in APAC Large Enterprises
- 4.2.4 RaaS Cartels Fueling Crypto-Wallet Monitoring Demand
- 4.2.5 Outsourced Threat-Hunting by South-American Mid-Tier BFSI
- 4.2.6 Cyber-Insurance Premium Discounts Tied to Live Threat Feeds (Middle East Energy)
- 4.3 Market Restraints
- 4.3.1 STIX/TAXII Interoperability Gaps in Legacy SOCs
- 4.3.2 Escalating Subscription Costs for Actionable Intel Data
- 4.3.3 Data-Sovereignty Barriers (China CSL, India DPDP, etc.)
- 4.3.4 Analyst Fatigue and Alert Overload in Resource-Constrained Teams
- 4.4 Regulatory Outlook
- 4.5 Technological Outlook
- 4.6 Porter's Five Forces Analysis
- 4.6.1 Threat of New Entrants
- 4.6.2 Bargaining Power of Buyers
- 4.6.3 Bargaining Power of Suppliers
- 4.6.4 Threat of Substitute Products
- 4.6.5 Intensity of Competitive Rivalry
- 4.7 Assessment of the Impact of Macroeconomic Factors on the Market
5 Market Size and Growth Forecasts (Value)
- 5.1 By Component
- 5.1.1 Solutions
- 5.1.1.1 Threat Intelligence Platforms
- 5.1.1.2 Security Information and Event Management (SIEM) Feeds
- 5.1.1.3 Threat Hunting/Analytics Tools
- 5.1.2 Services
- 5.1.2.1 Managed/Outsourced Services
- 5.1.2.2 Professional and Consulting
- 5.1.2.3 Training and Support
- 5.1.1 Solutions
- 5.2 By Deployment
- 5.2.1 On-premise
- 5.2.2 Cloud
- 5.2.3 Hybrid
- 5.3 By Threat-Intelligence Type
- 5.3.1 Strategic
- 5.3.2 Tactical
- 5.3.3 Operational
- 5.3.4 Technical
- 5.4 By Organization Size
- 5.4.1 Large Enterprises
- 5.4.2 Small and Medium-Sized Enterprises
- 5.5 By End-user Industry
- 5.5.1 BFSI
- 5.5.2 IT and Telecommunications
- 5.5.3 Retail and E-commerce
- 5.5.4 Manufacturing
- 5.5.5 Healthcare and Life Sciences
- 5.5.6 Government and Defense
- 5.5.7 Energy and Utilities
- 5.5.8 Others
- 5.6 By Geography
- 5.6.1 North America
- 5.6.1.1 United States
- 5.6.1.2 Canada
- 5.6.1.3 Mexico
- 5.6.2 South America
- 5.6.2.1 Brazil
- 5.6.2.2 Argentina
- 5.6.2.3 Chile
- 5.6.2.4 Peru
- 5.6.2.5 Rest of South America
- 5.6.3 Europe
- 5.6.3.1 Germany
- 5.6.3.2 United Kingdom
- 5.6.3.3 France
- 5.6.3.4 Italy
- 5.6.3.5 Spain
- 5.6.3.6 Rest of Europe
- 5.6.4 Asia-Pacific
- 5.6.4.1 China
- 5.6.4.2 Japan
- 5.6.4.3 South Korea
- 5.6.4.4 India
- 5.6.4.5 Australia
- 5.6.4.6 New Zealand
- 5.6.4.7 Rest of Asia-Pacific
- 5.6.5 Middle East
- 5.6.5.1 United Arab Emirates
- 5.6.5.2 Saudi Arabia
- 5.6.5.3 Turkey
- 5.6.5.4 Rest of Middle East
- 5.6.6 Africa
- 5.6.6.1 South Africa
- 5.6.6.2 Rest of Africa
- 5.6.1 North America
6 Competitive Landscape
- 6.1 Strategic Developments
- 6.2 Vendor Positioning Analysis
- 6.3 Company Profiles (includes Global level Overview, Market level overview, Core Segments, Financials as available, Strategic Information, Products and Services, and Recent Developments)
- 6.3.1 IBM Corporation
- 6.3.2 Cisco Systems Inc.
- 6.3.3 Dell Technologies Inc.
- 6.3.4 CrowdStrike Holdings Inc.
- 6.3.5 Check Point Software Technologies Ltd.
- 6.3.6 Trend Micro Incorporated
- 6.3.7 Palo Alto Networks Inc.
- 6.3.8 Fortinet Inc.
- 6.3.9 Rapid7 Inc.
- 6.3.10 Secureworks Inc.
- 6.3.11 FireEye - Trellix
- 6.3.12 Recorded Future Inc.
- 6.3.13 Anomali Inc.
- 6.3.14 LookingGlass Cyber Solutions Inc.
- 6.3.15 LogRhythm Inc.
- 6.3.16 McAfee LLC
- 6.3.17 Broadcom Inc. (Symantec)
- 6.3.18 Juniper Networks Inc.
- 6.3.19 F-Secure Corporation
- 6.3.20 SentinelOne Inc.
- 6.3.21 Microsoft Corp. (Defender Threat Intelligence)
7 Market Opportunities and Future Outlook
- 7.1 White-space and Unmet-Need Assessment
 威胁建模工具市场分析及预测(至 2035 年):类型、产品类型、服务、技术、组件、应用、部署模式、最终用户、功能、解决方案威胁情报市场分析及预测(至 2035 年):类型、产品类型、服务、技术、组件、应用、部署模式、最终用户、解决方案、交付模式
 威胁情报市场规模、份额和成长分析(按解决方案、部署类型、组织规模、组件、最终用户产业和地区划分)-2026-2033年产业预测
 威胁情报市场规模、占有率、成长及全球产业分析:依类型、应用和地区划分的洞察与预测(2026-2034 年)
 全球基于人工智慧的网路威胁情报市场:预测至 2032 年——按组件、部署类型、组织规模、应用、最终用户和地区进行分析
 威胁建模工具市场-全球产业规模、份额、趋势、机会和预测,按组件、按平台、按最终用途行业、按地区和竞争细分,2020-2030 年
 威胁建模工具市场:按组件、部署类型、组织规模、垂直行业和用例划分 - 2025-2032 年全球预测威胁情报市场:按组件、威胁情报类型、部署模式、应用和组织规模划分 - 全球预测 2025-2032
 全球威胁情报市场(按产品、应用、部署模式、类型、组织规模、垂直领域和地区划分)- 预测至 2030 年
 全球威胁建模工具市场