


 |
市场调查报告书
商品编码
1851763
绿色包装:市场份额分析、行业趋势、统计数据和成长预测(2025-2030 年)Green Packaging - Market Share Analysis, Industry Trends & Statistics, Growth Forecasts (2025 - 2030) |
||||||
※ 本网页内容可能与最新版本有所差异。详细情况请与我们联繫。
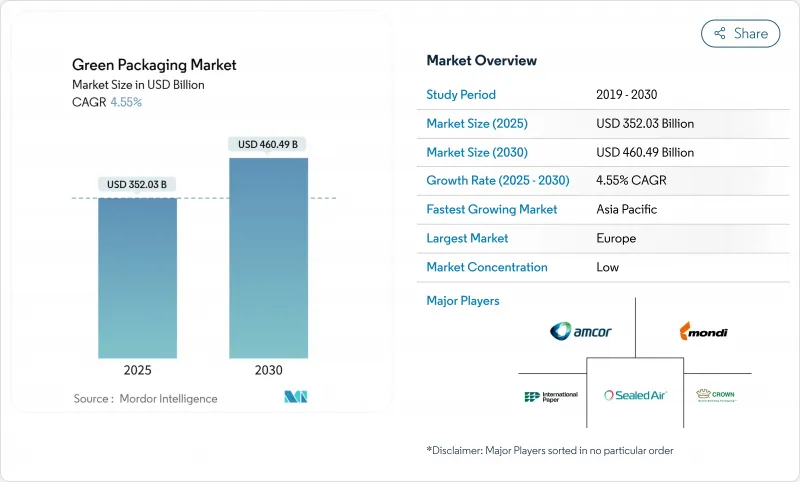
预计到 2025 年,绿色包装市场价值将达到 3,520.3 亿美元,到 2030 年将达到 4,604.9 亿美元,年复合成长率为 4.55%。
这种稳定成长是多种因素共同作用的结果:欧盟的《包装材料和包装法规》(PPWR) 等具有约束力的法规、企业实现净零包装目标以及再生材料带来的成本节约。
欧洲在政策严格性方面处于领先地位,包括强制要求在2030年实现全面回收、强制要求数位化可追溯性以及分阶段实施回收率配额。亚太地区的需求成长最为迅速,印度、韩国和日本加快了消费成长并禁止使用一次性塑胶製品。在公司层面,全球规模为合规性、研发和多材料处理能力提供了支持,例如Smurfit Kappa和WestRock的合併以及Novolex和Pactiv Evergreen的合併。技术突破,特别是数位数位浮水印和先进聚合物化学技术,正在消除以往闭合迴路回收在品质和速度方面的限制。
全球绿色包装市场趋势与洞察
严格禁止使用一次性塑胶製品
欧盟、印度和智利加速推进相关政策,将大幅限制传统聚合物的使用,并鼓励即时转向可堆肥薄膜和高回收率PET。俄罗斯将于2025年9月禁用某些类型的PET,欧盟已全面禁止在食品接触包装中使用双酚A。印度法规将于2025年要求饮料瓶中含有30%的消费后回收材料,智利则要求到2060年达到70%,这将缩短创新週期,并将资本支出引导至海藻基材料和PHA混合物。韩国的海洋创新计画展示了这些法规如何扶持拥有专利海洋生物质基材的新兴企业,并证明了其市场可行性。加州的「生产者延伸责任制」计划,在重复使用强制性规定的基础上,正将材料替代从品牌要求转变为竞争必需品。
企业环境、社会及治理 (ESG) 与净零包装承诺
品牌拥有者如今不再空谈永续性,而是以远超过监管标准的采购订单来取代空洞的口号。波尔的目标是到2030年实现85%的回收率和90%的全球铝回收率。联合利华于2024年5月承诺,到2025年实现100%可回收、可重复使用或可堆肥的产品形式,并将设计改进与绝对的材料减量目标相结合,这无疑加大了供应商的压力。欧莱雅设立了7,200万欧元的基金来支持可回收新兴企业,但该公司迄今的回收率仅49%。 Seven & i Holdings的「绿色挑战2050」计画旨在2030年使用50%的永续原料,并已与多个国家签署承购协议,以证明其生产PHA和生物基PE专用生产线的必要性。一旦这些跨国公司设定了基准规范,二级供应商就必须遵守这些规范才能继续留在核准供应商名单中。
生物基原料供应的限制
PLA、PHA 和淀粉衍生物的生产依赖农业投入,而这些投入又与食品和生质燃料的需求竞争。 SK Chemicals 和 NatureWorks 面临玉米和糖价波动带来的挑战,这些波动会影响树脂价格,导致生物聚合物在商品价格上涨期间竞争力下降。北美和欧洲有限的发酵和精炼能力造成了瓶颈,导致现货供不应求,迫使加工商采用双重采购或改用再生 PET。大规模产能扩张需要投资数亿美元建造折旧免税额长达十年的工厂,这阻碍了对需求激增的快速反应。季节性因素也会增加风险,因为收穫週期会影响年度产量,使库存和现金流量管理更加复杂。
细分市场分析
在纸张、金属、玻璃和PET回收系统成熟的支撑下,到2024年,再生材料解决方案将占绿色包装市场60.35%的份额。可降解包装虽然目前规模较小,但其复合年增长率高达7.94%,并受益于即将实施的一次性塑胶禁令。目前的绿色包装市场支持对回收和可降解包装两个方面的投资:回收利用可带来即时的成本效益,而可降解包装则能满足未来更严格的消费后塑胶法规。主要的快速消费品企业正在选择使用再生PET来实现瓶到瓶的循环利用,而快餐连锁店则在试点使用可在海洋环境中降解的海藻吸管。透过利用可重复使用的桶子和木箱,各行业正在证明,在单一的绿色包装市场架构中,产品的耐用性和材料的循环利用可以并存。
可重复使用的物流新兴企业正在透过引入物联网标籤的容器来降低人口密集城市走廊的整体成本,这些容器可在使用30次后重复使用。预计随着德国PFAND计画等大众零售措施的推进,可重复使用系统的绿色包装市场规模将持续成长。同时,Loop和Pa(fyll)正在将其押金返还模式扩展到美妆和家居领域,证明消费者的便利性可以与循环经济的要求相契合。可回收、可降解和可重复使用设计之间的相互作用,既能使收入来源多元化,又能有效抵御原材料价格波动带来的影响。
2024年,可回收PET、HDPE和PP将占总收入的68.24%,这主要得益于路边回收的广泛覆盖以及饮料巨头对瓶装级rPET的需求。 Indorama和酵母宣布扩大机械和化学回收规模,这将为满足欧盟再生材料含量基准值提供必要的原料。然而,PLA和PHA的复合年增长率将达到8.45%,这主要受政策禁令、企业试点计画以及具有冷冻库级阻隔性能的新型混合物的推动。纸张和纸板将凭藉防油防水的奈米纤维素涂层重新夺回市场份额,为快餐店提供氟化学品的替代方案。预计先进纤维基绿色包装的市场规模将在电子商务通路中成长最快,因为在电商通路,尺寸品质比货架上的视觉吸引力更为重要。
玻璃和金属的无限可回收性使其在高端饮料和化妆品领域占据了一席之地,品牌股权足以弥补重量上的劣势。随着波尔公司85%的再生材料含量目标确保了合约需求,铝材的使用量将呈上升趋势。相反,由于拆卸成本超过回收价值,多层复合材料的市场份额将会下降,这将促使品牌所有者转向整体式聚乙烯(PE)和聚丙烯(PP)解决方案。因此,在绿色包装市场中,材料替代决策必须在功能性、成本和合规性之间取得平衡,以满足每种应用的需求。
绿色包装市场报告按包装类型(再生材料包装、可重复使用包装、可降解包装)、材料(纸和纸板、玻璃、其他)、包装功能(一级、二级、其他)、最终用户行业(食品、食品饮料、其他)和地区(北美、欧洲、亚太、南美、中东和非洲)进行细分。
区域分析
在《塑胶包装可回收性指令》(PPWR)的推动下,欧洲在2024年维持了36.54%的市占率。该指令要求在2030年实现完全可回收,且再生塑胶含量达30%。德国的押金返还率超过98%,确保了瓶到瓶循环利用过程中PET塑胶的高品质;而法国2025年的《再利用法案》将加速灌装基础设施的建设。北欧的创新企业正在引入纤维基阻隔层数位浮水印,为该地区成熟的零售网路树立了功能性标竿。然而,复杂的跨境合规要求给中小企业带来了沉重的负担,他们必须在27个不同的司法管辖区内协调标籤检视、再生塑胶含量和报告标准。
亚太地区到2030年将以8.32%的复合年增长率成为成长最快的地区,这主要得益于人口密度快速成长和都市区消费的推动。印度的包装产业目标是到2025年达到2,048.1亿美元,并正在加强QR码溯源,以遏制非正规回收。日本奢侈品牌正在采用生物基PET(生物基PET)生产化妆品瓶,而韩国的食品废弃物分类率已超过90%,并正在推进可堆肥包装的报废处理。为了维持市场进入,中国以出口为导向的加工企业正在努力符合欧盟标准,并透过区域供应基地来满足更严格的规范要求。然而,生物基树脂的快速普及导致供应趋紧,促使泰国和印尼等国成立合资企业,以实现PLA(聚乳酸)产能的在地化。
北美的发展势头喜忧参半。加州的生产者责任延伸制度(EPR)要求在2030年实现50%的产品可回收或可重复使用,并鼓励大型零售商进行可重复填充试点计画。加拿大的塑胶公约实现了50%的再生设计目标,但在下游分类基础设施仍面临挑战。同时,像Novolex和Pactiv Evergreen这样的合併案带来了规模经济效益,有助于应对各州不同的法律法规。墨西哥融入美国供应链,刺激了对再生纸厂的投资,也促使企业需要在成本和永续性之间取得平衡。这些动态使得北美大陆能够选择性地向前发展,而领先企业则在监管、消费者情绪和基础设施的交汇点上汇聚。
其他好处
- Excel格式的市场预测(ME)表
- 3个月的分析师支持
目录
第一章 引言
- 研究假设和市场定义
- 调查范围
第二章调查方法
第三章执行摘要
第四章 市场情势
- 市场概览
- 市场驱动因素
- 严格禁止使用一次性塑胶製品
- 企业环境、社会及治理 (ESG) 与净零包装承诺
- 透过减轻重量和回收来降低成本
- 数位浮水印可实现高速分拣
- 快速部署闭合迴路补给物流
- 市场限制
- 生物基原料供应的限制
- 与传统包装相比,单价更高
- 可堆肥材料的障碍和特征局限性
- 堆肥/厌氧消化基础设施分散。
- 供应链分析
- 监管环境
- 技术展望
- 波特五力分析
- 供应商的议价能力
- 买方的议价能力
- 新进入者的威胁
- 替代品的威胁
- 竞争对手之间的竞争
第五章 市场规模与成长预测
- 按包装类型
- 可回收材料包装
- 纸
- 金属
- 塑胶
- 玻璃
- 可重复使用的包装
- 鼓
- 塑胶週转箱和IBC吨桶
- 托盘和垫材
- 可降解包装
- 可堆肥生物聚合物
- 可食用/水溶性薄膜
- 可回收材料包装
- 材料
- 纸和纸板
- 玻璃
- 金属(铝、钢)
- 硬质和软质再生塑料
- 生物聚合物(PLA、PHA、淀粉混合物)
- 按最终用户行业划分
- 食物
- 饮料
- 製药
- 个人护理和化妆品
- 电子商务与零售
- 其他终端用户产业
- 透过包装功能
- 基本的
- 二次性
- 第三产业/交通运输
- 按地区
- 北美洲
- 美国
- 加拿大
- 墨西哥
- 欧洲
- 德国
- 英国
- 法国
- 义大利
- 西班牙
- 俄罗斯
- 其他欧洲地区
- 亚太地区
- 中国
- 印度
- 日本
- 韩国
- 澳洲和纽西兰
- 亚太其他地区
- 中东和非洲
- 中东
- 阿拉伯聯合大公国
- 沙乌地阿拉伯
- 土耳其
- 其他中东地区
- 非洲
- 南非
- 奈及利亚
- 埃及
- 其他非洲地区
- 南美洲
- 巴西
- 阿根廷
- 其他南美洲
- 北美洲
第六章 竞争情势
- 市场集中度
- 策略趋势
- 市占率分析
- 公司简介
- Amcor PLC
- Mondi Group
- Tetra Pak International SA
- International Paper Co.(DS Smith PLC)
- Smurfit WestRock
- Ball Corporation
- Crown Holdings Inc.
- Ardagh Group SA
- Sealed Air Corporation
- Sonoco Products Co.
- Uflex Ltd.
- Plastipak Holdings Inc.
- Brambles Ltd.(CHEP)
- IFCO Systems
- Menasha Corporation
- Emerald Packaging
- Elopak ASA
第七章 市场机会与未来展望
The green packaging market size stood at USD 352.03 billion in 2025 and is forecast to reach USD 460.49 billion by 2030, expanding at a 4.55% CAGR.This steady growth results from converging forces: binding regulations such as the European Union's PPWR, corporate net-zero packaging targets, and cost reduction from recycled feedstocks.
Europe leads in policy stringency, mandating full recyclability by 2030, compulsory digital traceability, and step-wise recycled-content quotas. Asia-Pacific delivers the fastest incremental demand as India, South Korea, and Japan combine expanding consumption with escalating bans on single-use plastics. At the company level, megamergers such as Smurfit Kappa-WestRock and Novolex-Pactiv Evergreen signal that global scale now underpins compliance, R&D, and multi-material capabilities. Technology breakthroughs-particularly digital watermarking and advanced polymer chemistry-remove earlier quality and speed constraints in closed-loop recycling.
Global Green Packaging Market Trends and Insights
Stringent bans on single-use plastics
Accelerated policy roll-outs across the European Union, India, and Chile sharply limit legacy polymers and stimulate immediate switches to compostable films and high-recycled-content PET. Russia's September 2025 prohibition on specific PET items and the EU's blanket ban on Bisphenol A in food contact packaging wipe out entire material categories, forcing converters to fast-track biopolymer commercialisation. Indian rules introduce 30% post-consumer recycled content for beverage bottles in 2025, while Chile pushes the requirement to 70% by 2060, compressing innovation cycles and redirecting CAPEX toward seaweed-based and PHA blends. South Korea's Marine Innovation illustrates how these rules nurture startups that hold patents for ocean-biomass substrates, proving market-ready viability. California's extended producer responsibility regime layers on reuse mandates, turning material substitution into a competitive necessity rather than a branding exercise.
Corporate ESG and net-zero packaging pledges
Brand owners now translate sustainability rhetoric into purchase orders that exceed regulatory floors. Ball Corporation is moving to 85% recycled content by 2030 and targets a 90% global aluminum recycling rate, effectively guaranteeing demand for secondary smelter output. Unilever's May 2024 pledge to achieve 100% recyclable, reusable, or compostable formats by 2025 combines design changes with absolute material reduction targets, amplifying pressure on suppliers. L'Oreal's EUR 72 million fund backs recycling start-ups despite the company only hitting 49% recyclability so far, indicating that capital is migrating toward scalable solutions rather than incremental tweaks. Seven & i Holdings' GREEN CHALLENGE 2050 specifies 50% sustainable inputs by 2030, anchoring multi-country offtake agreements that justify dedicated production lines for PHA or bio-PE. Once these multinationals set baseline specifications, tier-2 suppliers must comply to remain on approved vendor lists.
Bio-based feedstock supply constraints
PLA, PHA, and starch derivatives hinge on agricultural inputs that compete with food and biofuel demand. SK Chemicals and NatureWorks face corn and sugar price volatility that dictates resin pricing, making biopolymers less competitive during commodity spikes. Limited fermentation and purification assets in North America and Europe create bottlenecks that lead to spot shortages, forcing converters to dual-source or revert to recycled PET. Large-scale capacity additions require multi-hundred-million-dollar plants with decade-long depreciation, dampening rapid response to demand surges. Seasonality compounds risk as harvest cycles shape annual throughput, complicating inventory and cash-flow management.
Other drivers and restraints analyzed in the detailed report include:
- Cost savings from light-weighting and recycling
- Digital watermarking enabling high-speed sortation
- Higher unit costs vs. legacy packaging
For complete list of drivers and restraints, kindly check the Table Of Contents.
Segment Analysis
Recycled-content solutions retained 60.35% of the green packaging market in 2024, supported by mature collection systems for paper, metal, glass, and PET. Degradable formats, while smaller now, are pacing a 7.94% CAGR and benefit from imminent bans on single-use plastics. The current green packaging market supports investment in both streams because recycling delivers immediate cost advantages whereas degradables future-proof against stricter end-of-life rules. Primary adopters in FMCG select recycled PET for bottle-to-bottle loops, while QSR chains pilot seaweed-based straws that degrade in marine settings. Industrial players leverage reusable drums and crates, demonstrating that longevity and material circularity can coexist within a single green packaging market architecture.
Start-ups in refill logistics deploy IoT-tagged containers that cycle through 30 uses before refurbishment, driving total cost downward across high-density urban corridors. The green packaging market size for reusable systems is projected to climb alongside mass-retail initiatives such as Germany's PFAND scheme. In parallel, Loop and Pa(fyll) extend deposit-and-return models into beauty and household segments, evidence that consumer convenience can align with circularity mandates. Collectively, the interplay of recycled, degradable, and reusable designs diversifies revenue pools while creating hedges against raw-material shocks.
Recyclable PET, HDPE, and PP combine for 68.24% of 2024 revenue thanks to wide curbside coverage and bottle-grade rPET demand from beverage majors. Mechanical and chemical recycling expansions announced by Indorama and Eastman supply the feedstock required to reach EU recycled-content thresholds. However, PLA and PHA post an 8.45% CAGR, leveraged by policy bans, corporate pilots, and new blends that achieve freezer-grade barrier properties. Paper and paperboard regain share via nano-cellulose coatings that repel grease and water, giving quick-service restaurants an alternative to fluorinated chemistries. The green packaging market size for advanced fibre substrates is projected to expand fastest in e-commerce channels where dimensional quality outranks visual shelf appeal.
Glass and metal's infinite recyclability secures niche positions in premium beverages and cosmetics where brand equity offsets weight penalties. Aluminum trends up as Ball Corporation's 85% recycled-content target guarantees contracted demand. Conversely, multilayer laminates lose share because disassembly costs outweigh recycling value, propelling brand owners to mono-material PE or PP solutions. Material substitution decisions thus hinge on balancing functionality, cost, and compliance within each green packaging market application.
The Green Packaging Market Report is Segmented by Packaging Type (Recycled Content Packaging, Reusable Packaging, Degradable Packaging), Material (Paper and Paperboard, Glass and More), Packaging Function (Primary, Secondary, and More), End User Industry (Food, Beverage, and More), and Geography (North America, Europe, Asia-Pacific, South America, Middle East and Africa).
Geography Analysis
Europe maintained a 36.54% share in 2024, propelled by the PPWR mandate that compels full recyclability by 2030 and 30% recycled plastic content. Germany's deposit return rate surpasses 98%, ensuring high-quality PET for bottle-to-bottle loops, while France's 2025 reuse legislation accelerates refill infrastructure. Nordic innovators deploy fibre-based barriers and digital watermarks, setting functional benchmarks for the region's sophisticated retail networks. Complex cross-border compliance, however, burdens SMEs that must align labelling, recycled-content, and reporting standards across 27 jurisdictions.
Asia-Pacific delivers the fastest 8.32% CAGR through 2030 as population density and urban consumption surge. India's packaging sector aims for USD 204.81 billion by 2025 and enforces QR-code traceability to curb informal recycling practices. Japan's premium brands adopt bio-PET in cosmetic bottles, while South Korea records over 90% food-waste separation, enabling compostable packaging end-of-life processing. China's export-oriented converters move to meet EU compliance so they can retain market access, cascading stricter specifications through regional supply bases. Rapid uptake, though, strains bio-resin supply, fostering joint ventures in Thailand and Indonesia to localise PLA capacity.
North America shows mixed momentum. California's EPR rules mandate 50% recyclable or reusable design by 2030 and incentivise refill pilots from big-box retailers. Canada's Plastics Pact reaches 50% design-for-recycling but still struggles with downstream sorting infrastructure. Meanwhile, mergers such as Novolex-Pactiv Evergreen embed scale advantages in navigating disparate state laws. Mexico's integration into US supply chains draws investment in recycled-paper mills, aligning cost and sustainability imperatives. These dynamics position the continent to advance selectively, with leadership pockets clustered where regulation, consumer sentiment, and infrastructure intersect.
- Amcor PLC
- Mondi Group
- Tetra Pak International SA
- International Paper Co. (DS Smith PLC)
- Smurfit WestRock
- Ball Corporation
- Crown Holdings Inc.
- Ardagh Group SA
- Sealed Air Corporation
- Sonoco Products Co.
- Uflex Ltd.
- Plastipak Holdings Inc.
- Brambles Ltd. (CHEP)
- IFCO Systems
- Menasha Corporation
- Emerald Packaging
- Elopak ASA
Additional Benefits:
- The market estimate (ME) sheet in Excel format
- 3 months of analyst support
TABLE OF CONTENTS
1 INTRODUCTION
- 1.1 Study Assumptions and Market Definition
- 1.2 Scope of the Study
2 RESEARCH METHODOLOGY
3 EXECUTIVE SUMMARY
4 MARKET LANDSCAPE
- 4.1 Market Overview
- 4.2 Market Drivers
- 4.2.1 Stringent bans on single-use plastics
- 4.2.2 Corporate ESG and net-zero packaging pledges
- 4.2.3 Cost savings from light-weighting and recycling
- 4.2.4 Digital watermarking enabling high-speed sortation
- 4.2.5 Rapid roll-out of closed-loop refill logistics
- 4.3 Market Restraints
- 4.3.1 Bio-based feedstock supply constraints
- 4.3.2 Higher unit costs vs. legacy packaging
- 4.3.3 Barrier-property limitations in compostables
- 4.3.4 Patchy composting / anaerobic-digestion infra
- 4.4 Supply-Chain Analysis
- 4.5 Regulatory Landscape
- 4.6 Technological Outlook
- 4.7 Porter's Five Forces Analysis
- 4.7.1 Bargaining Power of Suppliers
- 4.7.2 Bargaining Power of Buyers
- 4.7.3 Threat of New Entrants
- 4.7.4 Threat of Substitutes
- 4.7.5 Intensity of Competitive Rivalry
5 MARKET SIZE AND GROWTH FORECASTS (VALUE)
- 5.1 By Packaging Type
- 5.1.1 Recycled-Content Packaging
- 5.1.1.1 Paper
- 5.1.1.2 Metal
- 5.1.1.3 Plastic
- 5.1.1.4 Glass
- 5.1.2 Reusable Packaging
- 5.1.2.1 Drums
- 5.1.2.2 Plastic Crates and IBCs
- 5.1.2.3 Pallets and Dunnage
- 5.1.3 Degradable Packaging
- 5.1.3.1 Compostable Biopolymers
- 5.1.3.2 Edible and Water-soluble Films
- 5.1.1 Recycled-Content Packaging
- 5.2 By Material
- 5.2.1 Paper and Paperboard
- 5.2.2 Glass
- 5.2.3 Metals (Al, Steel)
- 5.2.4 Rigid and Flexible Recyclable Plastics
- 5.2.5 Biopolymers (PLA, PHA, Starch blends)
- 5.3 By End-User Industry
- 5.3.1 Food
- 5.3.2 Beverage
- 5.3.3 Pharmaceutical
- 5.3.4 Personal Care and Cosmetics
- 5.3.5 E-commerce and Retail
- 5.3.6 Other End-User Industry
- 5.4 By Packaging Function
- 5.4.1 Primary
- 5.4.2 Secondary
- 5.4.3 Tertiary / Transport
- 5.5 By Geography
- 5.5.1 North America
- 5.5.1.1 United States
- 5.5.1.2 Canada
- 5.5.1.3 Mexico
- 5.5.2 Europe
- 5.5.2.1 Germany
- 5.5.2.2 United Kingdom
- 5.5.2.3 France
- 5.5.2.4 Italy
- 5.5.2.5 Spain
- 5.5.2.6 Russia
- 5.5.2.7 Rest of Europe
- 5.5.3 Asia-Pacific
- 5.5.3.1 China
- 5.5.3.2 India
- 5.5.3.3 Japan
- 5.5.3.4 South Korea
- 5.5.3.5 Australia and New Zealand
- 5.5.3.6 Rest of Asia-Pacific
- 5.5.4 Middle East and Africa
- 5.5.4.1 Middle East
- 5.5.4.1.1 United Arab Emirates
- 5.5.4.1.2 Saudi Arabia
- 5.5.4.1.3 Turkey
- 5.5.4.1.4 Rest of Middle East
- 5.5.4.2 Africa
- 5.5.4.2.1 South Africa
- 5.5.4.2.2 Nigeria
- 5.5.4.2.3 Egypt
- 5.5.4.2.4 Rest of Africa
- 5.5.5 South America
- 5.5.5.1 Brazil
- 5.5.5.2 Argentina
- 5.5.5.3 Rest of South America
- 5.5.1 North America
6 COMPETITIVE LANDSCAPE
- 6.1 Market Concentration
- 6.2 Strategic Moves
- 6.3 Market Share Analysis
- 6.4 Company Profiles (includes Global level Overview, Market level overview, Core Segments, Financials as available, Strategic Information, Market Rank/Share for key companies, Products and Services, and Recent Developments)
- 6.4.1 Amcor PLC
- 6.4.2 Mondi Group
- 6.4.3 Tetra Pak International SA
- 6.4.4 International Paper Co. (DS Smith PLC)
- 6.4.5 Smurfit WestRock
- 6.4.6 Ball Corporation
- 6.4.7 Crown Holdings Inc.
- 6.4.8 Ardagh Group SA
- 6.4.9 Sealed Air Corporation
- 6.4.10 Sonoco Products Co.
- 6.4.11 Uflex Ltd.
- 6.4.12 Plastipak Holdings Inc.
- 6.4.13 Brambles Ltd. (CHEP)
- 6.4.14 IFCO Systems
- 6.4.15 Menasha Corporation
- 6.4.16 Emerald Packaging
- 6.4.17 Elopak ASA
7 MARKET OPPORTUNITIES AND FUTURE OUTLOOK
- 7.1 White-space and Unmet-Need Assessment
 回收半导体封装市场分析及预测(至2035年):依类型、产品类型、服务、技术、组件、应用、材料类型、製程、最终用户划分绿色包装市场分析及预测(至2035年):依类型、产品类型、材料类型、技术、应用、製程、最终用户、采用情形及解决方案划分
 2026年全球单一材料包装市场报告2026年全球环保化妆品包装市场报告
 绿色包装薄膜市场-2026-2031年预测
 可堆肥薄膜树脂市场:按树脂类型、加工技术、应用和最终用途产业划分-全球预测(2026-2032 年)家用可堆肥薄膜市场:按应用、终端用户产业、材料成分、製造流程、薄膜类型和厚度划分-2026-2032年全球预测
 日本绿色包装市场规模、份额、趋势及预测(按包装类型、最终用途行业和地区划分,2026-2034年)
 绿色包装市场规模、份额、成长分析(按类型、材料类型、包装类型、分销管道、最终用途和地区划分)-2026-2033年产业预测
 全球极简主义与零废弃物包装市场:预测至2032年-按包装类型、材料类型、分销管道、应用和地区分類的分析