


 |
市场调查报告书
商品编码
1851781
基础设施即服务 (IaaS):市场占有率分析、产业趋势、统计数据和成长预测 (2025-2030)Infrastructure As A Service - Market Share Analysis, Industry Trends & Statistics, Growth Forecasts (2025 - 2030) |
||||||
※ 本网页内容可能与最新版本有所差异。详细情况请与我们联繫。
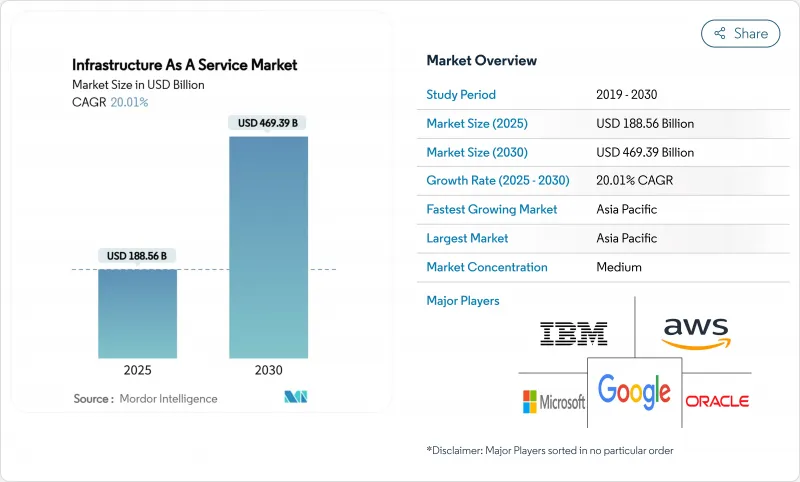
预计到 2025 年,基础设施即服务 (IaaS) 市场规模将达到 1,885.6 亿美元,到 2030 年将达到 4,693.9 亿美元,在预测期(2025-2030 年)内,复合年增长率将达到 20.01%。
生成式人工智慧训练的需求、企业混合云迁移的加速以及每年超过2500亿美元的超大规模资本支出将支撑这一发展趋势。液冷资料中心设计、支援5G延迟的边缘部署以及自主人工智慧计画共同推动了高投资水准的持续成长。随着超大规模资料中心业者竞相拓展区域容量,而国家级服务供应商则利用资料居住要求,竞争日益激烈。由于营运商需要缓解电网压力并满足严格的永续性目标,再生能源购电协议的期限和规模都在不断扩大。云端基础设施市场正迈入下一个阶段,即地理分散式、人工智慧赋能的成长阶段。
全球基础设施即服务 (IaaS) 市场趋势与洞察
对生成式人工智慧基础设施的需求正在加速成长
据估计,生成式人工智慧训练集群每个晶片需要700W的GPU机架,这将推动液冷技术在资料中心的普及率从2024年的10%成长到2025年的20%。 DataCenterFrontier指出,超大规模资料中心营运商目前正在围绕1MW液冷机架重新设计其园区,并采用400V直流配电标准以降低转换损耗。近40%的资料中心营运商计划在2026年使用液冷技术来託管人工智慧工作负载。这项技术变革正在重塑资料中心的设计蓝图,使人工智慧赋能的设计成为整个云端基础设施市场的预设要求。
企业混合云和多重云端迁移激增
为了平衡成本和合规性,企业现在正将工作负载分布在多个云端平台。 IBM 于 2024 年以 64 亿美元收购 HashiCorp,这将进一步深化多重云端编配自动化。 Oracle 和 Google 的多重云端合作关係消除了 Google 区域内Oracle资料库的出口费用,从而扫清了工作负载可携性的长期障碍。银行业采用率尤其强劲,70% 的金融机构已完成试点部署,这主要得益于资料驻留规则和营运弹性测试的推动。随着混合云模式的扩展,专业服务供应商在管治和安全咨询领域获得了新的收入,从而强化了云端基础设施市场的良性循环。
日益增长的电网约束
2023年,资料中心已消耗了美国4.4%的电力。到2028年,这一比例可能达到12%,对传统电网带来巨大压力。曾经的资料中心枢纽——北维吉尼亚和德克萨斯州,如今都已限制兆瓦级配额,迫使营运商转向印第安纳州和密西西比州寻求新的电力容量。在爱尔兰,预计到2030年,该国高达70%的电力将用于数位负载,促使一些郡县暂停了相关建设。营运商正在采用浸没式冷却技术来应对,该技术可将设施的能耗降低95%,但这些维修需要新的资金投入和更长的建设週期。因此,电力短缺正在减缓云端基础设施市场近期的扩张。
细分市场分析
到2024年,公共云端将占总营收的71.0%,这反映了过去十年来企业逐渐摆脱本地部署架构的趋势。然而,到2030年,混合云将以24.0%的复合年增长率(CAGR)实现最快成长,因为受监管产业需要将本地控制与外部部署规模结合。金融服务业的领导者认为,混合云架构有助于他们在满足客户体验目标的同时,顺利通过监管审核。预计到2030年,混合云部署的云端基础设施市场规模将达到1,420亿美元,凸显了混合云在平衡对延迟敏感和对合规性要求高的工作负载方面发挥的关键作用。
AWS Outposts 和 Azure Stack 等私有连线选项的激增正在推动这股混合云浪潮。芝加哥商品交易所集团 (CME Group) 在奥罗拉的 Google Cloud 私人区域展示如何在利用公共云端工具的同时,将关键交易业务保留在本地。 IBM 与 HashiCorp 合作开发的多功能编配软体降低了复杂性门槛。随着云端基础设施技术的日趋成熟,产业越来越倾向于将部署决策视为整体方案,而非非此即彼的选择。
IaaS(基础设施即服务)市场按部署类型(公共云端、私有云端、混合云端)、服务类型(计算即服务 (CaaS)、储存即服务 (STaaS)、资料库/分析即服务 (DBaaS) 等)、最终用户行业(银行、金融服务和保险 (BFSI)、IT 和电信、医疗保健和生命科学)以及地区进行细分。
区域分析
到2024年,亚太地区将占全球收入的43.2%,并维持21.4%的最快复合年增长率,这主要得益于中国、日本和印度政府的人工智慧计画对国内云端运算的补贴。光是中国的「东数据西」倡议每年就将向八个丛集投入4,000亿元人民币,将运算资源重新分配到内陆地区,缓解沿海地区的拥挤。到2030年,日本资料中心的价值将接近2兆日圆(约134亿美元),这主要得益于AWS承诺的150亿美元投资和Oracle承诺的80亿美元投资。印度将受益于NTT的15亿美元扩张计划以及当地有利于数位基础设施建设的税收优惠政策。
北美仍然是第二大云端服务中心,但由于传统资料中心的饱和,其相对成长速度正在放缓。能源限制促使计划流向一些先前被忽视的州:AWS 将在印第安纳州投资 110 亿美元,Compass 将在密西西比州破土动工建设价值 100 亿美元的园区,STACK 将在维吉尼亚北部投资超过 1 吉瓦。加拿大的「数位雄心」计画正在加速联邦政府采用云端运算。
欧洲正在努力平衡需求与碳中和目标。诸如DORA之类的法规迫使金融公司实现供应商多元化,而都柏林和阿姆斯特丹等传统资料中心则因国家能源上限的限製而容量受限。由于可再生能源电网和有利的授权製度,柏林、华沙、奥斯陆、苏黎世、米兰、维也纳和马赛等新兴城市正在崛起。欧盟在2030年实现资料中心零碳排放的目标正在推动对热能再利用方案和离岸风力发电併网的投资,从而塑造云端基础设施市场的下一阶段。
其他福利:
- Excel格式的市场预测(ME)表
- 3个月的分析师支持
目录
第一章 引言
- 研究假设和市场定义
- 调查范围
第二章调查方法
第三章执行摘要
第四章 市场情势
- 市场概览
- 市场驱动因素
- 对新一代人工智慧基础设施的需求加速成长,并逐渐成为主流。
- 企业混合云和多重云端迁移激增
- 超大规模资料中心营运商的资本支出竞争将占据主导地位(到2025年将超过2,500亿美元)。
- 5G时代主流的边缘到边缘延迟要求
- 低调的长期绿色能源购电协议为新的资料中心选址开闢了道路。
- 政府自主人工智慧沙盒正在建设中,本地IaaS节点授权
- 市场限制
- 主流能源电网约束日益增加
- 主流资料主权与域外管辖权之间的衝突
- 液冷供应链中隐藏的瓶颈
- 超过100兆瓦的超大规模园区保险费飙升
- 价值/供应链分析
- 监管环境
- 技术展望(人工智慧加速器、液冷、零信任架构)
- 波特五力模型
- 供应商的议价能力
- 买方的议价能力
- 新进入者的威胁
- 替代品的威胁
- 竞争对手之间的竞争
第五章 市场规模与成长预测
- 透过部署模式
- 公共云端
- 私有云端
- 混合云
- 按服务类型
- Compute as a Service(CaaS)
- Storage as a Service(STaaS)
- 网路与 CDN
- Database / Analytics as a Service(DBaaS)
- Disaster-Recovery as a Service(DRaaS)
- 託管主机/专用云
- 按最终用户行业划分
- BFSI
- 资讯科技与电信
- 医疗保健与生命科学
- 媒体与娱乐
- 零售与电子商务
- 政府和公共机构
- 製造业/汽车
- 按地区
- 北美洲
- 美国
- 加拿大
- 南美洲
- 巴西
- 阿根廷
- 欧洲
- 英国
- 德国
- 法国
- 俄罗斯
- 亚太地区
- 中国
- 日本
- 印度
- 韩国
- 澳洲
- 中东和非洲
- 中东
- 阿拉伯聯合大公国
- 沙乌地阿拉伯
- 土耳其
- 非洲
- 南非
- 奈及利亚
- 北美洲
第六章 竞争情势
- 市场集中度
- 策略趋势
- 市占率分析
- 公司简介
- Amazon Web Services(AWS)
- Microsoft Azure
- Google Cloud Platform(GCP)
- Alibaba Cloud
- IBM Cloud
- Oracle Cloud Infrastructure(OCI)
- Tencent Cloud
- Huawei Cloud
- OVHcloud
- DigitalOcean
- Rackspace Technology
- Hetzner
- Equinix Metal
- Cloudflare Workers/R2
- Linode/Akamai
- Oracle Cloud(Japan)
- Liquid Sky(Africa)
- Wasabi Technologies
- Scaleway
- SAP Business Technology Platform(BTP-IaaS portion)
第七章 市场机会与未来展望
The Infrastructure As A Service Market size is estimated at USD 188.56 billion in 2025, and is expected to reach USD 469.39 billion by 2030, at a CAGR of 20.01% during the forecast period (2025-2030).
Demand from generative-AI training, accelerating enterprise hybrid migrations, and hyperscaler capital expenditure above USD 250 billion per year underpin this trajectory. Liquid-cooled data-center designs, edge deployments supporting 5G latency, and sovereign AI initiatives together keep investment levels high. Competition intensifies as hyperscalers chase regional capacity while domestic providers leverage data-residency mandates. Power-purchase agreements for renewables are growing in length and scale because operators need to mitigate grid constraints and meet tightening sustainability targets. Collectively, these forces propel the cloud infrastructure market into its next phase of geographically distributed, AI-ready growth.
Global Infrastructure As A Service Market Trends and Insights
Accelerating Gen-AI Infrastructure Demand
Generative-AI training clusters require GPU racks drawing 700 W per chip, pushing liquid cooling adoption from 10% of data halls in 2024 to an estimated 20% in 2025. Hyperscalers now redesign campuses around 1 MW liquid-cooled racks, standardizing 400 V DC power distribution to curtail conversion losses, DataCenterFrontier. Enterprises echo the trend: nearly 40% of data-center operators plan to use liquid cooling by 2026 to host AI workloads. These technical shifts reshape facility blueprints, making AI-ready designs a default requirement across the cloud infrastructure market.
Enterprise Hybrid and Multi-Cloud Migration Spike
Organizations now spread workloads across multiple clouds to balance cost and compliance. IBM's USD 6.4 billion HashiCorp acquisition in 2024 deepens automation for multi-cloud orchestration. Oracle's and Google's multicloud tie-up eliminates egress fees for Oracle Database inside Google regions, removing a long-standing barrier to workload portability. Banking adoption is especially strong: 70% of institutions have moved beyond pilots, spurred by data-residency rules and operational-resilience tests. As hybrid patterns scale, specialized service providers find new revenue in governance and security advisory, reinforcing a virtuous cycle for the cloud infrastructure market.
Escalating Energy-Grid Constraints
Data centers already drew 4.4% of US electricity in 2023; the share may hit 12% by 2028, stressing legacy grids. Northern Virginia and Texas, once prime hubs, now ration megawatt allocations, sending operators to Indiana or Mississippi for fresh capacity. Ireland anticipates up to 70% of national power heading to digital loads by 2030, prompting moratoriums in some counties. Operators respond with immersion cooling that cuts facility power use by 95%, yet those retrofits demand fresh capital and extended build timelines. Limited electricity, therefore, slows the near-term expansion of the cloud infrastructure market.
Other drivers and restraints analyzed in the detailed report include:
- Hyperscaler CAPEX Race Exceeding USD 250 Billion
- Edge-to-Core Latency Requirements in the 5G Era
- Data-Sovereignty and Extraterritoriality Conflicts
For complete list of drivers and restraints, kindly check the Table Of Contents.
Segment Analysis
Public cloud held 71.0% of revenue in 2024, a reflection of a decade-long migration away from on-premises stacks. The hybrid tier, however, records the fastest 24.0% CAGR through 2030 as regulated industries mesh on-prem control with off-prem scale. Financial-services leaders credit hybrid setups for meeting customer-experience targets while passing regulatory audits. The cloud infrastructure market size for hybrid deployments is projected to reach USD 142 billion by 2030, underscoring its role in balancing latency-sensitive and compliance-critical workloads.
A sharp increase in private connectivity options such as AWS Outposts and Azure Stack supports this hybrid wave. CME Group's private Google Cloud region in Aurora illustrates how mission-critical trading stays local yet leverages public-cloud tooling. Multifaceted orchestration software-boosted by IBM's HashiCorp deal-lowers complexity barriers. As maturity rises, the cloud infrastructure industry increasingly views deployment decisions as a portfolio exercise rather than a binary choice.
The Infrastructure As A Service Market is Segmented by Deployment Mode (Public Cloud, Private Cloud and Hybrid Cloud), Service Type(Compute As A Service (CaaS), Storage As A Service (STaaS), Database / Analytics As A Service (DBaaS) and More), End-User Industry(BFSI, IT and Telecom, Healthcare and Life Sciences) and Geography.
Geography Analysis
Asia Pacific owns 43.2% of global revenue in 2024 and sustains the fastest 21.4% CAGR as sovereign AI programs in China, Japan, and India funnel subsidies into domestic clouds. China's East Data-West initiative alone channels CNY 400 billion annually toward eight megaclusters, redistributing computing inland and lowering coastal congestion. Japan approaches JPY 2 trillion (USD 13.4 billion) in data-center value by 2030, buoyed by AWS's USD 15 billion and Oracle's USD 8 billion pledges. India gains from NTT's USD 1.5 billion expansion and local tax incentives favoring digital infrastructure.
North America remains the second-largest base but sees relative growth slow as legacy hubs saturate. Energy limitations redirect projects to overlooked states: AWS earmarks USD 11 billion for Indiana, Compass breaks ground on a USD 10 billion Mississippi campus, and STACK commits over 1 GW in Northern Virginia. Canada's Digital Ambition program accelerates federal cloud adoption, propelled by Shared Services Canada's brokerage role.
Europe balances demand with carbon-neutral targets. Regulations such as DORA compel financial firms to diversify providers while national energy caps limit capacity in traditional locations like Dublin and Amsterdam. Alternative metros-Berlin, Warsaw, Oslo, Zurich, Milan, Vienna, and Marseille-rise thanks to renewable grids and supportive permitting regimes. The EU's aim for zero-carbon data centers by 2030 spurs investment in heat-reuse schemes and offshore wind tie-ins, shaping the next phase of the cloud infrastructure market.
- Amazon Web Services (AWS)
- Microsoft Azure
- Google Cloud Platform (GCP)
- Alibaba Cloud
- IBM Cloud
- Oracle Cloud Infrastructure (OCI)
- Tencent Cloud
- Huawei Cloud
- OVHcloud
- DigitalOcean
- Rackspace Technology
- Hetzner
- Equinix Metal
- Cloudflare Workers / R2
- Linode / Akamai
- Oracle Cloud (Japan)
- Liquid Sky (Africa)
- Wasabi Technologies
- Scaleway
- SAP Business Technology Platform (BTP-IaaS portion)
Additional Benefits:
- The market estimate (ME) sheet in Excel format
- 3 months of analyst support
TABLE OF CONTENTS
1 INTRODUCTION
- 1.1 Study Assumptions & Market Definition
- 1.2 Scope of the Study
2 RESEARCH METHODOLOGY
3 EXECUTIVE SUMMARY
4 MARKET LANDSCAPE
- 4.1 Market Overview
- 4.2 Market Drivers
- 4.2.1 Mainstream Accelerating Gen-AI infrastructure demand
- 4.2.2 Mainstream Enterprise hybrid & multi-cloud migration spike
- 4.2.3 Mainstream Hyperscaler CAPEX race (>$250 bn in 2025)
- 4.2.4 Mainstream Edge-to-core latency requirements in 5G era
- 4.2.5 Under-the-radar Long-duration green-energy PPAs unlocking new DC sites
- 4.2.6 Under-the-radar Government sovereign-AI sandboxes mandating local IaaS nodes
- 4.3 Market Restraints
- 4.3.1 Mainstream Escalating energy-grid constraints
- 4.3.2 Mainstream Data-sovereignty & extraterritoriality conflicts
- 4.3.3 Under-the-radar Liquid-cooling supply-chain bottlenecks
- 4.3.4 Under-the-radar Surging insurance premiums for >100 MW hyperscale campuses
- 4.4 Value/Supply-Chain Analysis
- 4.5 Regulatory Landscape
- 4.6 Technological Outlook (AI accelerators, liquid cooling, Zero-Trust fabrics)
- 4.7 Porter's Five Forces
- 4.7.1 Bargaining Power of Suppliers
- 4.7.2 Bargaining Power of Buyers
- 4.7.3 Threat of New Entrants
- 4.7.4 Threat of Substitutes
- 4.7.5 Intensity of Competitive Rivalry
5 MARKET SIZE AND GROWTH FORECASTS (VALUE)
- 5.1 By Deployment Mode
- 5.1.1 Public Cloud
- 5.1.2 Private Cloud
- 5.1.3 Hybrid Cloud
- 5.2 By Service Type
- 5.2.1 Compute as a Service (CaaS)
- 5.2.2 Storage as a Service (STaaS)
- 5.2.3 Networking & CDN
- 5.2.4 Database / Analytics as a Service (DBaaS)
- 5.2.5 Disaster-Recovery as a Service (DRaaS)
- 5.2.6 Managed Hosting / Dedicated Cloud
- 5.3 By End-user Industry
- 5.3.1 BFSI
- 5.3.2 IT & Telecom
- 5.3.3 Healthcare & Life Sciences
- 5.3.4 Media & Entertainment
- 5.3.5 Retail & e-Commerce
- 5.3.6 Government & Public Sector
- 5.3.7 Manufacturing & Automotive
- 5.4 By Geography
- 5.4.1 North America
- 5.4.1.1 United States
- 5.4.1.2 Canada
- 5.4.2 South America
- 5.4.2.1 Brazil
- 5.4.2.2 Argentina
- 5.4.3 Europe
- 5.4.3.1 United Kingdom
- 5.4.3.2 Germany
- 5.4.3.3 France
- 5.4.3.4 Russia
- 5.4.4 Asia-Pacific
- 5.4.4.1 China
- 5.4.4.2 Japan
- 5.4.4.3 India
- 5.4.4.4 South Korea
- 5.4.4.5 Australia
- 5.4.5 Middle East and Africa
- 5.4.5.1 Middle East
- 5.4.5.1.1 UAE
- 5.4.5.1.2 Saudi Arabia
- 5.4.5.1.3 Turkey
- 5.4.5.2 Africa
- 5.4.5.2.1 South Africa
- 5.4.5.2.2 Nigeria
- 5.4.1 North America
6 COMPETITIVE LANDSCAPE
- 6.1 Market Concentration
- 6.2 Strategic Moves
- 6.3 Market Share Analysis
- 6.4 Company Profiles (includes Global level Overview, Market level overview, Core Segments, Financials as available, Strategic Information, Market Rank/Share, Products & Services, Recent Developments)
- 6.4.1 Amazon Web Services (AWS)
- 6.4.2 Microsoft Azure
- 6.4.3 Google Cloud Platform (GCP)
- 6.4.4 Alibaba Cloud
- 6.4.5 IBM Cloud
- 6.4.6 Oracle Cloud Infrastructure (OCI)
- 6.4.7 Tencent Cloud
- 6.4.8 Huawei Cloud
- 6.4.9 OVHcloud
- 6.4.10 DigitalOcean
- 6.4.11 Rackspace Technology
- 6.4.12 Hetzner
- 6.4.13 Equinix Metal
- 6.4.14 Cloudflare Workers / R2
- 6.4.15 Linode / Akamai
- 6.4.16 Oracle Cloud (Japan)
- 6.4.17 Liquid Sky (Africa)
- 6.4.18 Wasabi Technologies
- 6.4.19 Scaleway
- 6.4.20 SAP Business Technology Platform (BTP-IaaS portion)
7 MARKET OPPORTUNITIES AND FUTURE OUTLOOK
- 7.1 White-space & Unmet-Need Assessment
 IaaS(基础设施即服务)市场:按服务模式、工作负载、定价模式、销售管道、部署类型、组织规模和产业划分-2026-2032年全球市场预测
 2026年全球硬体即服务市场报告2026年全球基础设施即服务(IaaS)市场报告
 全球硬体即服务市场规模、份额、趋势和成长分析报告(2026-2034年)2026年全球硬体人工智慧(AI)市场报告全球基础设施即服务(IaaS)市场:市场规模、占有率、成长率、行业分析、依类型、应用和地区划分的分析以及未来预测(2026-2034)
 基础设施即服务 (IaaS) 市场 - 全球产业规模、份额、趋势、机会及预测(按组件类型、部署模式、公司规模、垂直产业、地区和竞争格局划分,2021-2031 年)
 硬体即服务 (HaaS):市场占有率分析、产业趋势与统计、成长预测 (2026-2031)
 全球硬体即服务(HaaS)市场
 2025 年至 2033 年基础设施即服务市场报告(按部署类型、解决方案、最终用户、垂直行业和地区)