


 |
市场调查报告书
商品编码
1851793
Dark Analytics:市场占有率分析、产业趋势、统计数据和成长预测(2025-2030 年)Dark Analytics - Market Share Analysis, Industry Trends & Statistics, Growth Forecasts (2025 - 2030) |
||||||
※ 本网页内容可能与最新版本有所差异。详细情况请与我们联繫。
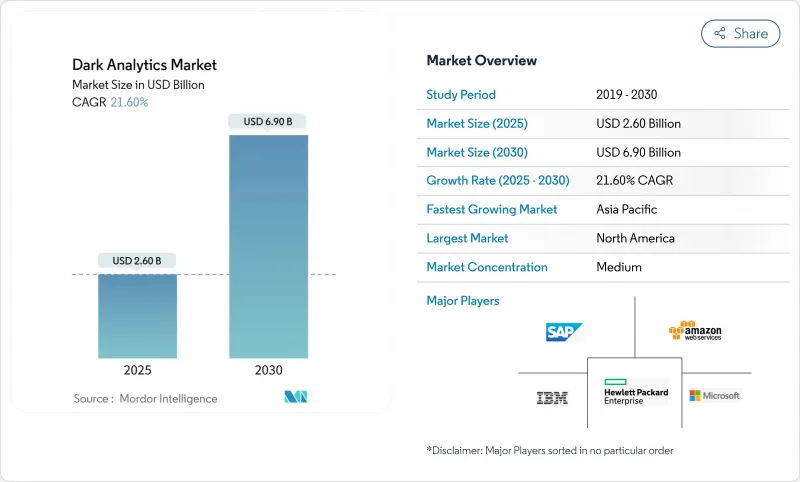
预计暗分析市场将在 2025 年达到 26 亿美元,在 2030 年达到 69 亿美元,年复合成长率为 21.6%。
这一成长反映出企业逐渐意识到,近 80% 的企业资料仍处于非结构化状态,因此传统分析系统无法取得这些资讯。人工智慧、机器学习和云端原生平台的结合,可以将这些隐藏的资料海转化为即时营运智慧。物联网 (IoT) 设备的快速普及、云端储存成本的下降以及日益严格的日誌保留法规,进一步加速了对暗资料处理的需求。竞争格局正在向那些整合大规模语言模型、向量搜寻和合成资料生成的服务提供者转变,这些技术的结合能够加快模型训练速度并增强隐私控制。
全球暗分析市场趋势与洞察
引入人工智慧/机器学习优先的安全分析
以安全为中心的架构正在重塑暗分析市场,91%的美国银行已采用人工智慧进行诈欺侦测,预计到2027年可减少400亿美元的损失。首席资讯安全安全长表示,对抗性人工智慧带来的高阶威胁使得自主响应至关重要,78%的首席资讯安全长承认这对其防御态势产生了重大影响。金融机构正透过部署OpenAI的MongoDB向量搜寻整合等方案来展现这一转变,该整合支援对结构化和非结构化交易流进行即时分析。虽然大型语言模型目前能够解读复杂的安全日誌,但影子人工智慧的兴起(72%的生成式人工智慧活动发生在正式监管之外)带来了新的风险,而这些风险只有透过复杂的监控才能应对。
物联网数据呈指数级增长
物联网设备正以 40% 的复合年增长率 (CAGR) 产生Zetta位元组)的非结构化数据,从根本上重塑储存和分析的经济格局。製造商正透过利用这些「暗数据」获得显着收益:捷豹路虎透过将图分析应用于即时感测器数据,将供应链查询时间从三週缩短至 45 分钟。到 2025 年,75% 的企业产生资料将在传统资料中心之外进行处理,这一趋势正在推动边缘运算的普及。边缘运算与轻量级人工智慧结合,能够在自主工业机械和互联医疗设备等关键任务环境中实现毫秒模式识别。
数据工程和资料科学技能差距
到2025年,58%的资料中心营运商将面临工程职位空缺,这将对暗分析市场构成瓶颈。现代计划需要涵盖分散式计算、领域知识和机器学习操作等多学科技能。亚太地区的快速数位化推高了稀缺专家的薪资,使中小企业处于不利地位。低程式码框架透过简化管道创建缓解了部分压力,但多模态推理等高阶用例仍然需要熟练的专业人员。许多公司选择託管平台来弥补这一缺口,但这可能会带来集中风险并限制客製化灵活性。
细分市场分析
预测性分析正以28.5%的复合年增长率快速成长,印证了决策方式正从事后分析转向自动化编配。预测方法能够提供机率预测以指导规划週期,预计到2024年,其在暗分析市场中的份额将达到43%,继续保持领先地位。如果目前的成长动能持续下去,到2030年,由预测引擎驱动的暗分析市场规模可望达到23亿美元。自然语言迭加技术使用户能够以对话形式提出「假设性」问题,模型则会给出排序后的建议。製造商正在积极拥抱这项变革,建立能够模拟整个供应链的数位孪生模型,使员工能够在不中断生产的情况下测试各种调整方案。
说明和诊断性技术仍然至关重要,因为它们能够揭示潜在模式和根本原因,从而实现更高层次的最佳化。即时连接器将营运技术资料与企业资源规划资料流融合,增强了说明仪錶板的功能,并拓宽了情境察觉。医疗保健领域的诊断分析结合了影像记录、实验室结果和临床医生评论,将不良后果追溯到特定的流程缺陷,从而为后续的指导性干预措施奠定基础。这些层面相互强化,确保了暗分析产业在策略前瞻和日常战术性执行方面都能发挥作用。
到2024年,云端运算仍将占据暗分析市场67%的份额,这得益于持续的服务升级和计量收费的灵活性。然而,随着企业将敏感工作负载迁移到更靠近源头的位置,预计到2030年,边缘运算和混合配置领域将额外占据14亿美元的暗分析市场份额。製造业、能源业和需要亚秒推理的自主系统对这类需求最为强劲。预计到2025年,边缘运算市场规模将达到615.4亿美元,为分析模型提供充足的处理余量。
企业通常会将公有云和本地私有资源混合部署,以平衡全球可扩展性和自主性。这种混合整合增加了架构的复杂性。资料同步、模型管治和零信任控制必须在各个节点间无缝运作。供应商现在将整合了嵌入式 GPU 和轻量级编配的承包边缘网关打包在一起,以降低整合开销。早期采用者报告称,电网异常检测速度更快,自动驾驶车辆的即时调整也更加及时,从而进一步提升了分散式处理的经济效益。
暗黑分析市场按分析类型(预测性、规范性及其他)、部署模式、资料来源(结构化、半结构化、非结构化)、最终用户产业(银行、金融服务和保险、医疗保健及其他)和地区进行细分。市场预测以美元计价。
区域分析
到2024年,北美将占据暗分析市场37%的份额,这主要得益于成熟的云端生态系、人工智慧的早期应用以及有利的政策环境。联邦机构正优先考虑安全的资料共用,并鼓励企业采用隐私增强型分析框架。对专用硬体的大量投资凸显了该地区的决心:Oracle已累计400亿美元用于购买英伟达加速器,以支持OpenAI位于德克萨斯的设施。加拿大致力于优化自然资源利用,而墨西哥则在汽车和电子製造业推广分析技术,以增强出口竞争力。
亚太地区以24.4%的复合年增长率引领成长,中国、印度和东南亚各国政府正大力投资建置下一代资料中心和人才储备。中国在巨量资料领域的支出占该地区的37.5%,并根据国家网路安全法规利用自主云端。印度的IT服务业正利用其成本优势和雄厚的工程技术人才储备,满足不断增长的需求,并向全球出口承包分析解决方案。日本和韩国则专注于工业自动化,利用边缘人工智慧实现高精度机器人和品质保证。由于跨境资料流动法规仍面临挑战,跨国公司正在实施在地化策略,例如建立国内边缘丛集。
儘管GDPR日益严格,人工智慧管治提案层出不穷,欧洲仍维持相当大的市场占有率。德国、法国和义大利拥有庞大的传统製造地,这些国家积极推行预测性维护以提高资产运转率,从而受益于暗分析市场的发展。 DORA法规提高了弹性标准,推动了对高级分析的需求,以评估资讯通信技术事件和供应链风险。英国,尤其是在金融服务领域,正在加速采用合成资料进行模型检验,而北欧国家则率先推行绿色资料中心实践,以减少与分析相关的碳排放。
拉丁美洲和中东及非洲是规模虽小但成长迅速的机会区,前者以行动优先的消费行为为特征,后者则以金融科技创新为特征。在这两个地区,超大规模资料中心的扩张正在降低运算成本,并扩大进阶分析工具的普及范围。通讯数据货币化和公共部门数位身分计画正在成为关键应用案例,预计在未来五年内推动该地区的普及率。
其他福利:
- Excel格式的市场预测(ME)表
- 3个月的分析师支持
目录
第一章 引言
- 调查先决条件
- 调查范围
第二章调查方法
第三章执行摘要
第四章 市场情势
- 市场概览
- 市场驱动因素
- 引入人工智慧/机器学习优先的安全分析
- 物联网数据的指数级成长
- 降低云端储存成本
- 零信任成为强制性要求,扩大了日誌储存的范围。
- 合成资料的成长揭示了暗资料的奥秘。
- 市场限制
- 数据工程和资料科学技能差距
- 合规成本不断上升(GDPR、CCPA、DORA)
- 提高静态资料的碳足迹课税
- 价值/供应链分析
- 监管环境
- 技术展望
- 波特五力分析
- 买方的议价能力
- 供应商的议价能力
- 新进入者的威胁
- 替代品的威胁
- 竞争对手之间的竞争
第五章 市场规模与成长预测
- 按分析类型
- 预言
- 规范
- 诊断
- 说明的
- 按部署模式
- 本地部署
- 云
- 边缘/混合
- 依资料来源
- 结构
- 半结构化
- 非结构化
- 按最终用户行业划分
- BFSI
- 卫生保健
- 政府机构
- 通讯业务
- 零售与电子商务
- 製造业
- 其他(能源、媒体等)
- 按地区
- 北美洲
- 美国
- 加拿大
- 墨西哥
- 南美洲
- 巴西
- 阿根廷
- 其他南美洲国家
- 欧洲
- 英国
- 德国
- 法国
- 义大利
- 其他欧洲地区
- 亚太地区
- 中国
- 日本
- 印度
- 韩国
- 亚太其他地区
- 中东
- 以色列
- 沙乌地阿拉伯
- 阿拉伯聯合大公国
- 土耳其
- 其他中东地区
- 非洲
- 南非
- 埃及
- 其他非洲地区
- 北美洲
第六章 竞争情势
- 市场集中度
- 策略趋势
- 市占率分析
- 公司简介
- IBM Corporation
- Microsoft Corporation
- Amazon Web Services Inc.
- SAP SE
- Palantir Technologies
- Oracle Corporation
- Hewlett Packard Enterprise
- SAS Institute
- Teradata Corporation
- Micro Focus International
- Splunk Inc.
- Elastic NV
- Darktrace Plc.
- Rapid7 Inc.
- Securonix Inc.
- Databricks Inc.
- Snowflake Inc.
- Google Cloud Platform
- Cloudera Inc.
- Exasol AG
第七章 市场机会与未来展望
The dark analytics market is valued at USD 2.6 billion in 2025 and is forecast to reach USD 6.9 billion by 2030, advancing at a 21.6% CAGR.
This growth mirrors enterprises' realization that nearly 80% of corporate information is still unstructured and therefore invisible to conventional analytics systems. Artificial intelligence, machine learning, and cloud-native platforms now combine to turn these dormant data troves into real-time operational intelligence. Rapid proliferation of Internet-of-Things (IoT) devices, lower cloud-storage costs, and expanding regulatory mandates that require extensive log retention are further accelerating demand for dark-data processing. Competitive momentum is shifting toward providers that embed large language models, vector search, and synthetic-data generation, which together enable faster model training and stronger privacy controls.
Global Dark Analytics Market Trends and Insights
AI/ML-First Security Analytics Adoption
Security-centric architectures are redefining the dark analytics market as 91% of United States banks now use AI to detect fraud, a practice that could save USD 40 billion in losses by 2027. Chief information-security officers report that advanced threats driven by adversarial AI have made autonomous response indispensable, with 78% acknowledging material impacts on their defensive posture. Financial institutions illustrate the shift through deployments such as MongoDB's vector-search integration with OpenAI, which supports real-time analysis across structured and unstructured transaction streams. Large language models now interpret intricate security logs, but the rise of shadow AI-72% of generative-AI activity occurs outside official oversight-creates novel exposure risks that only sophisticated monitoring can address.
Exponential IoT Data Growth
IoT devices are creating zettabyte-scale unstructured data at a 40% CAGR, fundamentally reshaping storage and analytics economics. Manufacturers achieve sizable gains when they harness this dark data: Jaguar Land Rover cut supply-chain query times from three weeks to 45 minutes by applying graph analytics to real-time sensor feeds. By 2025, 75% of enterprise-generated data will be processed outside traditional data centers, a trend that is driving edge adoption. Pairing edge compute with lightweight AI allows millisecond-level pattern recognition in mission-critical settings, including automated industrial machinery and connected healthcare equipment.
Skills Gap in Data Engineering & Data Science
Fifty-eight percent of data-center operators struggled to fill engineering roles during 2025, creating a bottleneck in dark analytics market deployment. Modern projects demand multidisciplinary skills that span distributed computing, domain knowledge, and machine-learning operations. Asia-Pacific's rapid digitization inflates wages for scarce professionals, putting smaller enterprises at a disadvantage. Low-code frameworks alleviate some pressure by simplifying pipeline creation, yet advanced use cases such as multimodal inference still require seasoned talent. Many firms opt for managed platforms to bridge the gap, although this introduces concentration risk and can constrain customization flexibility.
Other drivers and restraints analyzed in the detailed report include:
- Falling Cloud-Storage Costs
- Zero-Trust Mandates Expanding Log Retention Windows
- Escalating Compliance Cost (GDPR, CCPA, DORA)
For complete list of drivers and restraints, kindly check the Table Of Contents.
Segment Analysis
Prescriptive analytics is scaling at a 28.5% CAGR, underscoring a move from hindsight toward automated decision orchestration. Predictive methods retained the largest 43% slice of dark analytics market share in 2024 by providing probabilistic forecasts that feed planning cycles. The dark analytics market size attributable to prescriptive engines could swell to USD 2.3 billion by 2030 if current adoption momentum continues. Natural-language overlays now let business users pose conversational "what-if" questions, which models answer with ranked recommendations. Manufacturers have embraced this evolution, building digital twins that simulate entire supply networks so staff can test adjustments without interrupting production.
Descriptive and diagnostic techniques retain relevance because they uncover baseline patterns and root causes that feed higher-order optimization. Descriptive dashboards are improving through real-time connectors that fuse operational technology data with enterprise resource planning streams, broadening situational awareness. Diagnostic analytics in healthcare combines imaging notes, lab results, and clinician commentary to trace adverse outcomes back to specific process lapses, forming the foundation for later prescriptive interventions. Collectively, these layers reinforce each other, ensuring the dark analytics industry can serve both strategic foresight and daily tactical execution.
Cloud maintained a commanding 67% of dark analytics market share in 2024, benefiting from continuous service upgrades and pay-as-you-go elasticity. Even so, the segment representing edge and hybrid configurations is forecast to capture an extra USD 1.4 billion of dark analytics market size by 2030 as companies shift sensitive workloads closer to origin points. Demand is strongest in manufacturing, energy, and autonomous systems that require sub-second inference. The edge computing sector itself is expected to reach USD 61.54 billion in 2025, providing abundant processing headroom for analytics models.
Enterprises frequently blend public clouds with private on-premises resources, balancing sovereignty mandates against global scalability. This hybrid coordination raises architectural complexity: data synchronization, model governance, and zero-trust controls must function seamlessly across nodes. Providers now package turnkey edge gateways with embedded GPUs and lightweight orchestration to reduce integration overhead. Early adopters report faster anomaly detection in power grids and real-time adjustments of autonomous-guided vehicles, results that reinforce the economic case for distributed processing.
Dark Analytics Market Segmented by Analytics Type (Predictive, Prescriptive and More), Deployment Model, Data Source (Structured, Semi-Structured and Unstructured), End-User Vertical (BFSI, Healthcare and More) and by Geography. The Market Forecasts are Provided in Terms of Value (USD).
Geography Analysis
North America captured 37% of dark analytics market size in 2024 owing to its mature cloud ecosystem, early AI uptake, and supportive policy environment. Federal agencies emphasize secure data-sharing, encouraging enterprises to adopt privacy-enhanced analytics frameworks. Heavy investments in specialized hardware underline the region's commitment: Oracle alone earmarked USD 40 billion for Nvidia accelerators to back OpenAI's Texas facility, a move expected to reinforce regional leadership in AI compute. Canada focuses on natural-resources optimization, while Mexico pushes analytics in automotive and electronics manufacturing to bolster export competitiveness.
Asia-Pacific is advancing at a 24.4% CAGR as governments throughout China, India, and Southeast Asia finance next-generation data centers and talent pipelines. China accounts for 37.5% of regional big-data spending, leveraging sovereign clouds that align with national cybersecurity regulations. India's IT-services sector exports turnkey analytics solutions worldwide, using cost advantages and deep engineering pools to capture incremental demand. Japan and South Korea concentrate on industrial automation, exploiting edge AI for high-precision robotics and quality assurance. Cross-border data-flow rules remain a challenge, prompting multinationals to deploy localization strategies such as in-country edge clusters.
Europe maintains meaningful share despite stringent GDPR and proliferating AI-governance proposals. The dark analytics market benefits from legacy manufacturing bases across Germany, France, and Italy that seek predictive maintenance to lift asset uptime. DORA regulations are raising resilience standards, thereby increasing demand for advanced analytics that evaluates ICT incidents and supply-chain exposures. The United Kingdom, through its financial-services focus, accelerates adoption of synthetic data for model validation, while Nordic nations pioneer green-data-center practices to reduce analytics-related carbon footprints.
Collectively, Latin America and the Middle East & Africa represent smaller but fast-growing opportunity pools, each characterized by mobile-first consumer behaviour and fintech innovation. Both regions benefit from hyperscale expansions that lower compute costs and broaden access to sophisticated analytics tools. Telecommunications data monetization and public-sector digital identity programs are emerging as primary use cases that could elevate regional penetration in the latter half of the decade.
- IBM Corporation
- Microsoft Corporation
- Amazon Web Services Inc.
- SAP SE
- Palantir Technologies
- Oracle Corporation
- Hewlett Packard Enterprise
- SAS Institute
- Teradata Corporation
- Micro Focus International
- Splunk Inc.
- Elastic N.V.
- Darktrace Plc.
- Rapid7 Inc.
- Securonix Inc.
- Databricks Inc.
- Snowflake Inc.
- Google Cloud Platform
- Cloudera Inc.
- Exasol AG
Additional Benefits:
- The market estimate (ME) sheet in Excel format
- 3 months of analyst support
TABLE OF CONTENTS
1 INTRODUCTION
- 1.1 Study Assumptions
- 1.2 Scope of the Study
2 RESEARCH METHODOLOGY
3 EXECUTIVE SUMMARY
4 MARKET LANDSCAPE
- 4.1 Market Overview
- 4.2 Market Drivers
- 4.2.1 AI/ML-first security analytics adoption
- 4.2.2 Exponential IoT data growth
- 4.2.3 Falling cloud-storage costs
- 4.2.4 Zero-trust mandates expanding log retention windows
- 4.2.5 Growth of synthetic data to unlock dark data
- 4.3 Market Restraints
- 4.3.1 Skills gap in data engineering and data-science
- 4.3.2 Escalating compliance cost (GDPR, CCPA, DORA)
- 4.3.3 Rising carbon-footprint taxes on data at rest
- 4.4 Value / Supply-Chain Analysis
- 4.5 Regulatory Landscape
- 4.6 Technological Outlook
- 4.7 Porter's Five Forces Analysis
- 4.7.1 Bargaining Power of Buyers
- 4.7.2 Bargaining Power of Suppliers
- 4.7.3 Threat of New Entrants
- 4.7.4 Threat of Substitutes
- 4.7.5 Intensity of Competitive Rivalry
5 MARKET SIZE AND GROWTH FORECASTS (VALUE)
- 5.1 By Analytics Type
- 5.1.1 Predictive
- 5.1.2 Prescriptive
- 5.1.3 Diagnostic
- 5.1.4 Descriptive
- 5.2 By Deployment Model
- 5.2.1 On-premise
- 5.2.2 Cloud
- 5.2.3 Edge / Hybrid
- 5.3 By Data Source
- 5.3.1 Structured
- 5.3.2 Semi-Structured
- 5.3.3 Unstructured
- 5.4 By End-user Vertical
- 5.4.1 BFSI
- 5.4.2 Healthcare
- 5.4.3 Government
- 5.4.4 Telecommunications
- 5.4.5 Retail and E-commerce
- 5.4.6 Manufacturing
- 5.4.7 Others (Energy, Media, etc.)
- 5.5 By Geography
- 5.5.1 North America
- 5.5.1.1 United States
- 5.5.1.2 Canada
- 5.5.1.3 Mexico
- 5.5.2 South America
- 5.5.2.1 Brazil
- 5.5.2.2 Argentina
- 5.5.2.3 Rest of South America
- 5.5.3 Europe
- 5.5.3.1 United Kingdom
- 5.5.3.2 Germany
- 5.5.3.3 France
- 5.5.3.4 Italy
- 5.5.3.5 Rest of Europe
- 5.5.4 Asia-Pacific
- 5.5.4.1 China
- 5.5.4.2 Japan
- 5.5.4.3 India
- 5.5.4.4 South Korea
- 5.5.4.5 Rest of Asia-Pacific
- 5.5.5 Middle East
- 5.5.5.1 Israel
- 5.5.5.2 Saudi Arabia
- 5.5.5.3 United Arab Emirates
- 5.5.5.4 Turkey
- 5.5.5.5 Rest of Middle East
- 5.5.6 Africa
- 5.5.6.1 South Africa
- 5.5.6.2 Egypt
- 5.5.6.3 Rest of Africa
- 5.5.1 North America
6 COMPETITIVE LANDSCAPE
- 6.1 Market Concentration
- 6.2 Strategic Moves
- 6.3 Market Share Analysis
- 6.4 Company Profiles {(includes Global level Overview, Market level overview, Core Segments, Financials as available, Strategic Information, Market Rank/Share for key companies, Products and Services, and Recent Developments)}
- 6.4.1 IBM Corporation
- 6.4.2 Microsoft Corporation
- 6.4.3 Amazon Web Services Inc.
- 6.4.4 SAP SE
- 6.4.5 Palantir Technologies
- 6.4.6 Oracle Corporation
- 6.4.7 Hewlett Packard Enterprise
- 6.4.8 SAS Institute
- 6.4.9 Teradata Corporation
- 6.4.10 Micro Focus International
- 6.4.11 Splunk Inc.
- 6.4.12 Elastic N.V.
- 6.4.13 Darktrace Plc.
- 6.4.14 Rapid7 Inc.
- 6.4.15 Securonix Inc.
- 6.4.16 Databricks Inc.
- 6.4.17 Snowflake Inc.
- 6.4.18 Google Cloud Platform
- 6.4.19 Cloudera Inc.
- 6.4.20 Exasol AG
7 MARKET OPPORTUNITIES AND FUTURE OUTLOOK
- 7.1 White-space and Unmet-need Assessment


