


 |
市场调查报告书
商品编码
1851795
供应商管理软体:市场占有率分析、产业趋势、统计数据和成长预测(2025-2030 年)Vendor Management Software - Market Share Analysis, Industry Trends & Statistics, Growth Forecasts (2025 - 2030) |
||||||
※ 本网页内容可能与最新版本有所差异。详细情况请与我们联繫。
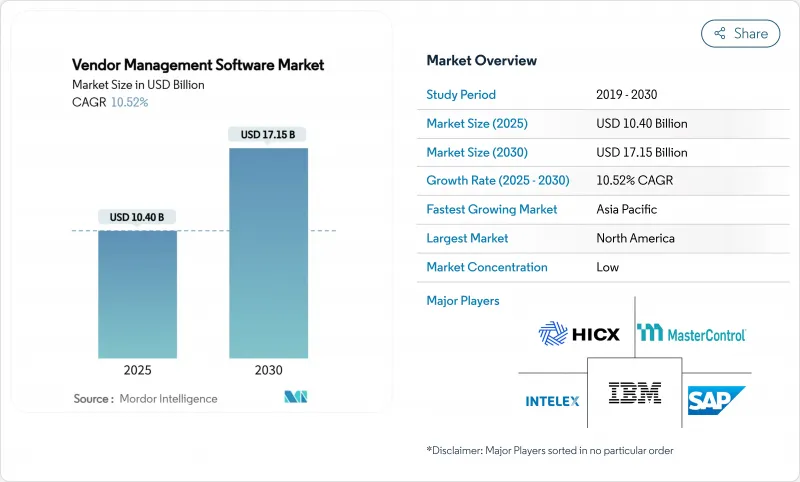
预计到 2025 年,供应商管理软体市场规模将达到 104 亿美元,年复合成长率为 10.52%,到 2030 年将达到 171.5 亿美元。
强劲的发展势头反映出,随着供应链复杂性、材料成本上涨和监管审查的加剧,企业渴望实现供应商关係的数位化。云端原生部署、人工智慧主导的分析和内建合规性监控如今已成为新采购的基准,整合式采购到付款套件正逐步取代各种独立工具。由于人工监控无法扩展到数百家第三方供应商,因此能够简化供应商入驻流程、集中管理供应商资料并展现预测性洞察的平台供应商更具优势。目前市场竞争格局较为均衡,现有ERP供应商、业界领先的专业供应商和人工智慧原生解决方案参与企业共用其中。
全球供应商管理软体市场趋势与洞察
需要尽可能降低管理成本
供应商重复性任务的自动化降低了采购成本,使团队能够专注于策略采购。 Wefunder 透过 CloudEagle 的平台实现合约续约自动化后,每年节省了 1350 小时,终身成本降低了 416,000 美元。 BetterCloud 保证 3 倍的投资报酬率。随着通货膨胀挤压净利率,外带成本的诱因正在加速各行业的采用。
云端运算的快速普及
云端原生平台缩短了引进週期,降低了资本支出,并提供了基于交易费用的弹性扩展能力。 Choice Hotels International 在运作Finout 的 SaaS 环境后,立即实现了 98.8% 的成本分配准确率。即时协作、基于 API 的 ERP 连接以及自动化安全补丁,使得云端成为首选,尤其是在 IT 人才短缺的地区。
安装和维护成本高昂
Conexis VMS 指出,整合、客製化和资料迁移可能会使初始预算翻倍,因此小型企业需要分阶段推广。
细分市场分析
预计到2024年,云端采用将占供应商管理软体市场的63.2%,并在2030年之前以12.9%的复合年增长率成长。云端采用之所以得到广泛认可,是因为其前期成本更低、价值实现速度更快,并且能够推送即时更新以保持安全控制的有效性。 Finout在Choice Hotels的成功案例表明,企业期望能够快速获得回报。相较之下,目前本地部署模式主要吸引那些对资料敏感且受主权机构监管的组织。整合的工作负载和人工智慧运算需求使得成本效益比向云端倾斜。混合部署方案也存在,它利用SaaS协作和分析层,同时将关键资料保留在本地。订阅定价模式会根据交易处理能力进行扩展,这进一步强化了市场动态。
第二代SaaS套件还整合了人工智慧引擎,用于预测供应商风险、推荐成本节约方案并自动收集合规性证据。这些功能依赖云端的弹性,允许使用者配置自订实例。升级流程也实现了自动化,使IT团队能够专注于策略资料管理,而不是日常的修补程式维护。因此,云端在不断发展的供应商管理软体市场中继续发挥关键作用。
到2024年,製造业将占总营收的37.3%,反映出多层级供应链对品质、交货时间和ESG指标的精细化可视性要求。江森自控部署的LeanDNA展示了工厂网路如何从同步的零件、供应商和库存资料中获益。原材料成本上涨和地缘政治事件正迫使生产者实现采购多元化。零售业虽然规模较小,但其复合年增长率将达到11.2%,成为成长最快的行业,这主要得益于全通路的成长、自有品牌的扩张以及产品组合与消费者需求的匹配需求。
随着监管机构对金融科技合作的审查日益严格,金融服务业采用金融科技的速度正在加快。根据Ncontracts的数据显示,73%的金融机构管理超过300家供应商,但其供应商风险部门的员工人数却只有两人或更少。医疗服务提供者将HIPAA合规监管放在首位。 Med-Equip在美国实施的Vanta系统使审核准备减少了50%。各国政府正逐步推动采购现代化,透过BidNet Direct等解决方案提高透明度并促进供应商多元化。
供应商管理软体市场按部署方式(云端、本地部署)、最终用户行业(零售、银行、金融服务和保险、製造业及其他)、组织规模(大型企业、中小企业)、组件/模组(供应商入驻和资讯管理、供应商风险和合规管理及其他)以及地区进行细分。市场预测以美元(USD)计价。
区域分析
北美地区预计到2024年将保持27.9%的市场份额,这主要得益于数位化采购的早期成熟、强大的云端基础设施以及日益严格的银行和医疗保健监管,这些监管措施将供应商风险工作流程製度化。特别是金融服务业,正在采用各种平台来应对美国货币监理署(OCC)和消费者金融保护局(CFPB)的指导意见。本土SaaS供应商的持续创新维持了产品更新换代的週期,进一步巩固了该地区的领先地位。
亚太地区预计将成为全球成长引擎,预计到2030年将以13.2%的复合年增长率成长。政府支持的数位化项目、製造业出口的激增以及网路安全事件的增加,正促使企业专注于第三方监控。超过70%的新加坡企业报告其供应链中存在网路安全漏洞,其中90%的企业增加了风险管理预算。占印度出口总额48%的中小企业依赖现代化的供应商入口网站来维持在全球竞争中的领先地位。中国在打击强迫劳动方面的合规性正在推动对用于追踪二级供应商的筛检工具的需求。
在环境、社会及公司治理 (ESG) 和尽职调查要求(包括自动化资讯揭露)的推动下,欧洲市场持续稳定成长。各公司正在部署平台,以追踪其供应链中的范围 3排放和道德采购认证。中东和非洲以及南美洲在绝对增长上落后于欧洲,但随着云端连接性的改善和公共部门现代化资金的涌入,这些地区的采用率正在提高。整体而言,各全部区域的供应商管理软体市场与电子采购的成熟度和监管要求密切相关,这为未来的应用指明了清晰的蓝图。
其他福利:
- Excel格式的市场预测(ME)表
- 3个月的分析师支持
目录
第一章 引言
- 研究假设和市场定义
- 调查范围
第二章调查方法
第三章执行摘要
第四章 市场情势
- 市场概览
- 市场驱动因素
- 降低管理成本
- 云端采用率快速成长
- 强调第三方风险和合规性的法规
- 全球化、多层级供应链的复杂性
- 人工智慧驱动的供应商风险预测评分
- 强制性ESG和范围3透明度
- 市场限制
- 安装和维护成本高昂
- 资料安全和隐私问题
- 与传统ERP套件整合的复杂性
- 供应商风险人才短缺
- 供应链分析
- 监管环境
- 技术展望
- 波特五力模型
- 供应商的议价能力
- 买方的议价能力
- 新进入者的威胁
- 替代品的威胁
- 竞争对手之间的竞争
- 评估市场的宏观经济因素
第五章 市场规模与成长预测
- 透过部署
- 云
- 本地部署
- 按最终用户行业划分
- 零售
- BFSI
- 製造业
- 资讯科技/通讯
- 卫生保健
- 政府/公共部门
- 其他行业
- 按组织规模
- 大公司
- 中小企业
- 按组件/模组
- 供应商入驻及资讯管理
- 供应商风险与合规管理
- 合约与绩效管理
- 发票和付款管理
- 分析与报告
- 其他模组
- 按地区
- 北美洲
- 美国
- 加拿大
- 墨西哥
- 南美洲
- 巴西
- 阿根廷
- 其他南美洲
- 欧洲
- 德国
- 英国
- 法国
- 义大利
- 西班牙
- 其他欧洲地区
- 亚太地区
- 中国
- 日本
- 印度
- 韩国
- 澳洲
- 东南亚
- 亚太其他地区
- 中东和非洲
- 中东
- 沙乌地阿拉伯
- 阿拉伯聯合大公国
- 土耳其
- 其他中东地区
- 非洲
- 南非
- 奈及利亚
- 埃及
- 其他非洲地区
- 北美洲
第六章 竞争情势
- 市场集中度
- 策略趋势
- 市占率分析
- 公司简介
- IBM Corporation
- SAP SE
- Coupa Software Inc.
- MasterControl, Inc.
- Intelex Technologies Inc.
- HICX Solutions
- Gatekeeper
- MetricStream Inc.
- Ncontracts LLC
- LogicManager Inc.
- SalesWarp
- Quantivate LLC
- Ivalua
- Jaggaer
- GEP Worldwide
- Oracle Corporation
- Workday Inc.
- Beeline
- Precoro
- Zycus
第七章 市场机会与未来展望
The vendor management software market size reached USD 10.40 billion in 2025 and is forecast to post a 10.52% CAGR, lifting value to USD 17.15 billion by 2030.
Strong momentum reflects enterprises' need to digitize supplier relationships as supply-chain complexity, material-cost inflation, and regulatory scrutiny converge. Cloud-native deployment, AI-driven analytics, and embedded compliance monitoring now set the baseline for new purchases, while integrated source-to-pay suites are steadily replacing point tools. Platform vendors that streamline onboarding, centralize supplier data, and surface predictive insights win preference because manual oversight cannot scale across hundreds of third parties. Competitive conditions remain moderate; established ERP providers, best-of-breed specialists, and AI-native entrants share the field, creating ample scope for niche differentiation without any single firm dominating.
Global Vendor Management Software Market Trends and Insights
Need to Minimize Administrative Costs
Automating repetitive supplier tasks reduces procurement overhead and frees teams for strategic sourcing. Wefunder saved 1,350 hours annually and USD 416,000 in lifetime costs after automating contract renewals through CloudEagle's platform. Similar deployments typically cut processing expenses by 20-30% within year one, a result BetterCloud formalizes through its 3x ROI guarantee. As inflation narrows margins, the cost-take-out motive accelerates adoption across industries.
Rapid Adoption of Cloud Deployment
Cloud-native platforms shorten implementation cycles, lower capital outlay, and offer elastic scalability that aligns fees with transaction volume. Choice Hotels International achieved 98.8% accurate cost allocation soon after going live on Finout's SaaS environment. Real-time collaboration, API-based ERP connectivity, and automatic security patching turn cloud into the default option, especially where IT talent is scarce.
High Implementation and Maintenance Costs
Conexis VMS notes that integration, customization, and data migration can double initial budgets, pushing small firms toward phased rollouts.Annual operational spend covers software development, support, and cybersecurity, yet return on investment typically arrives within 18 months as automated workflows unlock savings.
Other drivers and restraints analyzed in the detailed report include:
- Regulatory Emphasis on Third-Party Risk Compliance
- Globalized, Multi-Tier Supply-Chain Complexity
- Integration Complexity with Legacy ERP Suites
For complete list of drivers and restraints, kindly check the Table Of Contents.
Segment Analysis
Cloud deployment captured 63.2% of the vendor management software market in 2024 and is forecast to expand at a 12.9% CAGR to 2030. Broad acceptance follows lower upfront spend, faster time-to-value, and the ability to push real-time updates that keep security controls current. Finout's success at Choice Hotels illustrates the quick wins enterprises expect. In contrast, on-premises models now appeal mainly to organizations with sensitive sovereignty mandates. Integration workloads and AI compute requirements tip the cost-benefit equation further toward cloud. Hybrid paths persist, letting firms retain critical data in-house while exploiting SaaS collaboration and analytics layers. The vendor management software market continues to shift budgets accordingly, a dynamic reinforced by subscription pricing that scales with transaction throughput.
Second-generation SaaS suites also bundle AI engines that predict supplier risk, recommend cost savings, and automate compliance evidence gathering. These capabilities rely on cloud elasticity, encouraging users to sunset bespoke instances. As upgrades arrive automatically, IT teams redirect effort toward strategic data stewardship instead of routine patching. Consequently, cloud remains the anchor as the vendor management software market advances.
Manufacturing held 37.3% of 2024 revenues, reflecting multi-tier supply chains that demand granular visibility into quality, delivery, and ESG metrics. LeanDNA's rollout at Johnson Controls shows how plant networks benefit from synchronized part, supplier, and inventory data. Inflationary raw-material swings and geopolitical events push producers to diversify sourcing, raising onboarding volumes and reinforcing platform necessity. Retail, while smaller, posts the fastest 11.2% CAGR on the back of omnichannel growth, private-label expansion, and the need to align assortments with consumer demand.
Financial-services uptake accelerates as regulators scrutinize fintech collaborations. Ncontracts found 73% of institutions staffing vendor risk functions with two or fewer employees even while managing 300+ vendors. Healthcare providers prioritize HIPAA-aligned oversight; Vanta's deployment at US Med-Equip reduced audit prep by 50%. Governments gradually modernize procurement to heighten transparency and supplier diversity, aided by solutions such as BidNet Direct.
Vendor Management Software Market is Segmented by Deployment (Cloud, On-Premises), End-User Industry (Retail, BFSI, Manufacturing, and More), Organization Size (Large Enterprises, Smes), Component / Module (Vendor Onboarding and Information Management, Vendor Risk and Compliance Management, and More), and by Geography. The Market Forecasts are Provided in Terms of Value (USD).
Geography Analysis
North America retained 27.9% share in 2024 owing to early digital procurement maturity, deep cloud infrastructure, and stringent banking and healthcare regulations that institutionalize vendor-risk workflows. Financial services, in particular, adopt platforms to navigate OCC and CFPB guidance. Continuous innovation from domestic SaaS vendors sustains refresh cycles, further anchoring the region's lead.
Asia-Pacific rises as the growth engine with a 13.2% CAGR through 2030. Government-backed digitization programs, burgeoning manufacturing exports, and increasing cyber incidents push organisations to professionalize third-party oversight. Singaporean firms reported over 70% supply-chain cyber breaches, spurring 90% of them to raise risk-management budgets. India's MSMEs contribute 48% of national exports and rely on modern vendor portals to compete globally. China's forced-labor compliance drives demand for screening tools that trace sub-tier suppliers.
Europe maintains steady growth as ESG and due-diligence directives necessitate automated disclosures. Firms deploy platforms to capture Scope-3 emissions and ethical-sourcing attestations across supply chains. Middle East and Africa along with South America trail in absolute value but display rising adoption as cloud connectivity improves and public-sector modernization funds flow. Across regions, the vendor management software market demonstrates strong correlation to e-procurement maturity and regulatory mandates, setting a clear roadmap for future penetration.
- IBM Corporation
- SAP SE
- Coupa Software Inc.
- MasterControl, Inc.
- Intelex Technologies Inc.
- HICX Solutions
- Gatekeeper
- MetricStream Inc.
- Ncontracts LLC
- LogicManager Inc.
- SalesWarp
- Quantivate LLC
- Ivalua
- Jaggaer
- GEP Worldwide
- Oracle Corporation
- Workday Inc.
- Beeline
- Precoro
- Zycus
Additional Benefits:
- The market estimate (ME) sheet in Excel format
- 3 months of analyst support
TABLE OF CONTENTS
1 INTRODUCTION
- 1.1 Study Assumptions and Market Definition
- 1.2 Scope of the Study
2 RESEARCH METHODOLOGY
3 EXECUTIVE SUMMARY
4 MARKET LANDSCAPE
- 4.1 Market Overview
- 4.2 Market Drivers
- 4.2.1 Need to minimize administrative costs
- 4.2.2 Rapid adoption of cloud deployment
- 4.2.3 Regulatory emphasis on third-party risk compliance
- 4.2.4 Globalized, multi-tier supply chains complexity
- 4.2.5 AI-driven predictive vendor risk scoring
- 4.2.6 ESG and Scope-3 transparency mandates
- 4.3 Market Restraints
- 4.3.1 High implementation and maintenance costs
- 4.3.2 Data-security and privacy concerns
- 4.3.3 Integration complexity with legacy ERP suites
- 4.3.4 Shortage of vendor-risk talent
- 4.4 Supply-Chain Analysis
- 4.5 Regulatory Landscape
- 4.6 Technological Outlook
- 4.7 Porter's Five Forces
- 4.7.1 Bargaining Power of Suppliers
- 4.7.2 Bargaining Power of Buyers
- 4.7.3 Threat of New Entrants
- 4.7.4 Threat of Substitutes
- 4.7.5 Intensity of Competitive Rivalry
- 4.8 Assesment of Macroeconomic Factors on the market
5 MARKET SIZE AND GROWTH FORECASTS (VALUE)
- 5.1 By Deployment
- 5.1.1 Cloud
- 5.1.2 On-premise
- 5.2 By End-user Industry
- 5.2.1 Retail
- 5.2.2 BFSI
- 5.2.3 Manufacturing
- 5.2.4 IT and Telecommunications
- 5.2.5 Healthcare
- 5.2.6 Government and Public Sector
- 5.2.7 Other Industries
- 5.3 By Organization Size
- 5.3.1 Large Enterprises
- 5.3.2 Small and Medium Enterprises (SMEs)
- 5.4 By Component / Module
- 5.4.1 Vendor Onboarding and Information Management
- 5.4.2 Vendor Risk and Compliance Management
- 5.4.3 Contract and Performance Management
- 5.4.4 Invoice and Payment Management
- 5.4.5 Analytics and Reporting
- 5.4.6 Other Modules
- 5.5 By Geography
- 5.5.1 North America
- 5.5.1.1 United States
- 5.5.1.2 Canada
- 5.5.1.3 Mexico
- 5.5.2 South America
- 5.5.2.1 Brazil
- 5.5.2.2 Argentina
- 5.5.2.3 Rest of South America
- 5.5.3 Europe
- 5.5.3.1 Germany
- 5.5.3.2 United Kingdom
- 5.5.3.3 France
- 5.5.3.4 Italy
- 5.5.3.5 Spain
- 5.5.3.6 Rest of Europe
- 5.5.4 Asia-Pacific
- 5.5.4.1 China
- 5.5.4.2 Japan
- 5.5.4.3 India
- 5.5.4.4 South Korea
- 5.5.4.5 Australia
- 5.5.4.6 Southeast Asia
- 5.5.4.7 Rest of Asia-Pacific
- 5.5.5 Middle East and Africa
- 5.5.5.1 Middle East
- 5.5.5.1.1 Saudi Arabia
- 5.5.5.1.2 United Arab Emirates
- 5.5.5.1.3 Turkey
- 5.5.5.1.4 Rest of Middle East
- 5.5.5.2 Africa
- 5.5.5.2.1 South Africa
- 5.5.5.2.2 Nigeria
- 5.5.5.2.3 Egypt
- 5.5.5.2.4 Rest of Africa
- 5.5.1 North America
6 COMPETITIVE LANDSCAPE
- 6.1 Market Concentration
- 6.2 Strategic Moves
- 6.3 Market Share Analysis
- 6.4 Company Profiles (includes Global level Overview, Market level overview, Core Segments, Financials as available, Strategic Information, Market Rank/Share for key companies, Products and Services, and Recent Developments)
- 6.4.1 IBM Corporation
- 6.4.2 SAP SE
- 6.4.3 Coupa Software Inc.
- 6.4.4 MasterControl, Inc.
- 6.4.5 Intelex Technologies Inc.
- 6.4.6 HICX Solutions
- 6.4.7 Gatekeeper
- 6.4.8 MetricStream Inc.
- 6.4.9 Ncontracts LLC
- 6.4.10 LogicManager Inc.
- 6.4.11 SalesWarp
- 6.4.12 Quantivate LLC
- 6.4.13 Ivalua
- 6.4.14 Jaggaer
- 6.4.15 GEP Worldwide
- 6.4.16 Oracle Corporation
- 6.4.17 Workday Inc.
- 6.4.18 Beeline
- 6.4.19 Precoro
- 6.4.20 Zycus
7 MARKET OPPORTUNITIES AND FUTURE OUTLOOK
- 7.1 White-space and Unmet-Need Assessment


