


 |
市场调查报告书
商品编码
1851799
无伺服器运算:市场占有率分析、产业趋势、统计数据和成长预测(2025-2030 年)Serverless Computing - Market Share Analysis, Industry Trends & Statistics, Growth Forecasts (2025 - 2030) |
||||||
※ 本网页内容可能与最新版本有所差异。详细情况请与我们联繫。
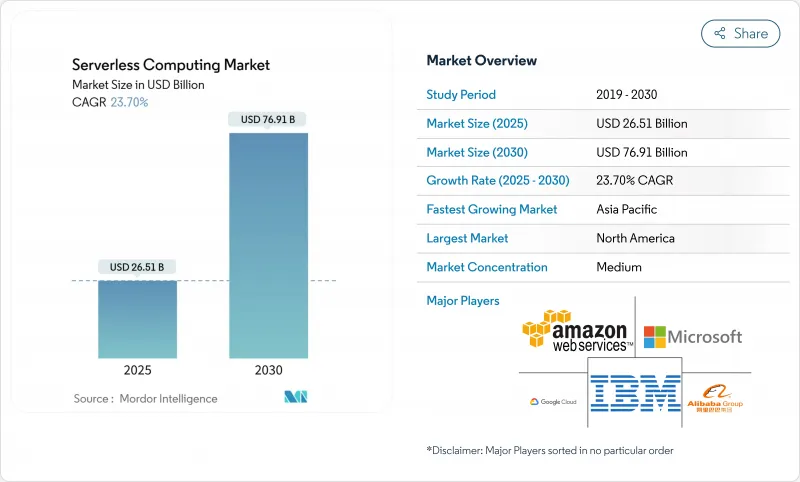
无伺服器运算市场预计将从 2025 年的 265.1 亿美元成长到 2030 年的 769.1 亿美元,复合年增长率为 23.7%。
随着开发团队希望无需管理基础架构即可编写程式码,超大规模云端如今已具备强大的可观测性、安全性和整合能力,因此对无伺服器架构的需求日益增长。事件驱动型微服务、边缘原生 5G配置以及需要亚秒级响应时间且规模庞大的即时 AI 工作负载进一步推动了这一趋势。随着企业目标从降低成本转向创新,他们正在利用无伺服器架构来加速推出新的数位化产品、实现 DevSecOps 自动化并支援资料主权架构。虽然公共云端仍然是主流部署模式,但随着企业在权衡最佳功能和供应商风险之间寻求平衡,多重云端策略正在兴起。
全球无伺服器运算市场趋势与洞察
北美银行、金融服务和保险(BFSI)现代化加速向事件驱动型微服务转型
银行和保险公司正在用细粒度服务取代单体架构,这些服务能够近乎即时地回应刷卡、贷款报价和诈骗讯号。一家北美大型金融机构透过使用无伺服器函数,将开发週期缩短了 35% 至 40%,并将基础设施成本降低了 28.3%。这种以执行次数收费的模式非常适合支付和财富管理平台常见的非规律性交易量。 API 优先的设计也简化了监管审核,因为每个函数都可以单独记录、加密和版本控制。随着零信任规则日益严格,银行、金融服务和保险 (BFSI) 团队倾向于使用临时计算,这种计算方式既能减少攻击面,又能满足严格的审核追踪要求。
欧洲零售和电子商务对支援DevSecOps的多重云端管道的需求激增
欧洲零售商正竞相支援即时结帐和个人化优惠,同时遵守 GDPR 法规。 89% 的零售商将无伺服器工作负载分布在至少两个云端平台上,以避免被供应商锁定并保持区域资料驻留。内建策略引擎会在每次提交程式码时进行扫描,将安全性测试整合到 CI/CD 流程中,并自动加密金钥以缩短漏洞视窗。分散式安全策略使团队能够缩短修復时间,并在诸如双十一和黑色星期五等销售高峰期更快地推送新功能。
高度分布式微函数中的调试和可观测性差距
传统的应用效能管理 (APM) 代理程式无法追踪毫秒级的瞬态函数,导致根本原因分析存在盲点。企业反映,排查无伺服器应用的故障所需时间是单体应用的 2.4 倍,因为日誌分散在各个服务中,冷启动也会掩盖延迟异常。目前,新兴解决方案会注入轻量级的 span ID 并将其汇出到开放标准的后端,但其成熟度落后于主流工具。在追踪、指标和日誌实现无缝整合之前,规避风险的部门可能会对迁移关键业务系统犹豫不决。
细分市场分析
到2024年,随着企业优先考虑承包运营,託管服务将占总收入的62%;而随着企业开展复杂的现代化项目,专业服务到2030年将以18.4%的复合年增长率增长。许多受监管的企业正在聘请咨询合作伙伴,以重新设计事件模式、重构单体架构并在运作前检验合规性。咨询团队将无伺服器安全模式、策略即代码和财务营运仪表板整合起来,以最大限度地提高业务价值。
专业服务也透过培训产品团队掌握非同步设计和可观测性的最佳实践,来支持这种文化转变。随着无伺服器架构的应用范围扩展到分析、人工智慧和边缘运算领域,持续的管治和平台工程服务也与开发支援一起纳入捆绑式服务。这种演变既能为整合商保持获利成长,又能缩短企业实现价值的时间。
到 2024 年,函数即服务 (FaaS) 将占总支出的 58%,并将持续支撑无伺服器运算市场至 2030 年。然而,后端即服务 (BaaS) 是一个成长迅速的细分市场,年复合成长率 (CAGR) 高达 25%,这主要得益于团队寻求更高级的架构,将身份验证、储存和即时同步等功能整合到 API 呼叫中。行动开发者尤其青睐登入和推播通知的单行集成,这可以将推出週期从数週缩短至数小时。
BaaS 透过卸载例行任务来补充 FaaS,使函数能够专注于差异化逻辑。统一的 API 闸道可在两种范式之间统一路由流量,而无伺服器容器则可弥补需要更长时间运行的程序的效能差距。架构师可以根据成本、延迟和合规性需求,灵活地组合不同的抽象层。
区域分析
到2024年,北美将占据无伺服器架构收入的38%,这主要得益于北美丰富的云端运算人才、积极的数位银行发展蓝图,以及美国联邦政府推行的零信任政策,该政策鼓励使用临时运算来减少攻击面。企业正在利用无伺服器架构来升级传统架构、采用事件流实现客户个人化,并运行符合合规要求的日誌记录管道。加拿大也呈现类似的趋势,尤其是在通讯业者整合5G边缘运算能力方面。同时,墨西哥的金融科技新兴企业正在采用无伺服器架构来安全地扩展支付API。
亚太地区是成长最快的区域,预计到2030年将以19.8%的复合年增长率成长。中国互联网巨头正在投资原生无伺服器人工智慧服务;印度蓬勃发展的SaaS产业正在采用计量收费模式来应对难以预测的全球需求;日本和韩国的製造商正在整合边缘运算能力以进行预测性维护;东协的金融科技和电子商务企业正在部署多重云端无伺服器架构,以低延迟的方式触达区域客户。 5G MEC、价格合理的云端空间以及开发人员技能的提升,正在加速全部区域的采用。
为了满足 GDPR 和国家主权法规的要求,企业纷纷采用多重云端,欧洲仍保持强劲的势头。英国、德国和法国在零售、银行和公共部门试点计画中处于领先地位,这些试点计画共用一套通用的加密、审核和驻留蓝图。北欧国家则在绿色资料中心整合和事件驱动型能源网路方面不断突破创新。供应商也积极回应,推出在地化区域和可携式运行时环境,在日益严格的合规环境下,依然推动了业务成长。
其他福利:
- Excel格式的市场预测(ME)表
- 3个月的分析师支持
目录
第一章 引言
- 研究假设和市场定义
- 调查范围
第二章调查方法
第三章执行摘要
第四章 市场情势
- 市场概览
- 市场驱动因素
- 北美银行、金融服务和保险(BFSI)现代化加速向事件驱动型微服务转型
- 欧洲零售和电子商务对支援DevSecOps的多重云端的需求激增
- 边缘原生 5G MEC 部署推动亚洲通讯业者采用无伺服器技术
- 即时人工智慧/机器学习推理工作负载推动医疗保健领域函数即服务 (FaaS) 的采用
- 美国联邦政府的零信任指令活性化在IT领域应用无伺服器安全工具链。
- 拉丁美洲金融科技生态系中API货币化平台的快速扩张
- 市场限制
- 高度分布式微函数中的调试和可观测性差距
- 专有事件编配引擎会加剧供应商锁定风险。
- 多区域无伺服器资料储存中的资料驻留合规性障碍
- 高频交易和游戏工作负载中的冷启动延迟限制
- 价值链分析
- 监理展望
- 技术展望
- 波特五力分析
- 供应商的议价能力
- 买方的议价能力
- 新进入者的威胁
- 替代品的威胁
- 竞争对手之间的竞争
- 投资分析
- 技术概览
- API 网关
- 函数即服务 (FaaS)
- 后端即服务 (BaaS)
- 资料库即服务 (DBaaS)
第五章 市场规模与成长预测
- 按服务模式
- 专业服务
- 託管服务
- 按服务类型
- 函数即服务 (FaaS)
- 后端即服务 (BaaS)
- API 网关
- 容器即服务 (CaaS)
- 按部署模式
- 公有云
- 私有云端
- 混合云
- 多重云端
- 按最终用户行业划分
- 资讯科技/通讯
- BFSI
- 零售与电子商务
- 政府/公共部门
- 医疗保健和生命科学
- 工业和製造业
- 媒体与娱乐
- 其他的
- 按地区
- 北美洲
- 美国
- 加拿大
- 墨西哥
- 南美洲
- 巴西
- 阿根廷
- 其他南美洲
- 欧洲
- 英国
- 德国
- 法国
- 义大利
- 西班牙
- 其他欧洲地区
- 北欧国家
- 瑞典
- 挪威
- 丹麦
- 芬兰
- 中东
- 沙乌地阿拉伯
- 阿拉伯聯合大公国
- 土耳其
- 其他中东地区
- 非洲
- 南非
- 奈及利亚
- 埃及
- 其他非洲地区
- 亚太地区
- 中国
- 印度
- 日本
- 韩国
- ASEAN
- 亚太其他地区
- 北美洲
第六章 竞争情势
- 市场集中度
- 策略趋势
- 市占率分析
- 公司简介
- Amazon Web Services Inc.
- Microsoft Corp.
- Google LLC
- Alibaba Group Holding Ltd.
- IBM Corp.
- Oracle Corp.
- SAP SE
- VMware Inc.
- Red Hat Inc.
- Cloudflare Inc.
- Fastly Inc.
- Tencent Cloud
- Huawei Cloud
- Netlify Inc.
- Vercel Inc.
- DigitalOcean Inc.
- Iron.io
- TriggerMesh Inc.
- Serverless Inc.
- Stackery Inc.
第七章 市场机会与未来展望
The serverless computing market is valued at USD 26.51 billion in 2025 and is forecast to touch USD 76.91 billion by 2030, advancing at a 23.7% CAGR.
Demand is rising because development teams want to write code without managing infrastructure, and hyperscale clouds now bundle robust observability, security and integration capabilities. Momentum is reinforced by event-driven microservices, edge-native 5G deployments, and real-time AI workloads that scale irregularly yet require sub-second response. Enterprises are moving from cost savings to innovation goals, using serverless to speed new digital products, automate DevSecOps and support data-sovereign architectures. Public cloud remains the dominant deployment model, but multi-cloud strategies are gaining ground as enterprises look to balance best-of-breed features with vendor risk.
Global Serverless Computing Market Trends and Insights
Accelerating Shift to Event-Driven Microservices in North American BFSI Modernization
Banks and insurers are replacing monoliths with granular services that react to card swipes, loan quotes and fraud signals in near real time. Using serverless functions, leading North American institutions trimmed development cycles by 35-40% and shaved 28.3% off infrastructure spend, freeing budget for new digital features. The model's pay-per-execute billing fits irregular transaction volumes common in payments and wealth platforms. API-first designs also simplify regulatory audits because each function can log, encrypt and version individually. As zero-trust rules tighten, BFSI teams prefer ephemeral compute that reduces attack surface while meeting stringent audit trails.
Surging Demand for DevSecOps-Ready Multi-Cloud Pipelines Across European Retail and E-commerce
European retailers race to match instant checkout and personalized offers while obeying GDPR. Eighty-nine percent now distribute serverless workloads across at least two clouds to avoid lock-in and maintain regional data residency. Built-in policy engines scan code on every commit, integrate security tests into CI/CD and auto-encrypt secrets, shrinking vulnerability windows. By shifting security left, teams cut remediation time and push features faster during seasonal peaks such as Singles' Day and Black Friday.
Debugging and Observability Gaps in Highly Distributed Micro-Functions
Traditional APM agents cannot trace ephemeral functions that live for milliseconds, leaving blind spots during root-cause analysis. Enterprises report troubleshooting serverless apps takes 2.4 times longer than monoliths because logs scatter across services and cold-starts mask latency outliers. Emerging solutions now inject lightweight span IDs and export them to open-standard back ends, yet maturity lags mainstream tooling. Until traces, metrics and logs consolidate seamlessly, risk-averse sectors will hesitate to migrate mission-critical systems.
Other drivers and restraints analyzed in the detailed report include:
- Roll-out of Edge-Native 5G MEC Driving Serverless Adoption Among Asia Telecom Operators
- Real-Time AI/ML Inference Workloads Propelling Function-as-a-Service Uptake in Healthcare
- Vendor Lock-In Risk Amplified by Proprietary Event Orchestration Engines
For complete list of drivers and restraints, kindly check the Table Of Contents.
Segment Analysis
Managed Services held 62% of 2024 revenue as organizations prioritized turnkey operations, but Professional Services is expanding at an 18.4% CAGR to 2030 as firms tackle complex modernization programs. Many regulated enterprises hire consulting partners to redesign event schemas, refactor monoliths and validate compliance before going live. Advisory teams integrate serverless security patterns, policy-as-code and FinOps dashboards to maximize business value.
Professional Services also support culture change, training product squads on asynchronous design and observability best practices. As serverless footprints widen to analytics, AI and edge, continuous governance and platform engineering join development assistance in bundled engagements. This evolution sustains high-margin growth for integrators while improving enterprise time-to-value.
Function-as-a-Service captured 58% of spending in 2024 and will keep anchoring the serverless computing market through 2030. Yet Backend-as-a-Service is the star growth segment at 25% CAGR as teams seek higher-level constructs that collapse authentication, storage and real-time sync into API calls. Mobile developers in particular appreciate one-line integration for login and push notifications, cutting launch cycles from weeks to hours.
BaaS complements FaaS by offloading boilerplate tasks, letting functions focus on differentiated logic. Unified API gateways route traffic uniformly across both paradigms, while serverless containers fill performance gaps that demand longer-lived processes. The spectrum of abstractions allows architects to mix and match for cost, latency and compliance needs.
The Serverless Computing Market Report is Segmented by Service Model (Professional Services and Managed Services), Service Type (Function-As-A-Service (FaaS), Backend-As-A-Service (BaaS), and More), Deployment Model (Public Cloud, Private Cloud, and More), End-User Industry (IT and Telecommunications, BFSI, and More), and Geography
Geography Analysis
North America drove 38% of 2024 serverless revenue, supported by abundant cloud talent, aggressive digital banking roadmaps, and U.S. federal zero-trust directives that favor ephemeral compute for reduced attack surface. Enterprises leverage serverless to modernize legacy stacks, employ event streams for customer personalization, and run compliance-ready logging pipelines. Canada mirrors these patterns, especially among telcos integrating 5G edge functions, while Mexico's fintech startups adopt serverless to scale payment APIs securely.
Asia Pacific is the fastest-growing region, projected at 19.8% CAGR to 2030. China's internet majors invest in native serverless AI services, and India's booming SaaS sector embraces the pay-as-you-go model to manage unpredictable global demand. Japanese and South Korean manufacturers integrate edge functions for predictive maintenance, whereas ASEAN fintech and e-commerce players deploy multi-cloud serverless stacks to reach regional customers with low latency. The confluence of 5G MEC, affordable cloud spots and developer upskilling accelerates uptake across the region.
Europe maintains a strong position as organizations adopt multi-cloud to satisfy GDPR and state sovereignty rules. The United Kingdom, Germany and France lead with retail, banking and public-sector pilots that share common blueprints for encryption, audit and residency. Nordic countries push boundaries with green data-center integrations and event-driven energy grids. Vendors respond with localized zones and portable runtimes, reinforcing growth despite stricter compliance landscapes.
- Amazon Web Services Inc.
- Microsoft Corp.
- Google LLC
- Alibaba Group Holding Ltd.
- IBM Corp.
- Oracle Corp.
- SAP SE
- VMware Inc.
- Red Hat Inc.
- Cloudflare Inc.
- Fastly Inc.
- Tencent Cloud
- Huawei Cloud
- Netlify Inc.
- Vercel Inc.
- DigitalOcean Inc.
- Iron.io
- TriggerMesh Inc.
- Serverless Inc.
- Stackery Inc.
Additional Benefits:
- The market estimate (ME) sheet in Excel format
- 3 months of analyst support
TABLE OF CONTENTS
1 INTRODUCTION
- 1.1 Study Assumptions and Market Definition
- 1.2 Scope of the Study
2 RESEARCH METHODOLOGY
3 EXECUTIVE SUMMARY
4 MARKET LANDSCAPE
- 4.1 Market Overview
- 4.2 Market Drivers
- 4.2.1 Accelerating shift to event-driven microservices in North American BFSI modernisation
- 4.2.2 Surging demand for DevSecOps-ready multi-cloud pipelines across European retail and e-commerce
- 4.2.3 Roll-out of edge-native 5G MEC driving serverless adoption among Asia telecom operators
- 4.2.4 Real-time AI/ML inference workloads propelling Function-as-a-Service uptake in healthcare
- 4.2.5 Government Zero-Trust mandates boosting serverless security toolchains in US federal IT
- 4.2.6 Rapid expansion of API monetisation platforms in LATAM fintech ecosystems
- 4.3 Market Restraints
- 4.3.1 Debugging and observability gaps in highly distributed micro-functions
- 4.3.2 Vendor lock-in risk amplified by proprietary event orchestration engines
- 4.3.3 Data residency compliance hurdles for multi-region serverless data stores
- 4.3.4 Cold-start latency constraints in high-frequency trading and gaming workloads
- 4.4 Value Chain Analysis
- 4.5 Regulatory Outlook
- 4.6 Technological Outlook
- 4.7 Porter's Five Forces Analysis
- 4.7.1 Bargaining Power of Suppliers
- 4.7.2 Bargaining Power of Buyers
- 4.7.3 Threat of New Entrants
- 4.7.4 Threat of Substitutes
- 4.7.5 Intensity of Competitive Rivalry
- 4.8 Investment Analysis
- 4.9 Technology Snapshot
- 4.9.1 API Gateway
- 4.9.2 Function-as-a-Service (FaaS)
- 4.9.3 Backend-as-a-Service (BaaS)
- 4.9.4 Database-as-a-Service (DBaaS)
5 MARKET SIZE AND GROWTH FORECASTS (VALUE)
- 5.1 By Service Model
- 5.1.1 Professional Services
- 5.1.2 Managed Services
- 5.2 By Service Type
- 5.2.1 Function-as-a-Service (FaaS)
- 5.2.2 Backend-as-a-Service (BaaS)
- 5.2.3 API Gateway
- 5.2.4 Container-as-a-Service (CaaS)
- 5.3 By Deployment Model
- 5.3.1 Public Cloud
- 5.3.2 Private Cloud
- 5.3.3 Hybrid Cloud
- 5.3.4 Multi-Cloud
- 5.4 By End-user Industry
- 5.4.1 IT and Telecommunications
- 5.4.2 BFSI
- 5.4.3 Retail and E-commerce
- 5.4.4 Government and Public Sector
- 5.4.5 Healthcare and Life Sciences
- 5.4.6 Industrial and Manufacturing
- 5.4.7 Media and Entertainment
- 5.4.8 Others
- 5.5 By Geography
- 5.5.1 North America
- 5.5.1.1 United States
- 5.5.1.2 Canada
- 5.5.1.3 Mexico
- 5.5.2 South America
- 5.5.2.1 Brazil
- 5.5.2.2 Argentina
- 5.5.2.3 Rest of South America
- 5.5.3 Europe
- 5.5.3.1 United Kingdom
- 5.5.3.2 Germany
- 5.5.3.3 France
- 5.5.3.4 Italy
- 5.5.3.5 Spain
- 5.5.3.6 Rest of Europe
- 5.5.4 Nordics
- 5.5.4.1 Sweden
- 5.5.4.2 Norway
- 5.5.4.3 Denmark
- 5.5.4.4 Finland
- 5.5.5 Middle East
- 5.5.5.1 Saudi Arabia
- 5.5.5.2 United Arab Emirates
- 5.5.5.3 Turkey
- 5.5.5.4 Rest of Middle East
- 5.5.6 Africa
- 5.5.6.1 South Africa
- 5.5.6.2 Nigeria
- 5.5.6.3 Egypt
- 5.5.6.4 Rest of Africa
- 5.5.7 Asia Pacific
- 5.5.7.1 China
- 5.5.7.2 India
- 5.5.7.3 Japan
- 5.5.7.4 South Korea
- 5.5.7.5 ASEAN
- 5.5.7.6 Rest of Asia Pacific
- 5.5.1 North America
6 COMPETITIVE LANDSCAPE
- 6.1 Market Concentration
- 6.2 Strategic Moves
- 6.3 Market Share Analysis
- 6.4 Company Profiles (includes Global level Overview, Market level overview, Core Segments, Financials as available, Strategic Information, Market Rank/Share for key companies, Products and Services, and Recent Developments)
- 6.4.1 Amazon Web Services Inc.
- 6.4.2 Microsoft Corp.
- 6.4.3 Google LLC
- 6.4.4 Alibaba Group Holding Ltd.
- 6.4.5 IBM Corp.
- 6.4.6 Oracle Corp.
- 6.4.7 SAP SE
- 6.4.8 VMware Inc.
- 6.4.9 Red Hat Inc.
- 6.4.10 Cloudflare Inc.
- 6.4.11 Fastly Inc.
- 6.4.12 Tencent Cloud
- 6.4.13 Huawei Cloud
- 6.4.14 Netlify Inc.
- 6.4.15 Vercel Inc.
- 6.4.16 DigitalOcean Inc.
- 6.4.17 Iron.io
- 6.4.18 TriggerMesh Inc.
- 6.4.19 Serverless Inc.
- 6.4.20 Stackery Inc.
7 MARKET OPPORTUNITIES AND FUTURE OUTLOOK
- 7.1 White-space and Unmet-need Assessment
 2026年全球无伺服器运算平台市场报告
 全球无伺服器运算市场规模、份额、趋势和成长分析报告(2026-2034年)
 全球GPU加速AI伺服器市场(按伺服器类型、散热技术、部署方式、应用领域和最终用户产业划分)预测(2026-2032年)无伺服器运算市场:按元件、部署模型、组织规模和最终用户产业划分,全球预测,2026-2032 年无伺服器运算市场 - 2026-2031 年预测
 无伺服器运算市场按服务模式、部署类型、最终用户和地区划分
 无伺服器运算市场预测至 2032 年:按服务类型、部署模式、企业规模、最终用户和地区分類的全球分析
 无伺服器运算市场:全球产业分析、市场规模、份额、成长、趋势与未来预测(2025-2032)
 全球无伺服器运算市场
 无伺服器计算全球市场规模、份额、趋势分析报告,按服务模式、公司规模、部署、行业、地区、展望和预测,2024 年至 2031 年