


 |
市场调查报告书
商品编码
1851827
电线电缆:市场占有率分析、产业趋势、统计数据、成长预测(2025-2030 年)Wire And Cable - Market Share Analysis, Industry Trends & Statistics, Growth Forecasts (2025 - 2030) |
||||||
※ 本网页内容可能与最新版本有所差异。详细情况请与我们联繫。
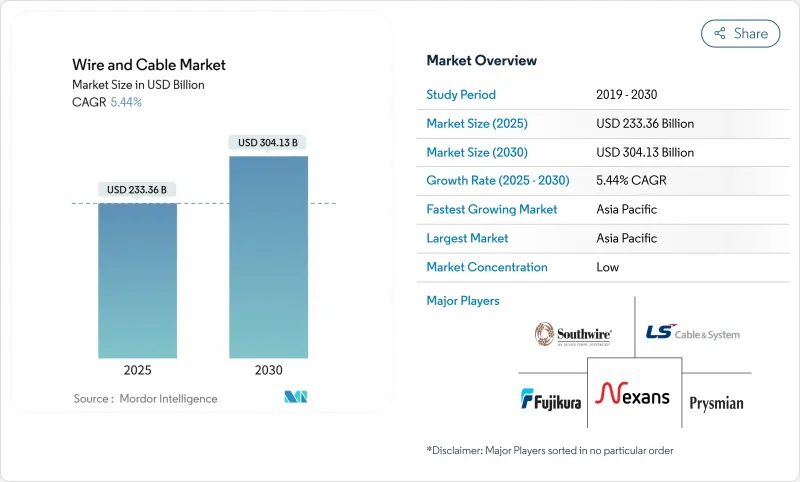
预计到 2025 年,电线电缆市场规模将达到 2,333.6 亿美元,预计到 2030 年将达到 3,041.3 亿美元,在预测期(2025-2030 年)内复合年增长率为 5.44%。
随着电网向分散式发电转型,以及支援人工智慧资料中心和5G骨干网路的数位基础设施不断扩展,需求将加速成长。离岸风力发电的海底出口连结、人口稠密经济体的光纤到户(FTTH)部署以及交通电气化正在重塑产品组合、生产布局和采购週期。一方面,交联聚乙烯(XLPE)化合物供不应求;另一方面,铜价屡创新高,导致计划预算不断攀升。能够获得原料合约、增加高压产能并在成长地区实现在地化生产的企业,将获得竞争优势。
全球电线电缆市场趋势与洞察
北海和东亚地区对离岸风电高压电缆的需求正在迅速增长。
自2020年以来,创纪录的离岸风力发电使高压海底电缆的年度订单竞标。得标电缆长度从2016年的759公里飙升至2022年的近2000公里,导致2025年合约的前置作业时间从12-18个月延长至24-30个月。光是北海到2030年就需要超过8,000公里的出口电缆,而从东亚到2033年将新增146吉瓦的装置容量。市场领导持续扩张:普睿司曼公司签署了一份价值50亿美元的德国计划合同,NKT公司正在将其位于卡尔斯克鲁纳的工厂产能翻番,耐克森公司则正在增加第二艘挪威电缆铺设船。目前,全球仅有六家供应商具备生产800千伏/4吉瓦直流电缆的资格,导致产能日益紧张。
印度和东协加速推进光纤到户部署
到2025年,印度的BharatNet预算将成长238%,达到2,200亿卢比,用于兴建1,2,000条新的光纤到户(FTTH)线路和69,2676公里的光纤。预端接组件和微型沟槽技术已将农村地区的部署成本降低了30%,并缩短了安装时间。东协各国政府的目标是到2030年使40%的家庭能够使用1Gbps的消费级网络,从而加速从铜缆到光纤的转换。因此,光纤普及率的提高促使电缆製造商将资本投资从利润较低的铜缆区域网路电缆转向光纤预製棒、光纤带和微导管产品。
交联聚乙烯树脂供应瓶颈限制了高功率电动车的生产。
交联聚乙烯的短缺导致特高压电缆的前置作业时间比2022年水准延长了30%至40%。表面缺陷研究表明,刮痕会使电场应力增加1.6倍,并将击穿电压从129.6千伏降低至59.1千伏,导致更多工厂测试失败。德克萨斯州和新加坡的扩建计画要到2026年底才能达到额定容量,这将进一步加剧供应紧张的局面。目前,电网营运商正在竞标混合方案,该方案结合了气体绝缘母线槽和有限的电缆敷设,以填补供应缺口。
细分市场分析
2024年,低压电缆将维持54%的收入份额,主要受住宅建设和家用电子电器的推动。儘管销量下降,超高压电缆仍将维持7.9%的复合年增长率,这得益于离岸风力发电和远距可再生能源併网计划的推动。预计到2030年,高压产品在电线电缆市场的份额将稳定成长。各国为实现碳中和电网而製定的国家能源政策目标,将推动±525kV高压直流输电线路的大规模采购,从而缩短交付週期,并锁定未来数年的OEM生产份额。
欧洲的投资动能最为强劲,2025年至2027年间电网扩建总合预算将超过500亿欧元。可再生能源併网走廊的加速监管也支撑了高压输电线路电缆市场规模的成长。製造商正透过采用更大规模的连续硫化生产线、线上局部放电监测和机器人绝缘挤出等方式来提高产量并降低次品率。
到2024年,电力电缆将占总收入的61%,这反映了电网和工业电气化的支出。光纤收入虽然占比较小,但预计到2030年将以每年8.6%的速度成长,这主要得益于各国政府资助普及宽频建设,以及云端超大规模资料中心业者延迟要求极高的骨干网路。这一差异表明,光纤是整个线缆市场的主要成长引擎。对抗弯曲性强的扁平电缆和小直径微型电缆的需求不断增长,正促使玻璃预製棒供应商扩大生产规模,并推出无氢製程。
光纤的应用范围已从电讯扩展到工厂自动化、智慧建筑和恶劣环境感测等领域。多芯光纤电缆正在取代机器人领域传统的铜芯串行电缆,提供抗电磁干扰和减轻重量的优势。随着光纤到户(FTTH)的普及,预计未来十年内,由光纤丛集驱动的线缆市场规模将超过室内Cat6线。
这份电线电缆市场报告按电压等级(特高压、中压、其他)、电缆类型(电力电缆、光纤电缆、其他)、导体材料(铜、铝、光学玻璃/聚合物)、安装方式(架空、其他)、最终用户(住宅建筑、商业建筑、其他)和地区进行细分。市场预测以美元计价。
区域分析
亚太地区将在2024年占全球营收的54%,并预计到2030年将以6.1%的复合年增长率成长。中国超高压电网和聚合物化合物的领先地位确保了该地区的规模经济效益,而印度的BharatNet项目和智慧计量目标正推动国内电缆工厂转向光纤和架空束状导体的生产。东南亚各国政府正大力推动海底电力互联项目,以平衡可再生能源的供应,并扩大区域电厂的采购配额。
北美正优先考虑可再生能源的整合和韧性。到2030年,美国大西洋沿岸离岸风力发电电场需要10吉瓦的出口装置容量。拜登政府的「电力增强和分散式能源」(BEAD)计画正将联邦补贴用于农村光纤建设,以满足国内对鬆套管和自主型(ADSS)输电线路的需求。加拿大向美国美国和中西部地区输送水力发电需要使用能够承受阿尔卑斯山极端高温的525千伏特高压直流电缆。
欧洲的脱碳之路仰赖互联互通的电网。仅德国就已累计213亿欧元用于高压直流输电走廊建设,并与LS Cables公司签署了多项协议。欧盟的「跨欧洲能源网路计画」将加快跨国审批流程,并扩大电线电缆市场规模。北欧国家正致力于绿氢能出口,促使海底电缆开发商考虑在未来的氢能管道沿线建造兼具电力和数据传输功能的骨干网路。
撒哈拉以南非洲是一个亟待发展的成长前沿地区。中压「Mission 300」计画和双边气候融资承诺将调动400亿美元用于电气化,从而扩大33千伏中压馈线、绝缘架空电缆和配电变压器领域的机会。开发银行的竞标包含在地化条款,鼓励合资企业,全球原始设备製造商也鼓励提升当地劳动力的技能并转移品质保证通讯协定。
其他福利:
- Excel格式的市场预测(ME)表
- 3个月的分析师支持
目录
第一章 引言
- 研究假设和市场定义
- 调查范围
第二章调查方法
第三章执行摘要
第四章 市场情势
- 市场概览
- 市场驱动因素
- 北海和东亚地区对离岸风电高压电缆的需求正在迅速增长。
- 加速印度和东协家庭光纤部署
- 电动车平台汽车线束的电气化
- 多边资助的撒哈拉以南非洲电网互联计划
- 市场限制
- 交联聚乙烯树脂供应瓶颈限制了高功率电动车的生产。
- 铜价波动对中东和北非的贸易利润带来压力。
- 价值/供应链分析
- 监理展望
- 技术展望
- 波特五力分析
- 供应商的议价能力
- 买方的议价能力
- 新进入者的威胁
- 替代品的威胁
- 竞争对手之间的竞争
- 宏观经济影响评估
- 投资分析
第五章 市场规模与成长预测
- 透过电压
- 超高压(35kV 或更高)
- 中压(1-35千伏特)
- 低电压(低于1千伏特)
- 按电缆类型
- 电源线
- 光纤电缆
- 讯号和控制电缆
- 同轴电缆和资料电缆
- 按导体材料
- 铜
- 铝
- 光学玻璃/聚合物
- 透过装置
- 虚构的
- 地下
- 海底
- 按行业
- 建筑 - 住房
- 建筑商业
- 电力基础设施(公共产业和可再生能源)
- 通讯和资料中心
- 石油天然气和石化
- 汽车与出行
- 工业生产
- 按地区
- 北美洲
- 美国
- 加拿大
- 墨西哥
- 南美洲
- 巴西
- 阿根廷
- 其他南美洲国家
- 欧洲
- 英国
- 德国
- 法国
- 义大利
- 其他欧洲地区
- 中东和非洲
- 沙乌地阿拉伯
- 阿拉伯聯合大公国
- 南非
- 其他中东和非洲地区
- 亚太地区
- 中国
- 日本
- 印度
- 韩国
- 亚太其他地区
- 北美洲
第六章 竞争情势
- 市场集中度
- 策略趋势
- 市占率分析
- 公司简介
- Prysmian Group
- Nexans
- Sumitomo Electric Industries, Ltd.
- LS Cable and System Ltd.
- Southwire Company, LLC
- Fujikura Ltd.
- Furukawa Electric Co., Ltd.
- NKT A/S
- Belden Inc.
- CommScope Holding Co., Inc.
- TE Connectivity Ltd.
- Corning Incorporated
- Leoni AG
- Amphenol Corporation
- HELUKABEL GmbH
- Jiangsu Zhongtian Technology Co., Ltd.
- Heng Tong Optic-Electric Co., Ltd.
- Riyadh Cables Group
- Polycab India Ltd.
- KEI Industries Ltd.
- ZTT Group
第七章 市场机会与未来展望
The Wire And Cable Market size is estimated at USD 233.36 billion in 2025, and is expected to reach USD 304.13 billion by 2030, at a CAGR of 5.44% during the forecast period (2025-2030).
Demand accelerates as power grids pivot toward distributed generation and as digital infrastructure scales to support AI-enabled data centers and 5G backbones. Submarine export links for offshore wind, fiber-to-the-home (FTTH) roll-outs in populous economies, and the electrification of transport are reshaping product mixes, manufacturing footprints, and procurement cycles. Short supply of cross-linked polyethylene (XLPE) compounds on one side and record-high copper prices on the other are inflating project budgets, yet policy-backed capital flows into clean-energy and digital-inclusion programs offset these pressures. Competitive advantage is gravitating toward firms that can secure raw-material contracts, ramp high-voltage capacity, and localize production in growth regions.
Global Wire And Cable Market Trends and Insights
Surging Offshore Wind HV Cable Demand in North Sea & East Asia
Record auction volumes for offshore wind have doubled annual high-voltage submarine cable orders since 2020. Awarded lengths jumped from 759 km in 2016 to almost 2,000 km in 2022, pushing lead times from 12-18 months to 24-30 months for 2025 contracts. The North Sea alone will require over 8,000 km of export links by 2030, while East Asia adds 146 GW of capacity by 2033. Market leaders are expanding: Prysmian signed USD 5 billion of German projects, NKT is doubling its Karlskrona plant output, and Nexans is adding a second Norwegian cable-lay vessel. Only six global suppliers now qualify for +-800 kV/4 GW DC cables, intensifying a capacity crunch.
Accelerated Fiber-to-Home Roll-outs in India & ASEAN
India's BharatNet budget rose 238% to INR 22,000 crore in 2025, enabling 12 lakh new FTTH lines and 692,676 km of optical fiber. Pre-terminated assemblies and micro-trenching have lowered rural deployment costs by 30% and cut installation time. ASEAN governments are targeting 1 Gbps consumer plans for 40% of households by 2030, accelerating copper switch-off timetables. Consequently, fiber take-rates are nudging cable makers to shift capex from low-margin LAN copper to optical glass preform, ribbon, and micro-duct products.
XLPE Resin Supply Bottlenecks Limiting EHV Output
Cross-linked polyethylene shortages have stretched lead times for extra-high-voltage cable by 30-40% compared with 2022 levels. Surface-defect studies show scratches can raise electric-field stress 1.6X and cut breakdown voltage from 129.6 kV to 59.1 kV, forcing more rejects at factory tests. Planned expansions in Texas and Singapore will not reach nameplate capacity until late 2026, prolonging tightness. Grid operators now tender hybrid packages that combine gas-insulated bus ducts and limited cable runs to bridge the supply gap.
Other drivers and restraints analyzed in the detailed report include:
- Electrification of Automotive Harnesses for EV Platforms
- Sub-Saharan Grid Interconnect Projects Unlocking Multilateral Funding
- Copper Price Volatility Squeezing Contractor Margins in MENA
For complete list of drivers and restraints, kindly check the Table Of Contents.
Segment Analysis
Low-Voltage cables retained 54% revenue in 2024, anchored by residential build-outs and consumer electronics. Extra- & High-Voltage lines, though smaller in volume, are forecast to post a 7.9% CAGR as offshore wind farms and long-haul renewables drive interconnector projects. Owing to this trajectory, the wire and cable market share of high-voltage products is set to climb steadily through 2030. National Energy Policy targets for carbon-neutral grids stimulate bulk procurement of +-525 kV HVDC links, compressing delivery cycles and locking OEM production slots years ahead.
Investment momentum is most evident in Europe, where combined grid-expansion budgets exceed EUR 50 billion for 2025-2027, and in China's West-to-East transmission corridors. The wire and cable market size for high-voltage lines is supported by regulatory fast-tracking of renewable-integration corridors. Manufacturers are responding with larger continuous vulcanization lines, on-line partial-discharge monitoring, and robotized insulation extrusion to lift output and cut defect rates.
Power cables delivered 61% of the 2024 turnover, reflecting grid spending and industrial electrification. Fiber-optic revenue, while smaller, is projected to grow 8.6% annually to 2030 as governments fund universal broadband and cloud hyperscalers build latency-sensitive backbones. This differential positions fiber as the chief growth engine inside the broader wire and cable market. Rising demand for bend-insensitive ribbon and reduced-diameter micro-cables spurs glass-preform suppliers to expand and bring more hydrogen-free processes online.
Beyond telecoms, fiber penetrates factory automation, smart buildings, and harsh-environment sensing. Multi-core optical cables now replace legacy serial copper in robotics, offering EMI immunity and weight savings. As FTTH penetration deepens, the wire and cable market size attributed to optical glass clusters is forecast to overtake indoor Cat6 volumes by the decade's end.
The Wire and Cable Market Report Segmented by Voltage (Extra- and High-Voltage, Medium-Voltage, and More), Cable Type (Power Cable, Fiber-Optic Cable, and More), Conductor Material (Copper, Aluminum, Optical Glass / Polymer), Installation (Overhead, and More), End-User Vertical (Construction-Residential, Construction-Commercial, and More), and Geography. The Market Forecasts are Provided in Terms of Value (USD).
Geography Analysis
Asia Pacific anchored 54% of global 2024 revenue and is set to expand at a 6.1% CAGR to 2030. China's ultra-high-voltage grid corridors and its dominance in polymer compounding secure regional-scale economics, while India's BharatNet and Smart Metering goals redirect domestic cable factories toward fiber and aerial bundled conductors. Southeast Asian governments are rolling out undersea power interconnections to balance renewable resources, enlarging procurement lots for regional plants.
North America emphasizes renewable integration and resilience. U.S. offshore wind zones along the Atlantic require 10 GW of export capacity by 2030, and the Biden administration's BEAD program channels federal grants toward rural fiber builds, lifting domestic demand for loose-tube and all-dielectric self-supporting (ADSS) lines. Canada's hydro-export links to the U.S. Northeast and Midwest seek 525 kV HVDC cables rated for extreme Alpine temperatures.
Europe's decarbonization pathway hinges on interconnected grids; Germany alone earmarked EUR 21.3 billion for HVDC corridors, contracting LS Cable for multiple packages. The EU Trans-European Networks for Energy scheme accelerates cross-border approvals, enlarging the addressable wire and cable market. Nordic nations' focus on green hydrogen export compels subsea cable developers to consider dual-use power and data backbones along future hydrogen pipelines.
Sub-Saharan Africa remains the underserved growth frontier. Mission 300 and bilateral climate-finance pledges mobilize USD 40 billion for electrification and extend opportunities in 33-kV medium-voltage feeders, insulated overhead cables, and distribution transformers. Localization clauses within Development Bank tenders encourage joint ventures, nudging global OEMs to upskill regional workforces and transfer quality-assurance protocols.
- Prysmian Group
- Nexans
- Sumitomo Electric Industries, Ltd.
- LS Cable and System Ltd.
- Southwire Company, LLC
- Fujikura Ltd.
- Furukawa Electric Co., Ltd.
- NKT A/S
- Belden Inc.
- CommScope Holding Co., Inc.
- TE Connectivity Ltd.
- Corning Incorporated
- Leoni AG
- Amphenol Corporation
- HELUKABEL GmbH
- Jiangsu Zhongtian Technology Co., Ltd.
- Heng Tong Optic-Electric Co., Ltd.
- Riyadh Cables Group
- Polycab India Ltd.
- KEI Industries Ltd.
- ZTT Group
Additional Benefits:
- The market estimate (ME) sheet in Excel format
- 3 months of analyst support
TABLE OF CONTENTS
1 INTRODUCTION
- 1.1 Study Assumptions and Market Definition
- 1.2 Scope of the Study
2 RESEARCH METHODOLOGY
3 EXECUTIVE SUMMARY
4 MARKET LANDSCAPE
- 4.1 Market Overview
- 4.2 Market Drivers
- 4.2.1 Surging Offshore Wind HV Cable Demand in North Sea and East Asia
- 4.2.2 Accelerated Fiber-to-the-Home Roll-outs in India and ASEAN
- 4.2.3 Electrification of Automotive Harnesses for EV Platforms
- 4.2.4 Sub-Saharan Grid Interconnect Projects Unlocking Multilateral Funding
- 4.3 Market Restraints
- 4.3.1 XLPE Resin Supply Bottlenecks Limiting EHV Output
- 4.3.2 Copper Price Volatility Squeezing Contractor Margins in MENA
- 4.4 Value / Supply-Chain Analysis
- 4.5 Regulatory Outlook
- 4.6 Technological Outlook
- 4.7 Porter's Five Forces Analysis
- 4.7.1 Bargaining Power of Suppliers
- 4.7.2 Bargaining Power of Buyers
- 4.7.3 Threat of New Entrants
- 4.7.4 Threat of Substitutes
- 4.7.5 Intensity of Competitive Rivalry
- 4.8 Macroeconomic Impact Assessment
- 4.9 Investment Analysis
5 MARKET SIZE AND GROWTH FORECASTS (VALUE)
- 5.1 By Voltage
- 5.1.1 Extra- and High-Voltage (Greater Than 35 kV)
- 5.1.2 Medium-Voltage (1-35 kV)
- 5.1.3 Low-Voltage (Less Than 1 kV)
- 5.2 By Cable Type
- 5.2.1 Power Cable
- 5.2.2 Fiber-Optic Cable
- 5.2.3 Signal and Control Cable
- 5.2.4 Coaxial and Data Cable
- 5.3 By Conductor Material
- 5.3.1 Copper
- 5.3.2 Aluminum
- 5.3.3 Optical Glass / Polymer
- 5.4 By Installation
- 5.4.1 Overhead
- 5.4.2 Underground
- 5.4.3 Submarine
- 5.5 By End-User Vertical
- 5.5.1 Construction - Residential
- 5.5.2 Construction - Commercial
- 5.5.3 Power Infrastructure (Utilities and Renewables)
- 5.5.4 Telecommunications and Data Centers
- 5.5.5 Oil and Gas and Petrochemicals
- 5.5.6 Automotive and Mobility
- 5.5.7 Industrial Manufacturing
- 5.6 By Geography
- 5.6.1 North America
- 5.6.1.1 United States
- 5.6.1.2 Canada
- 5.6.1.3 Mexico
- 5.6.2 South America
- 5.6.2.1 Brazil
- 5.6.2.2 Argentina
- 5.6.2.3 Rest of South America
- 5.6.3 Europe
- 5.6.3.1 United Kingdom
- 5.6.3.2 Germany
- 5.6.3.3 France
- 5.6.3.4 Italy
- 5.6.3.5 Rest of Europe
- 5.6.4 Middle East and Africa
- 5.6.4.1 Saudi Arabia
- 5.6.4.2 UAE
- 5.6.4.3 South Africa
- 5.6.4.4 Rest of Middle East and Africa
- 5.6.5 Asia-Pacific
- 5.6.5.1 China
- 5.6.5.2 Japan
- 5.6.5.3 India
- 5.6.5.4 South Korea
- 5.6.5.5 Rest of Asia-Pacific
- 5.6.1 North America
6 COMPETITIVE LANDSCAPE
- 6.1 Market Concentration
- 6.2 Strategic Moves
- 6.3 Market Share Analysis
- 6.4 Company Profiles (includes Global level Overview, Market level overview, Core Segments, Financials as available, Strategic Information, Market Rank/Share for key companies, Products and Services, and Recent Developments)
- 6.4.1 Prysmian Group
- 6.4.2 Nexans
- 6.4.3 Sumitomo Electric Industries, Ltd.
- 6.4.4 LS Cable and System Ltd.
- 6.4.5 Southwire Company, LLC
- 6.4.6 Fujikura Ltd.
- 6.4.7 Furukawa Electric Co., Ltd.
- 6.4.8 NKT A/S
- 6.4.9 Belden Inc.
- 6.4.10 CommScope Holding Co., Inc.
- 6.4.11 TE Connectivity Ltd.
- 6.4.12 Corning Incorporated
- 6.4.13 Leoni AG
- 6.4.14 Amphenol Corporation
- 6.4.15 HELUKABEL GmbH
- 6.4.16 Jiangsu Zhongtian Technology Co., Ltd.
- 6.4.17 Heng Tong Optic-Electric Co., Ltd.
- 6.4.18 Riyadh Cables Group
- 6.4.19 Polycab India Ltd.
- 6.4.20 KEI Industries Ltd.
- 6.4.21 ZTT Group
7 MARKET OPPORTUNITIES AND FUTURE OUTLOOK
- 7.1 White-space and Unmet-need Assessment
 全球DAC高速电缆销售市场报告、竞争分析及区域机会(2026-2032年)
 全球DAC高速电缆市场分析及预测(至2032年)
 海上和陆上电缆市场:按电缆类型、安装方式、电压等级、绝缘材料、导体材料、应用和最终用户划分-2026-2032年全球预测地下电缆牵引机市场:2026年至2032年全球预测(按牵引机类型、驱动机构、电缆类型、牵引能力、运作模式、电缆尺寸、最终用途产业、安装方式、控制系统和应用划分)
 2026年全球有线电视及其他订阅节目市场报告电气接线端子市场:依电压等级、材料类型、绝缘类型、产品类型、线规和最终用途产业划分,全球预测,2026-2032年铠装电缆市场:依铠装类型、结构、电压、材料、安装和应用划分,全球预测(2026-2032)高速电缆摄影机市场:按系统类型、电缆材料、控制技术、有效载荷能力、安装方式和应用划分-全球预测,2026-2032年
 全球电力电缆产业(输配电),2025-2035年
 全球铜线电缆市场(至3032年)依绝缘类型、电压类型、安装方式(地下、架空、海底)、应用(建筑用线、电力电缆、通讯、汽车线束)、终端用户产业及地区划分