


 |
市场调查报告书
商品编码
1851850
雷达液位传送器:市场份额分析、行业趋势、统计数据和成长预测(2025-2030 年)Radar Level Transmitter - Market Share Analysis, Industry Trends & Statistics, Growth Forecasts (2025 - 2030) |
||||||
※ 本网页内容可能与最新版本有所差异。详细情况请与我们联繫。
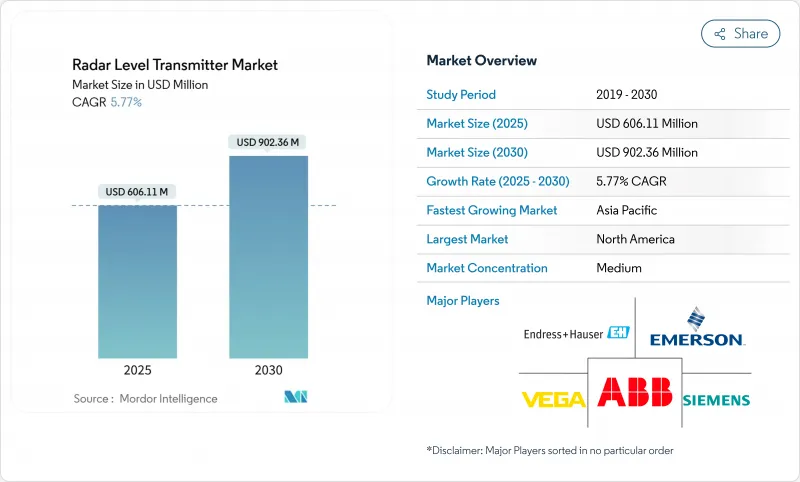
预计雷达液位传送器市场将从 2025 年的 6.0611 亿美元成长到 2030 年的 9.0236 亿美元,复合年增长率为 5.77%。
工业自动化专案需要精确的液位监测以满足日益严格的环境和安全法规,这推动了市场需求。欧洲石油接收站从超音波技术向 80 GHz 雷达技术的过渡、墨西哥湾海水淡化产能投资的增加以及北美老旧营业单位的维修升级,都是重要的成长动力。此外,中国的煤製化工计划正在采用导波雷达进行复杂介面测量,製造商也受益于无线、工业互联网感测器的稳定发展,这些感测器支援预测性维护。竞争优势体现在天线小型化、用于发泡体和低介电常数介质的先进讯号处理技术以及能够缩短试运行时间的服务体系。
全球雷达液位传送器市场趋势及洞察
欧盟石油接收站防护系统将采用80GHz雷达取代超音波感测器,用于油库溢油保护。
欧洲法规强制要求采用先进的溢流保护技术,促使操作人员以 80 GHz 雷达取代超音波液位计。窄波束角可集中微波能,即使在存在蒸气和温度波动的情况下也能实现可靠的测量;紧凑的天线设计简化了对浮动顶储罐的改造。此外,该技术无需维护,可确保合规性并降低生命週期成本。
海湾合作委员会海水淡化资本支出激增,推动雷达安装。
沙乌地阿拉伯、阿联酋和科威特三国合计占全球海水淡化产能的一半。新型多级闪蒸和逆渗透海水淡化厂需要能够承受腐蚀性高盐度浓盐水的非接触式雷达。与数位控制系统整合可提高能源效率和水回收率,因此雷达已成为该地区EPC合约中的标准配置。
泡沫反应器中的讯号损失
厚厚的泡沫层会衰减微波并产生杂散回波,阻碍乙氧基化和发酵槽中的液位控制。先进的讯号处理技术和混合雷达-电容探头可以缓解这个问题,但严重的发泡会从物理上限制雷达的穿透深度。
细分市场分析
到2024年,非接触式感测器将占总收入的65%,这反映出在腐蚀性或高温应用中,免维护运作的需求日益增长。该细分市场将以6.8%的复合年增长率成长,这主要得益于调频连续波(FMCW)平台提高了信噪比。导波雷达在介面侦测和高泡棉区域仍保持着独特的市场地位。紧凑型80 GHz天线现在可以改装到以前只能使用超音波探头的船舶上,从而扩大了雷达液位传送器市场的潜在需求。
蓝牙性能验证和感测器内诊断等数位化正在简化合规性审核,并提升雷达液位传送器产业的价值提案。供应商正将自监控功能定位为应对劳动力短缺的保障,并将雷达提升为企业资产性能平台的核心节点。
2024年,K波段(24-26 GHz)感测器仍将占出货量的38%,这主要得益于其成本效益和广泛的核准。然而,W波段(76-81 GHz和120 GHz)感测器的复合年增长率将达到7.4%,这得益于其小于3°的波束角,能够忽略叶轮和狭窄喷嘴,从而在40米高的塔筒和狭长的酿造釜中实现可靠的读数。美国、欧盟和中国的认证机构对W波段感测器在製程应用方面的认可,正在推动规模经济的实现,并逐渐降低其以往的价格溢价。加之组件成本的下降,W波段感测器的普及将重塑市场竞争格局。
区域分析
北美地区32%的收入来自成熟的石油、化学和食品产业,以及鼓励水利基础设施数位化升级的联邦津贴。公用事业公司正在利用云端连接雷达来减少现场巡检次数,而精酿啤酒厂则正在采用能够承受高强度原位清洗循环的卫生模式。
亚太地区是成长引擎,复合年增长率达7.5%,主要得益于中国煤製化工专案和印度智慧城市污水计划。澳洲矿业公司正在指定使用抗泡沫的80GHz设备进行尾矿处理,而东南亚的棕榈油精炼厂则需要用于黏性介质的导波式设备。
欧洲持续保持强劲发展势头,这主要得益于德国化工工业的製程优化以及甲烷排放法规对整个欧洲大陆储罐计量精度提出的更高要求。一家斯堪地那维亚公用事业公司正在采购适用于寒冷气候储罐的低功耗雷达感测器,优先考虑永续性和降低维护成本。
在中东,海水淡化热潮将支撑长期需求;而在拉丁美洲,铜和锂产业的扩张将推动以固态材料为中心的雷达部署。随着电气化进程的持续推进,非洲的水泥和饮料产业将采用成本更低的24GHz设备。
其他福利:
- Excel格式的市场预测(ME)表
- 3个月的分析师支持
目录
第一章 引言
- 研究假设和市场定义
- 调查范围
第二章调查方法
第三章执行摘要
第四章 市场情势
- 市场概览
- 市场驱动因素
- 欧盟石油接收站防护系统将采用80GHz雷达取代超音波感测器,用于油库溢油保护。
- 海湾合作委员会海水淡化投资热潮推动雷达安装量成长
- 中国煤化学界面测量需求
- 美国老旧水质净化厂迎来工业物联网改装浪潮
- 北美精酿啤酒厂采用卫生型非接触式雷达
- 澳洲采矿业尾矿坝用抗泡沫雷达
- 市场限制
- 发泡高强度反应器中的讯号损失
- 东协地区合格雷达技术人员短缺
- 高昂的初始成本与OEM撬装设备的超音波相比
- 在精度要求较高的场合,低介电常数粉末是关键。
- 价值/供应链分析
- 监理与技术展望
- 波特五力分析
- 新进入者的威胁
- 买方的议价能力
- 供应商的议价能力
- 替代品的威胁
- 竞争对手之间的竞争
第五章 市场规模与成长预测
- 透过技术
- 联繫系统(导波雷达)
- 非接触式系统(自由太空雷达)
- FMCW雷达
- 脉衝雷达
- 频宽
- C 波段和X波段(6 至 12 GHz)
- K波段(24-26 GHz)
- W波段(76-81和120 GHz)
- 透过使用
- 液体、浆液和介面
- 固体(散装粉末和颗粒)
- 按最终用户行业划分
- 石油和天然气
- 化工和石油化工
- 用水和污水
- 饮食
- 发电
- 製药和生物技术
- 金属和采矿
- 海洋/造船
- 其他行业(纸浆和造纸、水泥)
- 按地区
- 北美洲
- 美国
- 加拿大
- 墨西哥
- 欧洲
- 英国
- 德国
- 法国
- 义大利
- 其他欧洲地区
- 亚太地区
- 中国
- 日本
- 印度
- 韩国
- 亚太其他地区
- 中东
- 以色列
- 沙乌地阿拉伯
- 阿拉伯聯合大公国
- 土耳其
- 其他中东地区
- 非洲
- 南非
- 埃及
- 其他非洲地区
- 南美洲
- 巴西
- 阿根廷
- 其他南美洲国家
- 北美洲
第六章 竞争情势
- 市场集中度
- 策略性倡议(MandA、伙伴关係、新产品)
- 市占率分析
- 公司简介
- Emerson Electric Co.
- Siemens AG
- Endress+Hauser Group
- ABB Ltd.
- Honeywell International Inc.
- VEGA Grieshaber KG
- KROHNE Messtechnik
- Yokogawa Electric Corp.
- AMETEK Inc.
- Magnetrol International(AMETEK)
- Schneider Electric SE
- Pepperl+Fuchs SE
- Automation Products Group Inc.
- Nivelco Process Control Corp.
- Matsushima Measure Tech Co. Ltd.
- Hawk Measurement Systems
- Bindicator(Venture Measurement)
- Drexelbrook(Ametek)
- FEEJOY Technology
- SOR Inc.
第七章 市场机会与未来展望
The radar level transmitter market is valued at USD 606.11 million in 2025 and is forecast to reach USD 902.36 million by 2030, advancing at a 5.77% CAGR.
Demand is anchored in industrial automation programs that require precise level monitoring to meet stricter environmental and safety mandates. Technology migration from ultrasonic to 80 GHz radar in European oil terminals, growing desalination capital spending across the Gulf states, and retrofit activity in aging North-American water utilities are pivotal growth vectors. Manufacturers are also benefiting from coal-to-chemicals projects in China, where complex interface measurements favor guided-wave radar, and from a steady move toward wireless, Industrial-Internet-ready sensors that support predictive maintenance. Competitive differentiation hinges on antenna miniaturization, advanced signal processing for foam or low-dielectric media, and service ecosystems that shorten commissioning times.
Global Radar Level Transmitter Market Trends and Insights
80 GHz radar replacing ultrasonic sensors in EU oil-terminal overfill protection
European regulations mandate advanced overfill protection, prompting operators to replace ultrasonic gauges with 80 GHz radar. Narrow beam angles concentrate microwave energy, delivering reliable measurements even through vapors and temperature swings, while compact antenna designs simplify retrofits in tanks fitted with floating roofs. Coupled with maintenance-free operation, the technology ensures compliance and lowers lifecycle cost.
Desalination CAPEX boom in GCC boosting radar installations
Saudi Arabia, the UAE, and Kuwait collectively account for half of global desalination capacity. New multi-stage flash and reverse-osmosis plants demand non-contact radar that withstands corrosive, high-salinity brines. Integration with digital control systems improves energy efficiency and water recovery, embedding radar as a standard specification in regional EPC contracts.
Signal loss in foam-intense reactors
Thick foam layers attenuate microwaves, causing spurious echoes that disrupt level control in ethoxylation or fermentation vessels. Enhanced signal processing and hybrid radar-capacitance probes mitigate, but physics still limits radar penetration in extreme foaming.
Other drivers and restraints analyzed in the detailed report include:
- China coal-to-chemicals interface measurement demand
- Retrofit Wave of IIoT-Ready Instruments in Ageing US Water Plants
- Shortage of certified radar technicians in ASEAN
For complete list of drivers and restraints, kindly check the Table Of Contents.
Segment Analysis
Non-contact sensors captured 65% of 2024 revenue, reflecting preference for maintenance-free operation in corrosive or high-temperature duties. The sub-segment will expand at 6.8% CAGR, reinforced by frequency-modulated continuous-wave (FMCW) platforms that sharpen signal-to-noise ratios. Guided-wave radar retains a niche where interface detection or heavy foam is prevalent. Compact 80 GHz antennas now retrofit vessels once limited to ultrasonic probes, enlarging addressable demand for the radar level transmitter market.
Digital advances such as Bluetooth commissioning and in-sensor diagnostics simplify compliance audits, enhancing the radar level transmitter industry's value proposition. Suppliers position self-monitoring features as a hedge against workforce shortages, elevating radar to a core node in enterprise asset-performance platforms.
K-band (24-26 GHz) still held 38% of 2024 shipments, appreciated for cost-effectiveness and broad approvals. Yet W-band (76-81 GHz and 120 GHz) sensors show 7.4% CAGR due to sub-3° beam angles that ignore agitator blades and narrow nozzles, delivering reliable readings in 40-m columns or slender brew kettles. Certification agencies in the United States, EU, and China cleared W-band for process use, driving scale economies that are eroding historic price premiums. As component costs fall, W-band penetration will remake competitive positioning in the radar level transmitter market.
The Radar Level Transmitter Market Report is Segmented by Technology (Contact System, Non-Contact System), Frequency Range (C and X Band, K Band, W Band), Application (Liquids/Interfaces, Solids), End-User Industry (Oil and Gas, Chemicals, Water, Power Generation, Pharmaceuticals and Biotechnology, and More), and Geography. The Market Forecasts are Provided in Terms of Value (USD).
Geography Analysis
North America's 32% revenue share stems from mature oil, chemical, and food industries, coupled with federal grants that incentivize digital upgrades in water infrastructure. Utilities leverage cloud-connected radar to cut field visits, while craft brewers adopt hygienic models that withstand aggressive clean-in-place cycles.
Asia-Pacific is the growth engine at 7.5% CAGR, led by Chinese coal-to-chemicals plants and Indian smart-city wastewater projects. Australian miners specify foam-tolerant 80 GHz units for tailings management, and Southeast Asian palm-oil refineries demand guided-wave models that handle sticky media.
Europe maintains steady momentum, driven by process optimization in Germany's chemical parks and methane-emission rules that mandate tighter tank-gauging accuracy across the continent. Scandinavian utilities procure low-power radar sensors suited to cold-climate reservoirs, emphasizing sustainability and reduced servicing trips.
The Middle East's desalination boom anchors long-term demand, whereas Latin America's copper and lithium expansions support solids-focused radar deployments. Africa's cement and beverage sectors adopt cost-optimized 24 GHz units as electrification spreads.
- Emerson Electric Co.
- Siemens AG
- Endress+Hauser Group
- ABB Ltd.
- Honeywell International Inc.
- VEGA Grieshaber KG
- KROHNE Messtechnik
- Yokogawa Electric Corp.
- AMETEK Inc.
- Magnetrol International (AMETEK)
- Schneider Electric SE
- Pepperl+Fuchs SE
- Automation Products Group Inc.
- Nivelco Process Control Corp.
- Matsushima Measure Tech Co. Ltd.
- Hawk Measurement Systems
- Bindicator (Venture Measurement)
- Drexelbrook (Ametek)
- FEEJOY Technology
- SOR Inc.
Additional Benefits:
- The market estimate (ME) sheet in Excel format
- 3 months of analyst support
TABLE OF CONTENTS
1 INTRODUCTION
- 1.1 Study Assumptions and Market Definition
- 1.2 Scope of the Study
2 RESEARCH METHODOLOGY
3 EXECUTIVE SUMMARY
4 MARKET LANDSCAPE
- 4.1 Market Overview
- 4.2 Market Drivers
- 4.2.1 80 GHz Radar Replacing Ultrasonic Sensors in EU Oil-Terminal Overfill Protection
- 4.2.2 Desalination CAPEX Boom in GCC Boosting Radar Installations
- 4.2.3 China Coal-to-Chemicals Interface Measurement Demand
- 4.2.4 Retrofit Wave of IIoT-Ready Instruments in Ageing US Water Plants
- 4.2.5 Hygienic Non-Contact Radar Adoption by North-American Craft Breweries
- 4.2.6 Foam-Tolerant Radar for Tailings Dams in Australian Mining
- 4.3 Market Restraints
- 4.3.1 Signal Loss in Foam-Intense Reactors
- 4.3.2 Shortage of Certified Radar Technicians in ASEAN
- 4.3.3 High Up-Front Cost vs Ultrasonic on OEM Skids
- 4.3.4 Low-Dielectric Powders Causing Accuracy Concerns
- 4.4 Value / Supply-Chain Analysis
- 4.5 Regulatory and Technological Outlook
- 4.6 Porter's Five Forces Analysis
- 4.6.1 Threat of New Entrants
- 4.6.2 Bargaining Power of Buyers
- 4.6.3 Bargaining Power of Suppliers
- 4.6.4 Threat of Substitute Products
- 4.6.5 Intensity of Competitive Rivalry
5 MARKET SIZE AND GROWTH FORECASTS (VALUE)
- 5.1 By Technology
- 5.1.1 Contact System (Guided Wave Radar)
- 5.1.2 Non-Contact System (Free-Space Radar)
- 5.1.2.1 FMCW Radar
- 5.1.2.2 Pulsed Radar
- 5.2 By Frequency Range
- 5.2.1 C and X Band (6-12 GHz)
- 5.2.2 K Band (24-26 GHz)
- 5.2.3 W Band (76-81 and 120 GHz)
- 5.3 By Application
- 5.3.1 Liquids, Slurries and Interfaces
- 5.3.2 Solids (Bulk Powders and Granulates)
- 5.4 By End-user Industry
- 5.4.1 Oil and Gas
- 5.4.2 Chemicals and Petrochemicals
- 5.4.3 Water and Wastewater
- 5.4.4 Food and Beverages
- 5.4.5 Power Generation
- 5.4.6 Pharmaceuticals and Biotechnology
- 5.4.7 Metals and Mining
- 5.4.8 Marine and Shipbuilding
- 5.4.9 Other Industries (Pulp and Paper, Cement)
- 5.5 By Geography
- 5.5.1 North America
- 5.5.1.1 United States
- 5.5.1.2 Canada
- 5.5.1.3 Mexico
- 5.5.2 Europe
- 5.5.2.1 United Kingdom
- 5.5.2.2 Germany
- 5.5.2.3 France
- 5.5.2.4 Italy
- 5.5.2.5 Rest of Europe
- 5.5.3 Asia-Pacific
- 5.5.3.1 China
- 5.5.3.2 Japan
- 5.5.3.3 India
- 5.5.3.4 South Korea
- 5.5.3.5 Rest of Asia-Pacific
- 5.5.4 Middle East
- 5.5.4.1 Israel
- 5.5.4.2 Saudi Arabia
- 5.5.4.3 United Arab Emirates
- 5.5.4.4 Turkey
- 5.5.4.5 Rest of Middle East
- 5.5.5 Africa
- 5.5.5.1 South Africa
- 5.5.5.2 Egypt
- 5.5.5.3 Rest of Africa
- 5.5.6 South America
- 5.5.6.1 Brazil
- 5.5.6.2 Argentina
- 5.5.6.3 Rest of South America
- 5.5.1 North America
6 COMPETITIVE LANDSCAPE
- 6.1 Market Concentration
- 6.2 Strategic Moves (MandA, Partnerships, New Products)
- 6.3 Market Share Analysis
- 6.4 Company Profiles {(includes Global level Overview, Market level overview, Core Segments, Financials as available, Strategic Information, Market Rank/Share for key companies, Products and Services, and Recent Developments)}
- 6.4.1 Emerson Electric Co.
- 6.4.2 Siemens AG
- 6.4.3 Endress+Hauser Group
- 6.4.4 ABB Ltd.
- 6.4.5 Honeywell International Inc.
- 6.4.6 VEGA Grieshaber KG
- 6.4.7 KROHNE Messtechnik
- 6.4.8 Yokogawa Electric Corp.
- 6.4.9 AMETEK Inc.
- 6.4.10 Magnetrol International (AMETEK)
- 6.4.11 Schneider Electric SE
- 6.4.12 Pepperl+Fuchs SE
- 6.4.13 Automation Products Group Inc.
- 6.4.14 Nivelco Process Control Corp.
- 6.4.15 Matsushima Measure Tech Co. Ltd.
- 6.4.16 Hawk Measurement Systems
- 6.4.17 Bindicator (Venture Measurement)
- 6.4.18 Drexelbrook (Ametek)
- 6.4.19 FEEJOY Technology
- 6.4.20 SOR Inc.
7 MARKET OPPORTUNITIES AND FUTURE OUTLOOK
- 7.1 White-space and Unmet-Need Assessment
 雷达液位传送器市场规模、份额、趋势和预测:按技术、频段、应用、终端用户产业和地区划分,2026-2034年
 腐蚀性液体雷达液位计市场:按类型、输出讯号、安装方式、测量范围、材料和最终用户划分,全球预测(2026-2032年)
 2026年全球液位传送器市场报告
 液位传送器市场 - 全球产业规模、份额、趋势、机会及预测(按类型、产品、最终用户、地区和竞争格局划分,2021-2031年)
 浮球式液位传送器市场 - 2026-2031年预测
 液位传送器市场规模、份额和成长分析(按类型、技术、测量方法、应用、最终用户产业、输出类型和地区划分)-2026-2033年产业预测雷达液位传送器市场规模、份额及成长分析(依技术、频率范围、应用、产业垂直领域及地区划分)-2026-2033年产业预测
 重量变送器市场(按类型和地区)全球雷达液位发送器市场规模(按技术、频率范围、应用、地区和预测)全球液位传送器市场规模(按类型、技术、最终用户、区域覆盖和预测)