


 |
市场调查报告书
商品编码
1851856
电池能源储存系统(BESS):市场份额分析、行业趋势、统计数据和成长预测(2025-2030 年)Battery Energy Storage System (BESS) - Market Share Analysis, Industry Trends & Statistics, Growth Forecasts (2025 - 2030) |
||||||
※ 本网页内容可能与最新版本有所差异。详细情况请与我们联繫。
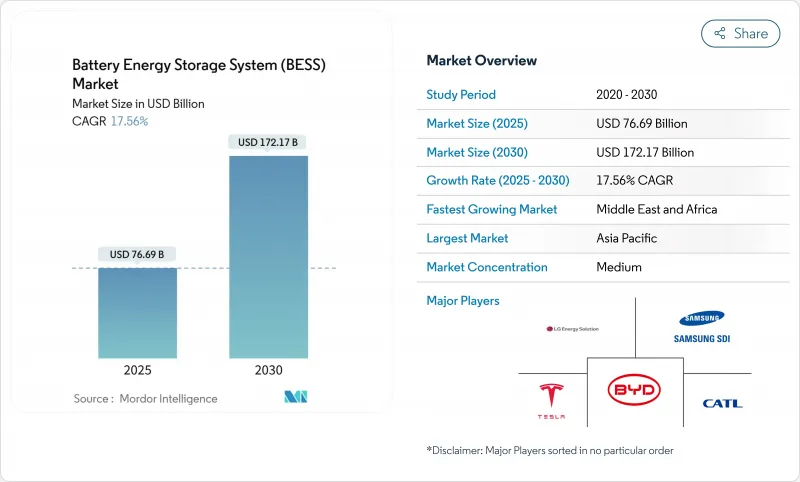
预计到 2025 年,电池能源储存系统市场规模将达到 766.9 亿美元,到 2030 年将达到 1,721.7 亿美元,预测期(2025-2030 年)复合年增长率为 17.56%。
锂离子电池成本的快速下降、有利的采购政策以及不断增长的电网现代化支出,正将大规模储能从一种小众的可靠性工具转变为主流基础设施。诸如美国《通膨降低法案》和欧盟《净零排放产业法案》等政策利多因素,正在推动数吉瓦级计划的发展。同时,电网整形逆变器的要求也拓展了储能的收入来源,使其不再局限于能源套利。此外,澳洲和智利已实现了太阳能和电池联合购电协议(PPA)的价格持平,证明四小时储能电池能够以具有竞争力的价格,提供可靠的晚高峰供电。不断增长的数据中心电力需求以及受政策驱动的供应链资源配置,进一步推动了该行业的蓬勃发展。
全球电池能源储存系统(BESS)市场趋势与洞察
美国、中国和欧盟的公用事业规模采购强制规定
强制采购正在再形成开发格局。加州2吉瓦、中国电力16吉瓦时以及韩国540兆瓦/3240兆瓦时的长期招标项目,都为开发商展现了收入和资金筹措的可能性。在欧洲,净零排放产业法规奖励国产产品,而中国近期的改革取消了严格的配额限制,让市场基本面主导经济运作。此类专案降低了融资成本,并将电力输送给符合电网服务性能保证的合格整合商。
采用併网逆变器可释放共置资料中心的价值。
从电网跟随架构转向电网整形架构,使得电池能够提供合成惯性和电压支撑,这些服务先前由电网营运商从同步发电中获取。 TransGrid 的研究表明,电网整形需要 4.8 吉瓦的容量,而 Fluence 在澳洲的 300 兆瓦计划也凸显了其商业性可行性。欧洲营运商 TenneT 预计到 2030 年储能装置容量将达到 5.2 至 12.7 吉瓦,凸显了其广泛的适用性。惯性产品带来的额外收入以及连网条件的改善,提升了计划的经济效益,并有利于混合光伏-储能专案的发展。
锂和石墨加工瓶颈
中国加工了全球90%的石墨,而印尼禁止镍出口的政策刺激了国内提炼,这带来了市场集中度过高的风险。材料短缺威胁电池生产,同时,数吉瓦级竞标却在激增。像Group14这样的新兴企业正在试行富硅阳极,但距离商业化生产仍需数年时间。回收项目可以缓解原生材料的需求,但物流方面的障碍限制了它们对需要高纯度原材料的公用事业规模计划的直接影响。
细分市场分析
到2024年,锂离子电池将维持88.6%的能源储存系统市场份额。然而,磷酸铁锂电池(LFP)在成本和热稳定性方面的优势,例如比亚迪在2024年部署的40GWh容量,将推动其实现19%的复合年增长率。在能量密度至关重要的领域,NMC电池仍将发挥重要作用,而钒液流电池和钠离子电池技术在长时和高循环应用领域正逐渐获得关注。随着电池小型化降低每度电成本,锂离子电池能源储存系统係统的市场规模预计将会扩大。化学成分的多样化降低了供应链风险,并使计划资金筹措能够采用针对特定资产的对冲结构。
不同地区的实施方案各不相同:中国电力公司提供超低成本的磷酸铁锂电池组,欧洲电力公司正在测试钠离子电池以提高其耐寒性,而美国电网营运商正在试验锌溴液流电池,以满足8小时供电需求。这些并行路径表明,电池化学成分的选择正朝着针对工作循环进行最佳化的方向发展,而非采用一刀切的模式。
併网系统在标准化互联和强劲的商业商机的推动下,预计到2024年将占总装机量的78%。然而,受农村电气化和工业韧性需求的驱动,离网领域正以18.5%的复合年增长率快速发展。巴基斯坦预计2030年将进口8.75吉瓦时的电力,显示市场对绕过薄弱国家基础设施的微电网的需求正在成长。
混合配置可在併网模式和孤岛模式之间切换,是目前应用领域中日益增长的一个子集,它能为需求者提供需求电价降低和备用电源。这些灵活的资产透过虚拟电厂聚合参与批发市场。目前,美国多家独立系统营运商正将其纳入电价调整方案中。
电池能源储存系统(BESS) 市场报告按电池类型(锂离子电池、磷酸锂铁、其他电池)、连接类型(併网、离网)、组件(电池组和支架、电力转换系统、其他电池)、能量容量范围(小于 100 MWh、其他能量容量范围)、最终用户应用(公共产业、住宅、其他公用事业)和地区细分(北美、欧洲、其他地区)。
区域分析
亚太地区预计到2024年将维持50.4%的市场份额,其中中国70吉瓦时的装置容量将以每年翻倍的速度成长。印度SECI的1吉瓦/2吉瓦时竞标标誌着该地区的能源市场迎来转捩点,而日本则透过1.67吉瓦时的容量市场竞标展现了储能技术在满足产能需求方面的重要作用。韩国推进了540兆瓦的竞标,LG能源解决方案公司向欧洲和日本出口了多吉瓦时的储能係统,凸显了该地区的製造业实力。
中东和非洲是成长最快的地区,年复合成长率达19.5%。沙乌地阿拉伯与阳光电源伙伴关係的7.8吉瓦计画以及埃及由非洲开发银行资助的200兆瓦时计划,都体现了大规模的能源投入。南非获得的1吉瓦计画凸显了储能技术如何解决电网长期不稳定的问题。此外,阿联酋正在整合19吉瓦时的储能容量,其中包括5.2吉瓦的太阳能发电厂,率先在沙漠气候地区发展基本负载可再生能源。
北美和欧洲仍然占据绝对规模的主导地位。美国已宣布投资1000亿美元,但其中2600吉瓦的计划仍需等待四年才能併网。欧洲的《净零排放产业法案》旨在实现供应链区域化,但已宣布的超级工厂项目中超过一半面临资金筹措延迟。区域政策的多样性——例如英国的产能市场、义大利的工厂义务以及加拿大的生产补贴——为经验丰富的开发商创造了多种多样的收入模式,可供他们进行套利。
其他福利:
- Excel格式的市场预测(ME)表
- 3个月的分析师支持
目录
第一章 引言
- 研究假设和调查方法的范围
- 市场定义
第二章调查方法
第三章执行摘要
第四章 市场情势
- 市场概览
- 近期趋势与创新
- 市场驱动因素
- 美国、中国和欧盟的公用事业规模采购指令订单了吉瓦级订单的成长。
- 电网整形逆变器需求释放託管价值堆迭
- 澳洲和智利光电+储能购电协议的价格持平
- 欧盟和美国的电池供应链模式促进了国内製造业的发展。
- 资料中心和人工智慧负载不断增长,推动北美地区对4小时储存的需求
- 亚洲电动汽车电池回收再利用降低了资本支出。
- 市场限制
- 印尼和非洲的锂和石墨加工瓶颈
- 由于消防安全法规(UL-9540A、NFPA-855)的加强,工厂平衡成本增加。
- 美国独立系统营运商(ISO)漫长的互联排队导致FTM计划收入延迟
- 高利率环境对商家收入带来压力
- 供应链分析
- 监管和政策环境
- 技术展望
- 波特五力模型
- 供应商的议价能力
- 买方的议价能力
- 新进入者的威胁
- 替代品的威胁
- 竞争对手之间的竞争
第五章 市场规模与成长预测
- 依电池类型
- 锂离子
- 磷酸锂铁(LFP)
- 镍锰钴(NMC)
- 铅酸电池
- 其他电池类型包括:液流电池(钒液流电池、锌溴液流电池)、钠基电池(NaS液流电池、钠离子电池)
- 按连线类型
- 併网(公用事业互联)
- 离网(微电网、混合电网)
- 按组件
- 电池组和支架
- 电源转换系统(PCS)
- 能源管理软体(EMS)
- 工厂平衡和服务
- 按能量容量范围
- 小于100兆瓦时
- 101~500 MWh
- 超过500兆瓦时
- 透过最终用户使用
- 住宅
- 商业和工业
- 公用事业
- 按地区
- 北美洲
- 美国
- 加拿大
- 墨西哥
- 欧洲
- 英国
- 德国
- 法国
- 西班牙
- 北欧国家
- 俄罗斯
- 其他欧洲地区
- 亚太地区
- 中国
- 印度
- 日本
- 韩国
- 马来西亚
- 泰国
- 印尼
- 越南
- 澳洲
- 亚太其他地区
- 南美洲
- 巴西
- 阿根廷
- 哥伦比亚
- 其他南美洲
- 中东和非洲
- 阿拉伯聯合大公国
- 沙乌地阿拉伯
- 南非
- 埃及
- 其他中东和非洲地区
- 北美洲
第六章 竞争情势
- 市场集中度
- 策略性倡议(併购、伙伴关係、购电协议)
- 市场占有率分析(主要企业的市场排名/份额)
- 公司简介
- BYD Company Limited
- Contemporary Amperex Technology Co. Ltd.(CATL)
- LG Energy Solution Ltd.
- Panasonic Holdings Corp.
- Tesla Inc.
- Samsung SDI Co. Ltd.
- Fluence Energy Inc.
- ABB Ltd.
- Siemens Energy AG
- GE Vernova
- Hitachi Energy Ltd.
- Mitsubishi Power
- Sungrow Power Supply Co.
- Eaton Corporation plc
- Toshiba Corp.
- EVE Energy Co.
- VARTA AG
- Saft SAS(TotalEnergies)
- CellCube Energy Storage Systems Inc.
- Enphase Energy Inc.
第七章 市场机会与未来展望
The Battery Energy Storage System Market size is estimated at USD 76.69 billion in 2025, and is expected to reach USD 172.17 billion by 2030, at a CAGR of 17.56% during the forecast period (2025-2030).
Rapid cost declines in lithium-ion cells, supportive procurement mandates, and rising grid-modernization spending are turning large-scale storage from a niche reliability tool into mainstream infrastructure. Policy tailwinds such as the Inflation Reduction Act in the United States and the Net-Zero Industry Act in the European Union have anchored multi-gigawatt project pipelines, while grid-forming inverter requirements are expanding revenue streams beyond energy arbitrage. Simultaneously, price parity for solar-plus-storage power purchase agreements (PPAs) in Australia and Chile proves that four-hour batteries can offer firm, evening-peak supply at competitive rates. Growing data-center electricity demand and politically driven supply-chain reshoring further reinforce the sector's momentum.
Global Battery Energy Storage System (BESS) Market Trends and Insights
Utility-scale procurement mandates in the United States, China, and the European Union
Mandated procurements are reshaping the development landscape. California's long-duration solicitation targets 2 GW, Power China tender seeks 16 GWh, and South Korea awarded 540 MW/3,240 MWh, giving developers visibility on revenue and bankability. In Europe, the Net-Zero Industry Act incentivizes domestic content, while recent Chinese reforms removed rigid allocation rules, letting market fundamentals guide economics. Such programs lower financing costs and channel volume to qualified integrators who meet grid-service performance guarantees.
Grid-forming inverter adoption unlocking co-location value
Moving from grid-following to grid-forming architectures lets batteries deliver synthetic inertia and voltage support, services that grid operators historically procured from synchronous generation. Transgrid's study showing 4.8 GW of grid-forming needs and Fluence's 300 MW Australian project highlight commercial viability. European operator TenneT foresees 5.2-12.7 GW storage by 2030, underscoring broad applicability. Added revenue from inertia products and strengthened interconnection terms improve project economics and favor hybrid solar-storage development.
Lithium and graphite processing bottlenecks
China processes 90% of global graphite, and Indonesia's nickel export bans push domestic refining, introducing concentration risk. Material shortages threaten cell production just as multi-gigawatt auctions surge. Start-ups such as Group14 are piloting silicon-rich anodes, but commercial volumes remain years away. Recycling programs can ease primary demand, yet logistic hurdles limit immediate impact for utility-scale projects that require high-purity inputs.
Other drivers and restraints analyzed in the detailed report include:
- PV-plus-storage PPA price parity in Australia and Chile
- EU and US supply-chain acts catalyzing domestic manufacturing
- Fire-safety code tightening under UL-9540A and NFPA-855
For complete list of drivers and restraints, kindly check the Table Of Contents.
Segment Analysis
Lithium-ion maintained 88.6% battery energy storage system market share in 2024. Yet LFP's cost and thermal-stability advantages drive its 19% CAGR, exemplified by BYD's 40 GWh 2024 installations. NMC chemistries remain relevant where energy density matters, while vanadium flow and sodium-ion technologies attract niche interest for long-duration or high-cycle use. Lithium-ion variants' battery energy storage system market size is projected to widen as scaling lowers per-kilowatt-hour costs. Diversification across chemistries reduces supply-chain risk and opens project financing to asset-specific hedging structures.
Implementation tactics vary by region. Chinese players offer ultra-low-priced LFP racks, European utilities test sodium-ion for cold-weather resilience, and U.S. grid operators pilot zinc-bromine flow batteries for eight-hour services. These parallel pathways illustrate how chemistry choice is increasingly optimized for duty cycle rather than a one-size-fits-all paradigm.
On-grid systems captured 78% of 2024 deployments, supported by standardized interconnection and robust merchant revenue opportunities. The off-grid segment, however, is accelerating at 18.5% CAGR owing to rural electrification and industrial resilience requirements. Pakistan's import projection of 8.75 GWh by 2030 typifies emerging-market demand for microgrids that bypass weak national infrastructure.
Hybrid configurations that switch between grid and islanded mode are a rising subset, offering customers demand-charge reduction plus backup power. These flexible assets partake in wholesale markets through virtual-power-plant aggregation, a trend now codified in several U.S. independent system operators' tariff updates.
The Battery Energy Storage System (BESS) Market Report is Segmented Into Battery Type (Lithium-Ion, Lithium Iron Phosphate, and Others), Connection Type (On-Grid and Off-Grid), Components (Battery Pack and Racks, Power Conversion System, and Others), Energy Capacity Range (Below 100 MWh, and Others), End-User Application (Utility, Residential, and Others), and Geography (North America, Europe, Asia-Pacific, and Others).
Geography Analysis
Asia-Pacific retained a 50.4% share in 2024, powered by China's 70 million kW installed base that doubled yearly. India reached an inflection point with SECI's 1 GW/2 GWh auction, and Japan's 1.67 GW capacity-market awards validated storage's role in capacity adequacy. South Korea advanced a 540 MW tender, and LG Energy Solution exported multi-GWh systems to Europe and Japan, underscoring the region's manufacturing clout.
The Middle East and Africa are the fastest-growing regions at 19.5% CAGR. Saudi Arabia's 7.8 GW partnership with Sungrow and Egypt's 200 MWh AfDB-financed project illustrate large-scale commitments. South Africa's 1 GW awards highlight how storage addresses chronic grid instability. Moreover, the United Arab Emirates integrates 19 GWh with a 5.2 GW solar plant, pioneering baseload renewables in desert climates.
North America and Europe continue to post high absolute volumes. The United States hosts USD 100 billion in announced investments but suffers four-year interconnection queues for 2,600 GW of projects. Europe's Net-Zero Industry Act seeks to localize supply chains, yet over half of announced gigafactories face financing delays. Regional policy diversity-capacity markets in the United Kingdom, fleet mandates in Italy, and production credits in Canada-produces a mosaic of revenue models that sophisticated developers arbitrage.
- BYD Company Limited
- Contemporary Amperex Technology Co. Ltd. (CATL)
- LG Energy Solution Ltd.
- Panasonic Holdings Corp.
- Tesla Inc.
- Samsung SDI Co. Ltd.
- Fluence Energy Inc.
- ABB Ltd.
- Siemens Energy AG
- GE Vernova
- Hitachi Energy Ltd.
- Mitsubishi Power
- Sungrow Power Supply Co.
- Eaton Corporation plc
- Toshiba Corp.
- EVE Energy Co.
- VARTA AG
- Saft SAS (TotalEnergies)
- CellCube Energy Storage Systems Inc.
- Enphase Energy Inc.
Additional Benefits:
- The market estimate (ME) sheet in Excel format
- 3 months of analyst support
TABLE OF CONTENTS
1 Introduction
- 1.1 Study Assumptions & Methodology Scope
- 1.2 Market Definition
2 Research Methodology
3 Executive Summary
4 Market Landscape
- 4.1 Market Overview
- 4.2 Recent Trends & Innovations
- 4.3 Market Drivers
- 4.3.1 Utility-Scale Procurement Mandates in U.S., China & EU Accelerating Gigawatt-Scale Orders
- 4.3.2 Grid-Forming Inverter Requirements Unlocking Co-Location Value Stacks
- 4.3.3 PV-Plus-Storage PPA Price Parity in Australia & Chile
- 4.3.4 EU & U.S. Battery Supply-Chain Acts Creating Domestic Manufacturing Pull-Through
- 4.3.5 Data-Center & AI Load Growth Driving 4-Hr Storage Demand in North America
- 4.3.6 Second-Life EV Battery Availability Reducing CapEx in Asia
- 4.4 Market Restraints
- 4.4.1 Lithium & Graphite Processing Bottlenecks in Indonesia and Africa
- 4.4.2 Fire-Safety Code Tightening (UL-9540A, NFPA-855) Inflating Balance-of-Plant Costs
- 4.4.3 Long Interconnection Queues in U.S. ISOs Delaying FTM Project Revenues
- 4.4.4 High Interest-Rate Environment Compressing Merchant Revenue Stacks
- 4.5 Supply-Chain Analysis
- 4.6 Regulatory and Policy Outlook
- 4.7 Technological Outlook
- 4.8 Porter's Five Forces
- 4.8.1 Bargaining Power of Suppliers
- 4.8.2 Bargaining Power of Buyers
- 4.8.3 Threat of New Entrants
- 4.8.4 Threat of Substitutes
- 4.8.5 Intensity of Competitive Rivalry
5 Market Size & Growth Forecasts
- 5.1 By Battery Type
- 5.1.1 Lithium-ion
- 5.1.2 Lithium Iron Phosphate (LFP)
- 5.1.3 Nickel-Manganese-Cobalt (NMC)
- 5.1.4 Lead-acid
- 5.1.5 Others [Flow Batteries (Vanadium, Zinc-Br), Sodium-based (NaS, Na-ion)]
- 5.2 By Connection Type
- 5.2.1 On-Grid (Utility Interconnected)
- 5.2.2 Off-Grid (Micro-Grid, Hybrid)
- 5.3 By Component
- 5.3.1 Battery Pack and Racks
- 5.3.2 Power Conversion System (PCS)
- 5.3.3 Energy Management Software (EMS)
- 5.3.4 Balance-of-Plant and Services
- 5.4 By Energy Capacity Range
- 5.4.1 Below 100 MWh
- 5.4.2 101 to 500 MWh
- 5.4.3 Above 500 MWh
- 5.5 By End-user Application
- 5.5.1 Residential
- 5.5.2 Commercial and Industrial
- 5.5.3 Utility
- 5.6 By Geography
- 5.6.1 North America
- 5.6.1.1 United States
- 5.6.1.2 Canada
- 5.6.1.3 Mexico
- 5.6.2 Europe
- 5.6.2.1 United Kingdom
- 5.6.2.2 Germany
- 5.6.2.3 France
- 5.6.2.4 Spain
- 5.6.2.5 Nordic Countries
- 5.6.2.6 Russia
- 5.6.2.7 Rest of Europe
- 5.6.3 Asia-Pacific
- 5.6.3.1 China
- 5.6.3.2 India
- 5.6.3.3 Japan
- 5.6.3.4 South Korea
- 5.6.3.5 Malaysia
- 5.6.3.6 Thailand
- 5.6.3.7 Indonesia
- 5.6.3.8 Vietnam
- 5.6.3.9 Australia
- 5.6.3.10 Rest of Asia-Pacific
- 5.6.4 South America
- 5.6.4.1 Brazil
- 5.6.4.2 Argentina
- 5.6.4.3 Colombia
- 5.6.4.4 Rest of South America
- 5.6.5 Middle East and Africa
- 5.6.5.1 United Arab Emirates
- 5.6.5.2 Saudi Arabia
- 5.6.5.3 South Africa
- 5.6.5.4 Egypt
- 5.6.5.5 Rest of Middle East and Africa
- 5.6.1 North America
6 Competitive Landscape
- 6.1 Market Concentration
- 6.2 Strategic Moves (M&A, Partnerships, PPAs)
- 6.3 Market Share Analysis (Market Rank/Share for key companies)
- 6.4 Company Profiles (includes Global level Overview, Market level overview, Core Segments, Financials as available, Strategic Information, Products & Services, and Recent Developments)
- 6.4.1 BYD Company Limited
- 6.4.2 Contemporary Amperex Technology Co. Ltd. (CATL)
- 6.4.3 LG Energy Solution Ltd.
- 6.4.4 Panasonic Holdings Corp.
- 6.4.5 Tesla Inc.
- 6.4.6 Samsung SDI Co. Ltd.
- 6.4.7 Fluence Energy Inc.
- 6.4.8 ABB Ltd.
- 6.4.9 Siemens Energy AG
- 6.4.10 GE Vernova
- 6.4.11 Hitachi Energy Ltd.
- 6.4.12 Mitsubishi Power
- 6.4.13 Sungrow Power Supply Co.
- 6.4.14 Eaton Corporation plc
- 6.4.15 Toshiba Corp.
- 6.4.16 EVE Energy Co.
- 6.4.17 VARTA AG
- 6.4.18 Saft SAS (TotalEnergies)
- 6.4.19 CellCube Energy Storage Systems Inc.
- 6.4.20 Enphase Energy Inc.
7 Market Opportunities & Future Outlook
- 7.1 White-space & Unmet-Need Assessment
 全球电池能源储存系统市场:按电池类型、应用、所有权/部署模式、连接方式、国家和地区划分-产业分析、市场规模、份额及预测(2025-2032年)
 全球电池能源储存系统市场规模、份额、趋势和成长分析报告(2026-2034年)
 2026年全球电池能源储存系统市场报告
 北美电池能源储存系统(BESS)-市场份额分析、产业趋势与统计、成长预测(2026-2031)
 电池储能係统市场-全球产业规模、份额、趋势、机会及预测(依电池类型、连接类型、能源容量、应用、区域及竞争格局划分,2021-2031年预测)
 电池能源储存系统市场规模、份额和趋势分析报告:按电池类型、应用领域、地区和细分市场预测(2026-2033 年)
 全球电池能源储存系统市场按电池类型、连接类型、所有权、能源容量、应用和地区划分-预测至2030年
 电池能源储存系统市场(按组件、电池类型、能量容量、连接类型、部署和应用)—2025-2030 年全球预测
 2025 年全球电池储能系统整合商排名报告2034年电池能源储存系统係统全球市场机会与策略