


 |
市场调查报告书
商品编码
1851867
雷射感测器:市场份额分析、行业趋势、统计数据和成长预测(2025-2030 年)Laser Sensor - Market Share Analysis, Industry Trends & Statistics, Growth Forecasts (2025 - 2030) |
||||||
※ 本网页内容可能与最新版本有所差异。详细情况请与我们联繫。
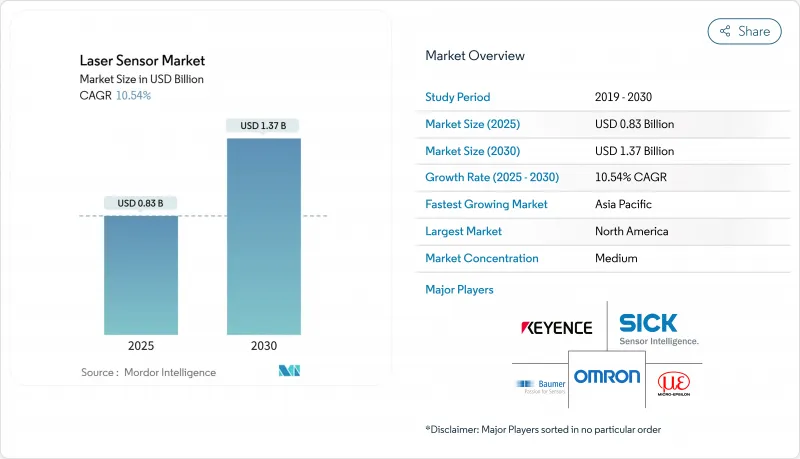
预计到 2025 年,雷射感测器市场规模将达到 8.3 亿美元,到 2030 年将达到 13.7 亿美元,复合年增长率为 10.54%。
随着工厂自动化测量任务的推进,对微米级精度要求日益提高,固体雷射雷达价格的下降为自动驾驶汽车、机器人和基础设施检测等领域带来了新的机会。欧洲基础设施计划强制使用数位双胞胎文檔,以及亚太地区对电动车电池生产线尺寸公差要求的提高,都进一步推动了市场成长。校准、预测性维护和分析等服务的成长速度超过了硬体销售,这表明感测器生态系统日益成熟,长期性能与感测器采购同等重要。
全球雷射感测器市场趋势与洞察
汽车电动车电池组装中的精密间隙闭合
在电动车电池生产线中,雷射位移感测器正在取代接触式测量仪,因为0.1毫米的尺寸误差可能导致电池容量减少高达5%。无散斑蓝光雷射系统可即时检测胶轮胎边缘和焊缝,从而减少废品和返工。亚洲电池製造商正在部署线上多感测器钻机,该装置可同时测量电池堆高度、极耳对齐情况和焊接熔深,从而缩短新化学系统的推出时间。
半导体封装领域3D AOI技术的激增
先进的封装技术采用高频宽晶片,对空隙或共面性缺陷零容忍。线扫描3D雷射感应器可侦测不平整表面上的5微米缺陷,并结合深度学习技术,将SinceVision的误剔率降低了40%。整合的多波长扫描头可减少反射性模塑化合物中的干扰,并可在节拍时间内完成全区域扫描。
高温铸造线的热漂移敏感性
由于半导体代工生产过程中极端温度变化和先进节点製造流程对精度的高要求,雷射位移感测器面临独特的挑战。专为严苛环境设计的碳化硅压力感测器展现了材料科学的进步,能够在-50 度C至600 度C的工作范围内保持满量程输出0.18%以内的精度,从而有效解决热稳定性问题。然而,由于光学元件的热膨胀和波长漂移,基于雷射的系统在代工环境中面临新的挑战,这些因素可能会影响测量精度。
细分市场分析
到2024年,硬体将占雷射感测器市场收入的82%,这将支撑全球生产线对高可靠性测距和位移感测器的持续需求。供应商正将多波长探头、温度稳定模组和M12连接器捆绑销售,以降低整合难度。同时,用户正在缩短重新校准週期以符合ISO9001审核,促使第三方实验室和OEM现场团队将设备认证频率从每年两次改为每季一次。
到2030年,服务业的复合年增长率将达到12.5%,因为一级供应商签署了多年校准和预测性维护合同,以确保感测器在其使用寿命内达到±2µm的性能。新型插件将混合雷射雷达探头连接到企业级品质平台,使漂移异常能够在几分钟内显示在统计过程控制仪表板上。随着越来越多的中型企业将计量专业知识外包,经常性收入正在平抑资本支出週期性波动,并重塑竞争格局。
到2024年,测距设备将维持30%的雷射感测器市场份额,这主要得益于自动门、输送机侦测和基本零件定位等应用。然而,3D轮廓测量单元将以14%的复合年增长率增长,因为它们能够绘製复杂形状的轮廓,使电子装配商能够测量焊料凸起,汽车生产线能够在不中断生产流程的情况下检测焊点。
机械製造商正将轮廓加工头直接整合到机器人控制器中,从而实现同步刀具路径修正,减少20%的废品。在安全至关重要的电动车电池生产中,用于位移建模的雷射感测器市场也将成长,因为电池厚度检验的公差必须控制在5微米或更小。振动和能量感测器将在结构健康监测中继续发挥其独特作用,而三角测量法在光线散射可预测的哑光錶面上仍将广泛应用。
区域分析
在北美,高昂的人事费用和成熟的安全标准推动了自动化技术的快速发展。仓库用雷射测距感测器取代超音波模组后,精度提高了50倍,货位利用率也得到了提升,并节省了15%的占地面积,从而形成了一个促进机器人投资的良性循环。监管方面的考量,特别是与加拿大新排放法规相关的问题,迫使企业儘早采取措施以符合规定,这虽然延缓了中小企业进入自动化领域的步伐,但最终提升了整体解决方案的品质。
亚太地区在雷射感测器市场销售方面领先,这主要得益于电动车电池、电子产品和通用製造业丛集的推动。预计到2025年,该地区在光电领域的投资将达到50亿美元,从而建立一个能够缩短前置作业时间并促进应用特定设计组件的奖励系统。中国、日本和韩国共同引领线上计量技术的应用,而东南亚则以与工业4.0相关的激励措施吸引产能扩张。
欧洲凭藉其强大的汽车工程实力数位双胞胎基础设施策略,继续保持市场主导地位。固态雷射雷达成本的下降将加速德国和斯堪地那维亚工厂采用自动导引车(AGV),而强大的机器视觉供应链预计将推动其收入在2025年前实现8-9%的成长。统一的安全标准将促使供应商在互锁外壳和故障安全电路方面进行创新,从而确保其在全部区域的市场进入。
其他福利:
- Excel格式的市场预测(ME)表
- 3个月的分析师支持
目录
第一章 引言
- 研究假设和市场定义
- 调查范围
第二章调查方法
第三章执行摘要
第四章 市场情势
- 市场概览
- 市场驱动因素
- 亚洲汽车电动车电池的精密间隙闭合推动了雷射位移感测器的应用
- 3D AOI 用于半导体封装突波检测,推广 3D 线雷射感测器
- 北美智慧仓库从超音波感测器向雷射测距感测器的过渡
- 固体光达成本下降,推动欧洲自动导引车采用飞行时间感测器
- 欧盟基础设施计划强制数位双胞胎文件製度促进了远距剖面感测器的应用。
- 医疗设备製造中无尘室非接触式测量标准
- 市场限制
- 高温抛投线的热漂移敏感性
- 3B类和4类动力排放的监理限值
- 来自CMOS ToF相机替代品的价格压力
- 高反射表面上的讯号杂讯
- 价值/供应链分析
- 技术展望
- 波特五力分析
- 新进入者的威胁
- 买方的议价能力
- 供应商的议价能力
- 替代品的威胁
- 竞争对手之间的竞争
第五章 市场规模与成长预测
- 按组件
- 硬体
- 软体
- 服务
- 依感测器类型
- 距离/范围感测器
- 位移感测器
- 轮廓/线感应器
- 振动和能量感测器
- 三角测量感测器
- 其他的
- 按测量范围
- 小于100毫米(短程)
- 100-300 毫米(中型范围)
- 300毫米或以上(远射程)
- 透过输出
- 小于1毫瓦
- 1-100 mW
- 101-500 mW
- 500毫瓦或以上
- 按尺寸
- 一维单点感测器
- 二维面积感测器
- 3D轮廓感测器
- 按最终用户行业划分
- 电子製造
- 汽车与出行
- 航太
- 建筑/施工
- 医疗保健和医疗设备
- 食品/饮料加工
- 物流、仓储管理与机器人技术
- 其他行业
- 按地区
- 北美洲
- 美国
- 加拿大
- 墨西哥
- 欧洲
- 英国
- 德国
- 法国
- 义大利
- 其他欧洲地区
- 亚太地区
- 中国
- 日本
- 印度
- 韩国
- 亚太其他地区
- 中东
- 以色列
- 沙乌地阿拉伯
- 阿拉伯聯合大公国
- 土耳其
- 其他中东地区
- 非洲
- 南非
- 埃及
- 其他非洲地区
- 南美洲
- 巴西
- 阿根廷
- 其他南美洲国家
- 北美洲
第六章 竞争情势
- 市场集中度
- 策略趋势
- 市占率分析
- 公司简介
- Keyence Corporation
- SICK AG
- OMRON Corporation
- Micro-Epsilon Messtechnik GmbH and Co. KG
- IFM Electronic GmbH
- Baumer Electric AG
- SmartRay GmbH
- Rockwell Automation Inc.
- Dimetix AG
- First Sensor AG(TE Connectivity)
- Banner Engineering Corp.
- Panasonic Industry Co.
- Cognex Corporation
- FARO Technologies Inc.
- Honeywell International Inc.
- Polytec GmbH
- OMS Corporation
- Teledyne DALSA
- Acuity Laser(Schmitt Measurement)
- Hokuyo Automatic Co. Ltd.
- Datalogic SpA
第七章 市场机会与未来展望
The laser sensor market size is valued at USD 0.83 billion in 2025 and is forecast to reach USD 1.37 billion by 2030 at a 10.54% CAGR.
Demand is rising as factories automate measurement tasks that require micron-level accuracy, while falling solid-state LiDAR prices open new opportunities in autonomous vehicles, robots and infrastructure inspection. Growth is reinforced by the mandatory use of digital twin documentation on European infrastructure projects and by Asia-Pacific's push to tighten dimensional tolerances in electric-vehicle (EV) battery lines. Service offerings around calibration, predictive maintenance and analytics are expanding faster than hardware sales, signalling a maturing ecosystem in which long-term performance matters as much as sensor procurement.
Global Laser Sensor Market Trends and Insights
Precision-gap closure in automotive EV battery assembly
Laser displacement sensors are replacing contact gauges on EV battery lines because 0.1 mm dimensional error can trim battery capacity by up to 5%. Speckle-free blue-laser systems now verify glue beads and weld seams in real time, cutting scrap and rework. Asian cell makers are installing in-line multi-sensor rigs that measure stack height, tab alignment and weld penetration simultaneously, shortening ramp-up times for new chemistries.
Surge in 3D AOI for semiconductor packaging
Advanced packages house high-bandwidth chips that cannot tolerate voids or coplanarity defects. Line-scan 3D laser sensors detect 5-micron faults on uneven surfaces and, when paired with deep learning, lower false-reject rates by 40% SinceVision. Integrated multi-wavelength heads reduce interference inside reflective molding compounds, enabling full-area scans within takt times.
Thermal drift sensitivity in high-temperature foundry lines
Semiconductor foundry operations present unique challenges for laser displacement sensors due to extreme temperature variations and the precision requirements of advanced node production processes. Silicon carbide pressure sensors designed for harsh environments demonstrate the material science advances needed to address thermal stability, with operational ranges extending from -50°C to 600°C while maintaining accuracy within 0.18% full-scale output. However, laser-based systems face additional challenges from thermal expansion of optical components and wavelength drift that can compromise measurement accuracy in foundry environments.
Other drivers and restraints analyzed in the detailed report include:
- Migration from ultrasonic to laser range sensors in smart warehousing
- Solid-state LiDAR cost decline enabling ToF sensors in European AGVs
- Regulatory restrictions on Class 3B & 4 power emissions
For complete list of drivers and restraints, kindly check the Table Of Contents.
Segment Analysis
Hardware dominated the laser sensor market size with an 82% revenue share in 2024, anchored by continued demand for ruggedized distance and displacement units on global production lines. Vendors are bundling multi-wavelength heads, temperature stabilization modules and M12 connectors to reduce integration effort. At the same time, users are tightening recalibration intervals to meet ISO 9001 audits, pushing third-party labs and OEM field teams to certify equipment four times per year rather than twice.
Services post a 12.5% CAGR to 2030 as tier-one suppliers lock in multi-year calibration and predictive-maintenance contracts that guarantee +-2 µm performance across sensor lifespan. Software sales ride this wave; new plug-ins link hybrid LADAR heads to enterprise quality-platforms, allowing statistical-process-control dashboards to surface drift anomalies within minutes. As more mid-cap firms outsource metrology expertise, recurring revenue smooths the cyclicality of capital expenditure, reshaping competitive priorities within the laser sensor market.
Distance and range devices retained a 30% laser sensor market share in 2024, underpinned by automatic doors, conveyor presence checks and basic part positioning. Yet 3D profile units expand at 14% CAGR because they map complex geometries, letting electronics assemblers measure solder bulges and automotive lines inspect weld nuggets without halting flow.
Machine builders integrate profile heads directly with robot controllers, enabling synchronous toolpath corrections that cut scrap by 20%. The laser sensor market size for displacement models also rises in safety-critical EV battery production, where thickness verification must stay below 5 µm tolerance. Vibration and energy sensors preserve niche roles in structural-health monitoring, while triangulation remains common on matte surfaces that scatter light predictably.
The Laser Sensors Market Report is Segmented by Component (Hardware, Software, Services), Sensor Type (Distance/Range, Displacement, Profiling, and More), Measurement Range (Less Than 100 Mm, 100 - 300 Mm, and More), Power Output (Less Than 1mW, 1 - 100mW, and More), Dimensionality (1D, 2D, 3D), End-User Industry (Electronics, Automotive, and More), and Geography. The Market Forecasts are Provided in Terms of Value (USD).
Geography Analysis
North America adopts automation quickly, aided by high labor costs and mature safety standards. Warehouses replacing ultrasonic modules with laser range sensors achieve 50 X accuracy gains and slot utilization improvements that free 15% floor space, supporting a virtuous cycle of robotics investment. Regulatory vigilance, highlighted by new Canadian emission rules, forces early compliance spending that can slow smaller entrants but ultimately raises average solution quality.
Asia-Pacific leads the laser sensor market on volume, propelled by EV battery, electronics and general manufacturing clusters. Regional photonics investment is reaching USD 5 billion by 2025, nurturing component ecosystems that shorten lead times and encourage application-specific designs. China, Japan and South Korea jointly spearhead in-line metrology adoption, while Southeast Asia lures capacity expansions with incentives linked to Industry 4.0 readiness.
Europe remains influential due to automotive engineering strength and infrastructure digital-twin mandates. Falling solid-state LiDAR costs accelerate AGV deployments in German and Scandinavian plants, and a robust machine-vision supply chain forecasts 8-9% revenue growth for 2025. Harmonized safety codes push vendors to innovate around interlocked housings and fail-safe circuits, preserving market access across the region.
- Keyence Corporation
- SICK AG
- OMRON Corporation
- Micro-Epsilon Messtechnik GmbH and Co. KG
- IFM Electronic GmbH
- Baumer Electric AG
- SmartRay GmbH
- Rockwell Automation Inc.
- Dimetix AG
- First Sensor AG (TE Connectivity)
- Banner Engineering Corp.
- Panasonic Industry Co.
- Cognex Corporation
- FARO Technologies Inc.
- Honeywell International Inc.
- Polytec GmbH
- OMS Corporation
- Teledyne DALSA
- Acuity Laser (Schmitt Measurement)
- Hokuyo Automatic Co. Ltd.
- Datalogic S.p.A.
Additional Benefits:
- The market estimate (ME) sheet in Excel format
- 3 months of analyst support
TABLE OF CONTENTS
1 INTRODUCTION
- 1.1 Study Assumptions and Market Definition
- 1.2 Scope of the Study
2 RESEARCH METHODOLOGY
3 EXECUTIVE SUMMARY
4 MARKET LANDSCAPE
- 4.1 Market Overview
- 4.2 Market Drivers
- 4.2.1 Precision-Gap Closure in Automotive EV Battery Assembly Driving Laser Displacement Sensors Adoption in Asia
- 4.2.2 Surge in 3D AOI for Semiconductor Packaging Boosting 3D Line Laser Sensor
- 4.2.3 Migration from Ultrasonic to Laser Range Sensors in Smart Warehousing in North America
- 4.2.4 Solid-State LiDAR Cost Decline Enabling ToF Sensors in European AGVs
- 4.2.5 Mandatory Digital Twin Documentation in EU Infrastructure Projects Fueling Long-Range Profiling Sensors
- 4.2.6 Clean-room Non-Contact Gauging Standards in Medical Device Manufacturing
- 4.3 Market Restraints
- 4.3.1 Thermal Drift Sensitivity in High-Temperature Foundry Lines
- 4.3.2 Regulatory Restrictions on Class 3B and 4 Power Emissions
- 4.3.3 Price Pressure from CMOS ToF Camera Alternatives
- 4.3.4 Signal Noise on Highly Reflective Surfaces
- 4.4 Value / Supply-Chain Analysis
- 4.5 Technological Outlook
- 4.6 Porter's Five Forces Analysis
- 4.6.1 Threat of New Entrants
- 4.6.2 Bargaining Power of Buyers
- 4.6.3 Bargaining Power of Suppliers
- 4.6.4 Threat of Substitutes
- 4.6.5 Intensity of Competitive Rivalry
5 MARKET SIZE AND GROWTH FORECASTS (VALUE)
- 5.1 By Component
- 5.1.1 Hardware
- 5.1.2 Software
- 5.1.3 Services
- 5.2 By Sensor Type
- 5.2.1 Distance / Range Sensors
- 5.2.2 Displacement Sensors
- 5.2.3 Profiling / Line Sensors
- 5.2.4 Vibration and Energy Sensors
- 5.2.5 Triangulation Sensors
- 5.2.6 Others
- 5.3 By Measurement Range
- 5.3.1 Less than 100 mm (Short-Range)
- 5.3.2 100 - 300 mm (Medium-Range)
- 5.3.3 Greater than 300 mm (Long-Range)
- 5.4 By Power Output
- 5.4.1 Less than 1 mW
- 5.4.2 1 - 100 mW
- 5.4.3 101 - 500 mW
- 5.4.4 Greater than 500 mW
- 5.5 By Dimensionality (Volume)
- 5.5.1 1D Point Sensors
- 5.5.2 2D Area Sensors
- 5.5.3 3D Profile Sensors
- 5.6 By End-user Industry
- 5.6.1 Electronics Manufacturing
- 5.6.2 Automotive and Mobility
- 5.6.3 Aerospace and Aviation
- 5.6.4 Building and Construction
- 5.6.5 Healthcare and Medical Devices
- 5.6.6 Food and Beverage Processing
- 5.6.7 Logistics, Warehousing and Robotics
- 5.6.8 Other Industries
- 5.7 By Geography
- 5.7.1 North America
- 5.7.1.1 United States
- 5.7.1.2 Canada
- 5.7.1.3 Mexico
- 5.7.2 Europe
- 5.7.2.1 United Kingdom
- 5.7.2.2 Germany
- 5.7.2.3 France
- 5.7.2.4 Italy
- 5.7.2.5 Rest of Europe
- 5.7.3 Asia-Pacific
- 5.7.3.1 China
- 5.7.3.2 Japan
- 5.7.3.3 India
- 5.7.3.4 South Korea
- 5.7.3.5 Rest of Asia-Pacific
- 5.7.4 Middle East
- 5.7.4.1 Israel
- 5.7.4.2 Saudi Arabia
- 5.7.4.3 United Arab Emirates
- 5.7.4.4 Turkey
- 5.7.4.5 Rest of Middle East
- 5.7.5 Africa
- 5.7.5.1 South Africa
- 5.7.5.2 Egypt
- 5.7.5.3 Rest of Africa
- 5.7.6 South America
- 5.7.6.1 Brazil
- 5.7.6.2 Argentina
- 5.7.6.3 Rest of South America
- 5.7.1 North America
6 COMPETITIVE LANDSCAPE
- 6.1 Market Concentration
- 6.2 Strategic Moves
- 6.3 Market Share Analysis
- 6.4 Company Profiles (includes Global-level Overview, Market-level Overview, Core Segments, Financials as available, Strategic Information, Market Rank/Share, Products and Services, Recent Developments)
- 6.4.1 Keyence Corporation
- 6.4.2 SICK AG
- 6.4.3 OMRON Corporation
- 6.4.4 Micro-Epsilon Messtechnik GmbH and Co. KG
- 6.4.5 IFM Electronic GmbH
- 6.4.6 Baumer Electric AG
- 6.4.7 SmartRay GmbH
- 6.4.8 Rockwell Automation Inc.
- 6.4.9 Dimetix AG
- 6.4.10 First Sensor AG (TE Connectivity)
- 6.4.11 Banner Engineering Corp.
- 6.4.12 Panasonic Industry Co.
- 6.4.13 Cognex Corporation
- 6.4.14 FARO Technologies Inc.
- 6.4.15 Honeywell International Inc.
- 6.4.16 Polytec GmbH
- 6.4.17 OMS Corporation
- 6.4.18 Teledyne DALSA
- 6.4.19 Acuity Laser (Schmitt Measurement)
- 6.4.20 Hokuyo Automatic Co. Ltd.
- 6.4.21 Datalogic S.p.A.
7 MARKET OPPORTUNITIES AND FUTURE OUTLOOK
- 7.1 White-space and Unmet-need Assessment
 粉尘浓度感测器市场报告:趋势、预测和竞争分析(至2035年)车载颗粒物感测器市场报告:趋势、预测及竞争分析(至2035年)对射式雷射感测器市场报告:趋势、预测及竞争分析(至2035年)
 2026年全球道路轮廓雷射感测器市场报告
 工业雷射感测器市场:按雷射类型、检测原理、检测范围、应用、终端用户产业和销售管道划分-2026-2032年全球市场预测
 雷射感测器市场规模、份额、趋势和预测:按类型、组件、应用、最终用户和地区划分,2026-2034年汽车雷射粉尘感测器市场按车辆类型、雷射类型、电源类型、应用和最终用户划分,全球预测(2026-2032年)雷射粉尘浓度感测器市场(按产品类型、应用、最终用户、连接方式、部署方式、组件和销售管道),全球预测,2026-2032年
 雷射测距感测器市场分析及预测(至2035年):按类型、产品类型、技术、组件、应用、材质、最终用户、功能、安装类型和解决方案划分
 雷射感测器市场 - 全球产业规模、份额、趋势、机会及预测(按类型、组件、应用、产业、地区和竞争格局划分),2021-2031年