


 |
市场调查报告书
商品编码
1851873
乙酰丙酸:市场占有率分析、产业趋势、统计、成长预测(2025-2030)Levulinic Acid - Market Share Analysis, Industry Trends & Statistics, Growth Forecasts (2025 - 2030) |
||||||
※ 本网页内容可能与最新版本有所差异。详细情况请与我们联繫。
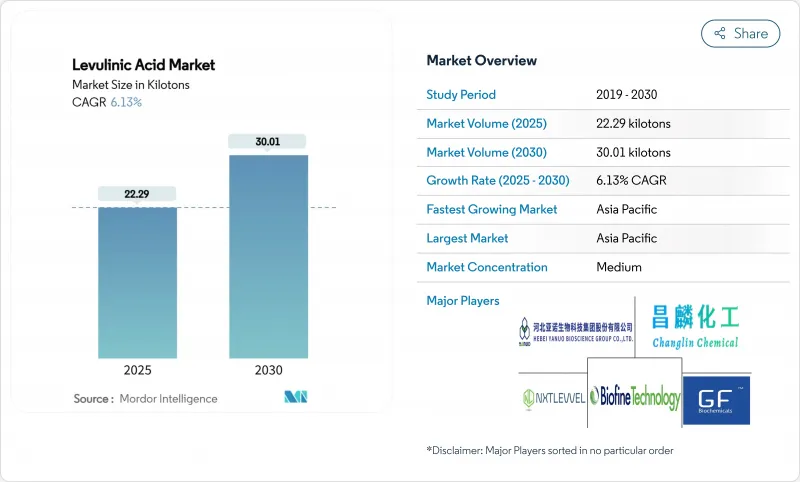
预计到 2025 年,乙酰丙酸市场规模将达到 22.29 千吨,到 2030 年将达到 30.01 千吨,在预测期(2025-2030 年)内复合年增长率为 6.13%。
随着欧盟「化学品永续性策略」和美国「联邦永续化学品计画」等监管计画敦促製造商采用有助于价值链脱碳的生物基中间体,市场对乙酰丙酸的需求正在增长。化妆品和个人护理用品仍然是乙酰丙酸最大的销售领域,因为它是一种天然来源的防腐剂,符合洁净标示的偏好。燃料和燃料添加剂製造商的采购量成长最快,因为该化合物支持永续航空燃料的γ-戊内酯合成途径。虽然酸水解技术仍然占据大部分产能,但酵素法和微生物法正在吸引新的投资,以降低单位成本并缓解催化剂惰性问题。亚太地区凭藉丰富的生物质资源、扶持政策和密集的化学品製造基地,在产量和成长率方面均保持领先地位,而义大利和北美的新计画则预示着乙酰丙酸市场产能的逐步扩张。
全球乙酰丙酸市场趋势及洞察
对生物基溶剂和塑化剂的需求日益增长
监管机构要求以其他增塑剂取代邻苯二甲酸酯类塑化剂的压力,正推动乙酰丙酸酯类增塑剂在聚合物薄膜和硬质包装领域的应用。近期测试表明,以20%(重量百分比)的乙酰丙酸酯类塑化剂取代传统的柠檬酸酯类增塑剂,可将聚乳酸的断裂伸长率提高至546%,在生物基含量更高的情况下,性能与传统增塑剂相当。欧盟化学品策略优先考虑在关键用途中使用生物基塑化剂,并鼓励品牌商指定使用乙酰丙酸衍生物。成熟的催化剂供应商已将酯化反应的能源需求降低了近20%,从而缩小了与石油基替代品的价格差距。消费品製造商的目标是到2030年实现至少25%的生物基原料使用率,并已签订远期采购承诺,以支持乙酰丙酸市场的新产能合约。
扩大乙酰丙酸衍生物作为低碳燃料添加剂的应用
将乙酰丙酸转化为γ-戊内酯,可为永续航空燃料(SAF)提供中间体,使综合生物炼製厂能够实现每加仑汽油当量3.15美元左右的损益平衡生产成本。 2024年开发的催化剂实现了2-甲基四氢呋喃87.6%的产率,可提高辛烷值并降低生命週期碳排放强度。 2023年,全球生质燃料消费量成长至1.07亿吨,投资额超过130亿美元。同时,航空业相关人员已承诺在2070年实现SAF 35%的渗透率,促使各方签订了乙酰丙酸衍生物的长期承购协议。目前,实验性酵素法路线已证明,在相同生物质投入下,前体产量可提高10倍,显示成本还有进一步降低的潜力。
高昂的生产成本和石油替代品
由于生物质产量有限且下游精炼环节资本密集,乙酰丙酸的价格仍高于现有的石化中间体。美国化工产业復苏乏力,预计2024年产量仅成长1.5%,限制了买家支付生物溢价的能力。在聚合物和溶剂领域,乙酰丙酸市场与大型裂解装置生产的原料竞争,而这些装置的资产折旧早已完成,进一步扩大了成本差距。酸水解装置的催化剂结垢增加了维护成本和停机时间,侵蚀了利润。因此,一些大宗用户正在推迟设备更换计划,直到第二代製程能够降低变动成本。
细分市场分析
酸水解法凭藉数十年的商业性经验和Biofine製程(理论收率达70-80%),在2024年仍维持着54.65%的乙酰丙酸市占率。目前大多数工厂使用稀硫酸将纤维素转化为中间糖,进而生产乙酰丙酸。然而,催化剂衰减和腐植质废弃物是持续的成本,会侵蚀净利率,尤其是在原料水分含量波动的情况下。新兴的酵素法和微生物法每单位生物质的前体收率可提高10倍,并降低公用设施需求,进而达到6.81%的复合年增长率。一家荷兰-加拿大新兴企业在2025年获得了B轮融资,用于扩大与纸浆厂副线连接的示范装置的规模。
酸水解企业正投资建造带有在线分离装置的连续流反应器,以缩短停留时间并减少腐殖质的积累;与此同时,相邻的催化加氢装置正在将内部生产的乙酰丙酸升级为γ-戊内酯和2-甲基四氢呋喃,以期作为直接替代燃料添加剂获取利润。儘管酶法路线仍面临酶成本和稳定性方面的挑战,但平台供应商报告称,在蛋白质工程取得突破后,酶用量已实现两位数的降低。这种技术组合反映了一个过渡时期:成熟製程确保了当前的产量,而生物技术创新则为乙酰丙酸市场指明了下一个生产力飞跃的方向。
乙酰丙酸市场报告按生产技术(酸水解、生物精工艺及其他)、等级(工业级、医药级、食品级)、终端用户行业(化妆品及个人护理、製药及其他)和地区(亚太、北美、欧洲、南美、中东和非洲)进行细分。市场预测以吨为单位。
区域分析
亚太地区在2024年占据了全球41.29%的市场份额,预计到2030年将以6.58%的复合年增长率增长,这主要得益于中国生物质盈余和碳中和目标的推动。省级政府补贴可涵盖生化计划高达30%的资本支出,刺激了山东和广西等地新建工厂。日本的生产计画将带动乙酰丙酸的联产,而印度(主要在古吉拉突邦)特种化学品产能的扩张则为下游产业注入了新的动力。区域供应限制将使价格保持坚挺,促使当地投资者缩短进口路线。
北美拥有成熟且充满机会的基础,联邦税额扣抵和贷款担保正在推动生物炼製厂的维修。加拿大的无污染燃料标准鼓励炼油商采用低碳原料,促进了源自乙酰丙酸的γ-戊内酯的采购。墨西哥韦拉克鲁斯化工产业丛集正将目光投向玉米秸秆这种价格低廉的原料,但物流和农作物残渣管理仍限制了其规模。随着生产商提高製程效率并确保生物质的长期销售,市场将呈现中等个位数的成长。
欧洲凭藉其严格的可持续化学品法规,在永续化学品领域占据了稳固的地位。目前,全球最大的单体乙酰丙酸装置已在义大利运作,年产量达1万吨,证明了工业可行性。欧盟的「Fit-for-55」计画正在加速推动对运输燃料和塑胶的需求,而「地平线欧洲」计画的津贴将用于催化剂研究,旨在降低成本,超越亚洲。巴西的甘蔗渣和南非的森林残余物提供了丰富的原料,但投资决策取决于政治稳定性以及开发利用这些地下资源生产乙酰丙酸的基础设施。
其他福利:
- Excel格式的市场预测(ME)表
- 3个月的分析师支持
目录
第一章 引言
- 研究假设和市场定义
- 调查范围
第二章调查方法
第三章执行摘要
第四章 市场情势
- 市场概览
- 市场驱动因素
- 对生物基溶剂和塑化剂的需求不断增长
- 扩大衍生性商品的使用
- 作为一种天然防腐剂,在化妆品和个人护理产品中的应用日益广泛。
- 扩大其作为传统肥料替代品的应用
- 与纸浆和造纸厂建立循环经济伙伴关係
- 市场限制
- 高昂的生产成本与石油替代品相比
- 商业规模生产能力有限
- 商业反应器中腐殖质累积导致催化剂失去活性。
- 价值链分析
- 波特五力模型
- 供应商的议价能力
- 买方的议价能力
- 新进入者的威胁
- 替代品的威胁
- 竞争程度
第五章 市场规模与成长预测
- 透过生产技术
- 酸水解
- 生物精工艺
- 催化氢化路线
- 新的生物技术途径
- 按年级
- 工业级
- 医药级
- 食品级
- 按最终用户行业划分
- 化妆品和个人护理
- 製药
- 聚合物和塑化剂
- 燃料和燃料添加剂
- 香味
- 其他终端用户产业(农业、化肥等)
- 按地区
- 亚太地区
- 中国
- 日本
- 印度
- 韩国
- 东南亚国协
- 亚太其他地区
- 北美洲
- 美国
- 加拿大
- 墨西哥
- 欧洲
- 德国
- 英国
- 法国
- 义大利
- 西班牙
- 俄罗斯
- 北欧国家
- 其他欧洲地区
- 南美洲
- 巴西
- 阿根廷
- 其他南美洲国家
- 中东和非洲
- 沙乌地阿拉伯
- 南非
- 其他中东和非洲地区
- 亚太地区
第六章 竞争情势
- 市场集中度
- 策略趋势
- 市占率(%)/排名分析
- 公司简介
- AK Scientific Inc.
- Avantium
- Biofine Technology, llc.
- GFBiochemicals
- GODAVARI BIOREFINERIES LTD.
- Hangzhou Aromalake Tech Co., Ltd.
- Hebei Yanuo Bioscience Group Co., Ltd
- LangFang Hawk Technology and Development Co,Ltd.
- Merck KGaA(Sigma-Aldrich)
- NXTLEVVEL Biochem
- Shandong Xinhua Pharma
- Thermo Fisher Scientific Inc.
- Tokyo Chemical Industry Co,. Ltd.
- Zibo Changlin Chemical Industry Co., Ltd.
第七章 市场机会与未来展望
The Levulinic Acid Market size is estimated at 22.29 kilotons in 2025, and is expected to reach 30.01 kilotons by 2030, at a CAGR of 6.13% during the forecast period (2025-2030).
Demand grows as regulatory programs such as the EU Chemicals Strategy for Sustainability and the US Federal Sustainable Chemistry Plan press manufacturers to adopt bio-based intermediates that help decarbonize value chains. Cosmetics and personal care remain the largest outlet because levulinic acid serves as a naturally sourced preservative that satisfies clean-label preferences. Fuel and fuel-additive manufacturers are scaling purchases fastest as the compound underpins gamma-valerolactone pathways for sustainable aviation fuel. Acid hydrolysis technology continues to dominate installed capacity, yet enzymatic and microbial routes are attracting new investment to cut unit costs and ease catalyst deactivation issues. Asia-Pacific keeps its lead on both volume and growth thanks to abundant biomass, supportive policy, and a dense chemical manufacturing base, while new projects in Italy and North America signal gradual capacity consolidation across the levulinic acid market.
Global Levulinic Acid Market Trends and Insights
Rising Demand for Bio-Based Solvents and Plasticizers
Regulatory pressure to replace phthalate plasticizers is propelling levulinic acid esters into polymer films and rigid packaging. Recent trials achieved 546% elongation at break in polylactic acid when 20 wt% levulinic acid ester replaced traditional citrate plasticizers, matching performance while raising bio-conetent. The EU Chemicals Strategy frames bio-based plasticizers as preferred under essential-use criteria, encouraging brand owners to specify levulinic acid derivatives. Established catalyst suppliers have lowered esterification energy demand by almost 20%, narrowing the price gap with petro-routes. Consumer packaged goods firms aim to lift bio-sourced inputs to at least 25% by 2030, creating forward purchasing commitments that anchor new capacity agreements across the levulinic acid market.
Growing Use of Levulinic Acid Derivatives as Low-Carbon Fuel Additives
Conversion of levulinic acid into gamma-valerolactone provides an intermediate for sustainable aviation fuel (SAF) that can reach breakeven production costs near USD 3.15 per gasoline-equivalent gallon in integrated biorefineries. Catalysts developed in 2024 delivered 87.6% yield of 2-methyltetrahydrofuran, a blending component that upgrades octane and lowers lifecycle carbon intensity. Global biofuel consumption rose to 107 Mtoe in 2023 and investments topped USD 13 billion, while aviation stakeholders pledge 35% SAF penetration by 2070, sharpening long-term offtake agreements for levulinic acid derivatives. Pilot enzymatic routes now claim a tenfold increase in precursor yield from identical biomass inputs, signalling further cost reduction potential.
High Production Cost versus Petro-Substitutes
Levulinic acid remains pricier than incumbent petrochemical intermediates because biomass yields are modest and downstream purification is capital intensive. Weak chemical sector recovery-US output grew only 1.5% in 2024-limits the capacity of buyers to pay bio-premiums. In polymers and solvents the levulinic acid market competes with raw materials produced at megascale crackers that long ago depreciated assets, widening the cost gap. Catalyst fouling in acid hydrolysis plants adds maintenance expense and downtime that erode margins. As a result, some bulk users defer substitution plans until second-generation processes deliver lower variable costs.
Other drivers and restraints analyzed in the detailed report include:
- Increasing Adoption in Cosmetics and Personal Care as Natural Preservative
- Increasing Usage as a Substitute in Traditional Fertilizers
- Limited Commercial-Scale Manufacturing Capacity
For complete list of drivers and restraints, kindly check the Table Of Contents.
Segment Analysis
Acid hydrolysis retained 54.65% share of the levulinic acid market in 2024 by leveraging decades of commercial experience and the Biofine process that attains 70-80% theoretical yield. Most current plants use dilute sulfuric acid to convert cellulose into intermediate sugars and then levulinic acid, a route viewed as low risk by investors. However, catalyst decay and humin disposal impose recurring costs that pressure margins, especially when feedstock moisture fluctuates. Emerging enzymatic and microbial methods post a 6.81% CAGR as developers showcase tenfold higher precursor yields per unit biomass and reduced utility demand. Start-ups in the Netherlands and Canada secured Series B funding in 2025 to scale demo units that bolt onto pulp-mill side streams, signaling confidence in biotechnological cost-down potential for the levulinic acid market.
Acid hydrolysis players are investing in continuous-flow reactors equipped with inline separation to cut residence time and limit humin buildup. Meanwhile, catalytic hydrogenation units next door upgrade in-house levulinic acid to gamma-valerolactone or 2-methyltetrahydrofuran, capturing margin in drop-in fuel additives. Enzymatic routes still face enzyme cost and stability hurdles, yet platform suppliers report double-digit reductions in enzyme loading after protein-engineering breakthroughs. The technology mix reflects a transition era where established processes secure present volumes while biotech innovation charts the next productivity leap for the levulinic acid market.
The Levulinic Acid Market Report is Segmented by Production Technology (Acid Hydrolysis, Biofine Process, and More), Grade (Industrial Grade, Pharma Grade, and Food Grade), End-User Industry (Cosmetics and Personal Care, Pharmaceuticals, and More), and Geography (Asia-Pacific, North America, Europe, South America, Middle East and Africa). The Market Forecasts are Provided in Terms of Volume (tons).
Geography Analysis
Asia-Pacific constitutes the demand epicenter at 41.29% volume share in 2024 and a projected 6.58% CAGR to 2030, supported by China's biomass surpluses and national carbon-neutrality targets. Provincial grants cover up to 30% of capital expenditure for bio-chemical projects, spurring new plants in Shandong and Guangxi. Japan's commercial woody-ethanol scheme underpins co-production of levulinic acid, while India's specialty-chemicals capacity expansion-notably in Gujarat-creates fresh downstream pull. Regional supply tightness keeps pricing firm, encouraging local investors to shorten import routes.
North America holds a mature yet opportunity-rich base where federal tax credits and loan guarantees spur biorefinery retrofits. Canada's Clean Fuel Standard compels refiners to adopt low-carbon feedstock, boosting contracts for gamma-valerolactone derived from levulinic acid. Mexican chemical clusters in Veracruz eye corn stover as an affordable feedstock, though logistics and agronomic residue management still limit scale. The market exhibits mid-single-digit growth as producers enhance process efficiency and secure long-term biomass offtake.
Europe preserves a strong foothold owing to rigorous sustainable-chemistry legislation. Italy hosts the world's largest single levulinic acid unit at 10,000 t/a, demonstrating industrial feasibility, while German and French firms pilot enzyme-enabled variants. The EU Fit-for-55 package accelerates demand in transport fuels and plastics, and Horizon Europe grants finance catalyst research that aims to outpace Asia on cost. South America and the Middle-East and Africa remain emerging pockets; Brazil's sugarcane bagasse and South Africa's forest residues present ample feedstock, yet investment decisions hinge on political stability and infrastructure to tap these reserves for the levulinic acid market.
- AK Scientific Inc.
- Avantium
- Biofine Technology, llc.
- GFBiochemicals
- GODAVARI BIOREFINERIES LTD.
- Hangzhou Aromalake Tech Co., Ltd.
- Hebei Yanuo Bioscience Group Co., Ltd
- LangFang Hawk Technology and Development Co,Ltd.
- Merck KGaA (Sigma-Aldrich)
- NXTLEVVEL Biochem
- Shandong Xinhua Pharma
- Thermo Fisher Scientific Inc.
- Tokyo Chemical Industry Co,. Ltd.
- Zibo Changlin Chemical Industry Co., Ltd.
Additional Benefits:
- The market estimate (ME) sheet in Excel format
- 3 months of analyst support
TABLE OF CONTENTS
1 Introduction
- 1.1 Study Assumptions and Market Definition
- 1.2 Scope of the Study
2 Research Methodology
3 Executive Summary
4 Market Landscape
- 4.1 Market Overview
- 4.2 Market Drivers
- 4.2.1 Rising Demand for Bio-Based Solvents and Plasticizers
- 4.2.2 Growing Use of Derivatives
- 4.2.3 Increasing Adoption in Cosmetics and Personal Care as Natural Preservative
- 4.2.4 Increasing Usage as a Substitute in Traditional Fertilizers
- 4.2.5 Circular-Economy Partnerships with Pulp and Paper Mills
- 4.3 Market Restraints
- 4.3.1 High Production Cost Vs Petro- Substitutes
- 4.3.2 Limited Commercial-Scale Manufacturing Capacity
- 4.3.3 Catalyst Deactivation from Humin Build-Up in Continuous Reactors
- 4.4 Value Chain Analysis
- 4.5 Porter's Five Forces
- 4.5.1 Bargaining Power of Suppliers
- 4.5.2 Bargaining Power of Buyers
- 4.5.3 Threat of New Entrants
- 4.5.4 Threat of Substitutes
- 4.5.5 Degree of Competition
5 Market Size and Growth Forecasts (Volume)
- 5.1 By Production Technology
- 5.1.1 Acid Hydrolysis
- 5.1.2 Biofine Process
- 5.1.3 Catalytic Hydrogenation Route
- 5.1.4 Emerging Biotechnological Routes
- 5.2 By Grade
- 5.2.1 Industrial Grade
- 5.2.2 Pharma Grade
- 5.2.3 Food Grade
- 5.3 By End-user Industry
- 5.3.1 Cosmetics and Personal Care
- 5.3.2 Pharmaceuticals
- 5.3.3 Polymers and Plasticizers
- 5.3.4 Fuel and Fuel Additives
- 5.3.5 Flavors and Fragrances
- 5.3.6 Other End-users Industries (Agriculture and Fertilizers, etc.)
- 5.4 By Geography
- 5.4.1 Asia-Pacific
- 5.4.1.1 China
- 5.4.1.2 Japan
- 5.4.1.3 India
- 5.4.1.4 South Korea
- 5.4.1.5 ASEAN Countries
- 5.4.1.6 Rest of Asia-Pacific
- 5.4.2 North America
- 5.4.2.1 United States
- 5.4.2.2 Canada
- 5.4.2.3 Mexico
- 5.4.3 Europe
- 5.4.3.1 Germany
- 5.4.3.2 United Kingdom
- 5.4.3.3 France
- 5.4.3.4 Italy
- 5.4.3.5 Spain
- 5.4.3.6 Russia
- 5.4.3.7 NORDIC Countries
- 5.4.3.8 Rest of Europe
- 5.4.4 South America
- 5.4.4.1 Brazil
- 5.4.4.2 Argentina
- 5.4.4.3 Rest of South America
- 5.4.5 Middle-East and Africa
- 5.4.5.1 Saudi Arabia
- 5.4.5.2 South Africa
- 5.4.5.3 Rest of Middle-East and Africa
- 5.4.1 Asia-Pacific
6 Competitive Landscape
- 6.1 Market Concentration
- 6.2 Strategic Moves
- 6.3 Market Share(%)/Ranking Analysis
- 6.4 Company Profiles (includes Global level Overview, Market level overview, Core Segments, Financials as available, Strategic Information, Market Rank/Share for key companies, Products and Services, and Recent Developments)
- 6.4.1 AK Scientific Inc.
- 6.4.2 Avantium
- 6.4.3 Biofine Technology, llc.
- 6.4.4 GFBiochemicals
- 6.4.5 GODAVARI BIOREFINERIES LTD.
- 6.4.6 Hangzhou Aromalake Tech Co., Ltd.
- 6.4.7 Hebei Yanuo Bioscience Group Co., Ltd
- 6.4.8 LangFang Hawk Technology and Development Co,Ltd.
- 6.4.9 Merck KGaA (Sigma-Aldrich)
- 6.4.10 NXTLEVVEL Biochem
- 6.4.11 Shandong Xinhua Pharma
- 6.4.12 Thermo Fisher Scientific Inc.
- 6.4.13 Tokyo Chemical Industry Co,. Ltd.
- 6.4.14 Zibo Changlin Chemical Industry Co., Ltd.
7 Market Opportunities and Future Outlook
- 7.1 White-space and Unmet-need Assessment
- 7.2 Growing Prevalence of Bio-based Levulinic Acid
 乙酰丙酸市场分析及预测(至2035年):类型、产品类型、应用、技术、最终用户、剂型、製程、功能
 全球乙酰丙酸市场规模、份额、趋势和成长分析报告(2026-2034年)
 乙酰丙酸市场规模、份额及成长分析(按生产流程、应用和地区划分)-2026-2033年产业预测
 2025-2033年乙酰丙酸市场报告,依技术(酸水解、生物精炼)、最终用途产业(农业、製药、食品、化妆品等)、形态(液体、固体)和地区划分
 乙酰丙酸乙酯市场规模、份额、成长分析、按製造流程、按物理状态、按纯度等级、按应用、按最终用户行业、按地区、按行业预测(2025-2032 年)乙酰丙酸市场:按技术、形式、应用和地区划分,2026 年至 2032 年
 乙酰丙酸乙酯市场规模、份额、趋势分析报告:按类型、应用、地区、细分市场预测,2025-2030 年