


 |
市场调查报告书
商品编码
1851897
渗透压计:市场占有率分析、产业趋势、统计、成长预测(2025-2030)Osmometers - Market Share Analysis, Industry Trends & Statistics, Growth Forecasts (2025 - 2030) |
||||||
※ 本网页内容可能与最新版本有所差异。详细情况请与我们联繫。
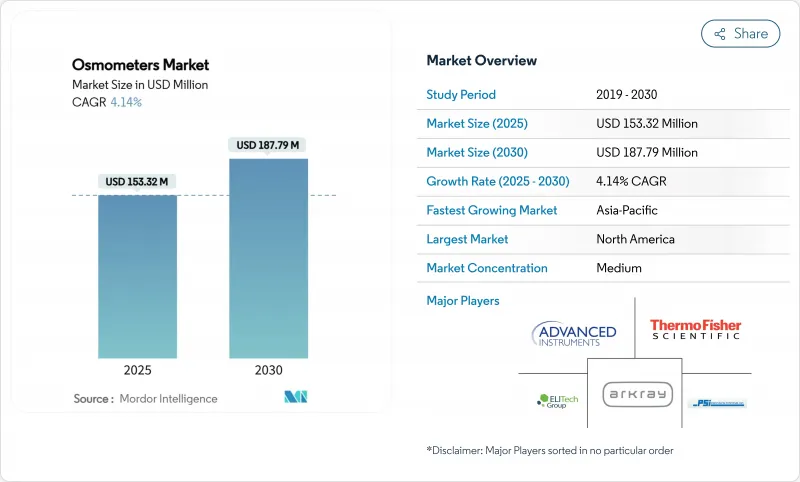
预计到 2025 年渗透压计市场规模将达到 1.5332 亿美元,到 2030 年将达到 1.8779 亿美元。
实验室自动化、更严格的合规规则以及生物製药向高浓度生技药品的转型正在推动市场需求,即便欧盟医疗设备法规 (EU MDR) 下的器械核准有所延长。诸如 Advanced Instruments 以 22 亿美元收购 Nova Biomedical 等策略整合,标誌着该产业正向能够应对复杂全球法规的整合分析平台转型。同时,欧盟新规要求製造商提前六个月向监管机构通报供应中断情况,这正在重塑所有主要供应商的风险管理策略。在北美,对临床基础设施的持续投资支撑着稳定的更换需求;而在亚太地区,现代化改造推动了高于平均水平的销售成长,并加剧了来自新型电阻式即时检测参与企业的竞争。
全球渗透压计市场趋势与洞察
技术进步和自动化
欧洲实验室正在采用全自动渗透压工作站,这些工作站可直接与液相层析质谱仪 (LC-MS)、化学分析仪和实验室资讯系统 (LIS) 连接,从而减少人工操作并最大限度地降低交叉污染的风险。北爱尔兰 CoreLIMS 的全县推广应用展示了无缝集成,使得即时渗透压数据能够传输至血库和微生物模组,从而提高了每天 1200 个样本点的可追溯性。供应商目前正在销售可在 60 秒内产生 HL7 格式结果的「连网」渗透压计。因此,渗透压计市场的平均售价因软体、网路安全更新和远距离诊断包等相关费用而上涨。虽然北美核心参考实验室的应用最为广泛,但欧盟各实验室正在透过区域资助的数位健康计画缩小差距。
研发成本上升及疾病负担加重
全球在先进疗法领域的研发投入正推动渗透压成为製程分析的核心。近期临床试验表明,当生产商在培养过程中及时调整渗透压时,腺结合病毒滴度可提高22%。欧盟成年人群中慢性肾臟病盛行率超过9%,促使人们需要依赖快速尿渗透压测量的分散式肾功能筛检。 Nova Biomedical公司获得CE认证的肌酸酐/eGFR检测仪可在两分钟内完成渗透压和肾臟标记的检测,使当地医生无需中心实验室支援即可对患者进行分诊。因此,高疾病负担正在扩大渗透压计市场的临床装置量,并促使采购标准转向兼具速度、分析深度和人体工学设计的设备。
固有精度/吞吐量限制
蛋白质浓度超过 150 mg/mL 时,冰点循环时间会超过 3 分钟,这会降低大型实验室的日处理量,而这些实验室每年已经进行 8 亿次检测。蒸气法仪器虽然能提高精度,但需要较长的平衡时间,这使得它们在 15 分钟内完成检测的快速检测台上几乎无法负担。这种权衡促使一些买家转向非接触式屈光感测器,从而蚕食了它们在快速响应细分市场的潜在份额。
细分市场分析
到2024年,冰点分析仪将占据渗透压计市场68.78%的份额,这得益于数十年的临床应用经验和明确的监管核准。电阻计目前在渗透压计市场中所占份额较小,但由于可携式设计适用于重症加护、透析和兽医应用,因此正以7.73%的复合年增长率增长。蒸气渗透压计则占据了高浓度生技药品这一细分市场,其高性能弥补了週期较长的不足。目前,製造商正将维护合约、远端韧体推送和自动校准功能捆绑销售,以使合规成本更易于预测。
技术更新反映了产业向互联互通和服务化方向发展的趋势。电阻分析仪现在对20微升或更小的样本即可达到95.5%的准确度,这对于新生儿筛检和动物健康至关重要,并且可以直接连接到支援蓝牙的患者应用程式。冰点分析仪领域的领先企业透过整合条码扫描器、试剂批次追溯和基于人工智慧的品管警报来应对这一趋势,从而减少不合格试剂的重复使用。蒸气分析仪供应商则专注于不銹钢湿润路径和符合美国联邦法规21 CFR Part 11的审核追踪,以吸引基因治疗合约研发生产机构(CDMO)。
至2024年,单样本分析仪将占渗透压计市场60.36%的份额。然而,多样检体分析仪正以8.12%的复合年增长率增长,它们配备了机器人装载抽屉和实验室资讯系统(LIS)接口,每小时最多可处理90个试管。因此,随着医院围绕模组化自动化重新设计其核心实验室,高通量分析仪的市场规模在预测期内应超过历史平均值。
欧洲一家医疗机构正在部署24个配备智慧型手机式触控萤幕的机架,使一名技术人员能够同时监控电解质、葡萄糖和渗透压测试。在乡村医疗中心,紧凑型单检体仪器仍在使用,但供应商正在对其进行升级,增加云端记录、简化品管和一键维护等功能。这种平衡的需求使得两类仪器之间形成了明显的差异,而吞吐量和连接性则提供了合适的解决方案。
区域分析
到2024年,北美将占据渗透压计市场37.77%的份额,稳定的报销政策和高检测量支撑着设备的稳定升级。该地区拥有数量最多的CLIA认证实验室,以及以製程分析技术为核心的密集生物製药产业走廊。亚太地区以7.98%的复合年增长率成长,受益于中国、印度和韩国不断扩大的全民健康保险、生技药品产能的积极扩张以及床边检测技术的日益普及。欧洲虽然受到监管瓶颈的限制,但正利用自动化技术的进步和强大的疫苗研发管线保持竞争力。中东和非洲仍在发展中,但医院建设项目和本地设备组装奖励的结合,正确保该地区实现两位数的成长。
新加坡、韩国和中国的政府补贴正在推动对符合美国联邦法规21 CFR Part 11标准的高通量设备的投资。欧盟医疗器材法规(EU MDR)漫长的认证週期将延缓部分产品的上市,但同时也为拥有预先公告机构策略的弹性供应商创造了空间。所有地区对能够压缩工作流程、统一资料流并降低总体拥有成本的平台的需求都在增长。
其他福利:
- Excel格式的市场预测(ME)表
- 3个月的分析师支持
目录
第一章 引言
- 研究假设和市场定义
- 调查范围
第二章调查方法
第三章执行摘要
第四章 市场情势
- 市场概览
- 市场驱动因素
- 技术进步和自动化
- 研发成本上升及疾病负担加重
- 生物製药向高浓度生技药品的转变
- 用于家庭肾臟护理的可携式电阻式设备
- 监管机构推动生产过程中渗透压测试。
- LIS在食品饮料工厂中的整合品质保证
- 市场限制
- 固有精度/吞吐量限制
- 熟练操作人员短缺
- 冰点感测器供应链风险
- 一种新的非接触式温度测量替代方案
- 价值/供应链分析
- 监管环境
- 技术展望
- 波特五力分析
- 供应商的议价能力
- 买方的议价能力
- 新进入者的威胁
- 替代品的威胁
- 竞争对手之间的竞争
第五章 市场规模与成长预测
- 依产品类型
- 冰点渗透压计
- 蒸气渗透压计
- 薄膜渗透压计
- 基于电阻的(其他)
- 按采样能力
- 单样品渗透压计
- 多样品渗透压计
- 透过使用
- 临床
- 製药和生物技术
- 工业和食品品质控制
- 研究与学术
- 最终用户
- 医院
- 诊断和实验室中心
- 生物製药製造商
- 研究所
- 按地区
- 北美洲
- 美国
- 加拿大
- 墨西哥
- 欧洲
- 德国
- 英国
- 法国
- 义大利
- 西班牙
- 其他欧洲地区
- 亚太地区
- 中国
- 日本
- 印度
- 澳洲
- 韩国
- 亚太其他地区
- 中东和非洲
- GCC
- 南非
- 其他中东和非洲地区
- 南美洲
- 巴西
- 阿根廷
- 其他南美洲国家
- 北美洲
第六章 竞争情势
- 市场集中度
- 市占率分析
- 公司简介
- Advanced Instruments LLC
- Precision Systems Inc.
- ELITech Group
- ARKRAY Inc.
- ASTORI TECNICA
- KNAUER Wissenschaftliche Gerate GmbH
- Loser Messtechnik
- SanoTec GmbH
- TearLab Corporation
- Mechatronics Instruments BV
- Gonotec GmbH
- Shanghai Medical Instruments Co.
- Labnics Equipment
- Thermo Fisher Scientific
- Beijing Hiyi Technology Co., Ltd.
- Merck KGaA
- Bio-Techne Corporation
- Anton Paar GmbH
- Precision Systems Science Co. Ltd.
第七章 市场机会与未来展望
The osmometers market reached USD 153.32 million in 2025 and is forecast to climb to USD 187.79 million by 2030, reflecting a steady 4.14% CAGR that signals a mature but opportunity-rich landscape.
Demand is buoyed by laboratory automation, stricter compliance rules and biopharma's tilt toward high-concentration biologics, even as device approvals take longer under the European Union Medical Device Regulation (EU MDR). Strategic combinations-such as Advanced Instruments' pending USD 2.2 billion purchase of Nova Biomedical-underline an industry pivot toward integrated analytical platforms able to navigate complex global regulations. Meanwhile, the new EU rule that forces manufacturers to pre-alert regulators six months before supply interruptions is reshaping risk-management playbooks for every major supplier. In North America, continued clinical infrastructure investment supports stable replacement demand, while Asia-Pacific's modernization push drives above-trend unit growth and fuels competition from impedance-based, point-of-care (POC) newcomers.
Global Osmometers Market Trends and Insights
Technological Advancements & Automation
European laboratories are adopting fully automated osmometry workcells that link directly with analytical LC-MS, chemistry analyzers and laboratory information systems, shrinking manual steps and minimizing cross-contamination risks. A province-wide CoreLIMS roll-out in Northern Ireland has shown how seamless integration allows real-time osmolality data to flow into blood-bank and microbiology modules, improving traceability across 1,200 sample points per day. Vendors now position "connected" osmometers that generate HL7-formatted results in under 60 seconds, a capability that resonates with hospitals chasing zero-waste, high-throughput operations. The osmometers market is thus witnessing higher average selling prices tied to software, cyber-security updates and remote diagnostics bundles. Adoption is sharpest in North America's core reference labs, but EU-based networks are narrowing the gap through region-funded digital health programs.
Growing R&D Spend & Disease Burden
Global R&D outlays in advanced therapies push osmolality to the front line of process analytics, with recent trials showing adeno-associated virus titers jump 22% when producers orchestrate timed osmolality shifts mid-culture. Chronic kidney disease prevalence, now topping 9% of the EU adult population, heightens need for decentralized kidney-function screens that depend on rapid urine osmometry. Nova Biomedical's CE-marked creatinine/eGFR meter pairs osmolarity and kidney markers in a two-minute test, enabling rural physicians to triage patients without central lab support. High disease burden therefore amplifies the osmometers market's clinical installed base and shifts procurement criteria toward devices that blend speed, analytical depth and ergonomic design.
Intrinsic Accuracy/Throughput Limits
Freezing-point cycles surpass three minutes when protein loads exceed 150 mg/mL, throttling daily capacity inside mega-labs that already run 800 million tests annually. Vapor-pressure devices improve accuracy but require long equilibration; thus they seldom slot into STAT benches where 15-minute turnaround is non-negotiable. This trade-off steers some buyers to non-contact refractive sensors, eroding addressable share in rapid-response niches.
Other drivers and restraints analyzed in the detailed report include:
- Biopharma Shift To High-Concentration Biologics
- Portable Impedance-Based Devices For Home Renal Care
- Shortage Of Skilled Operators
For complete list of drivers and restraints, kindly check the Table Of Contents.
Segment Analysis
Freezing point instruments retained 68.78% of 2024 osmometers market share, underpinned by decades of clinical trust and clear regulatory acceptance. Impedance systems, though only a fraction of today's osmometers market size, are growing at 7.73% CAGR thanks to portable designs that suit critical care, dialysis and veterinary applications. Vapor-pressure units occupy a narrow high-concentration biologics niche where their performance premium offsets slower cycle times. Manufacturers now bundle maintenance contracts, remote firmware pushes and auto-calibration features to keep compliance costs predictable.
Technology updates echo industry moves toward connectivity and service. Impedance devices achieve 95.5% accuracy with sub-20 µL samples-critical for newborn screening and animal health-and plug directly into Bluetooth-enabled patient apps, expanding the osmometers industry footprint in decentralized setting. Freezing-point leaders respond by embedding barcode scanners, reagent-lot traceability and AI-based quality control alerts that slash out-of-spec reruns. Vapor-pressure suppliers focus on stainless-steel wetted paths and 21 CFR Part 11 audit trails that attract gene-therapy CDMOs.
Single-sample analyzers held 60.36% of the osmometers market in 2024 as clinics and emergency rooms favored lower purchase prices and easy workflows. Yet multi-sample versions, climbing at 8.12% CAGR, now ship with robotic load drawers and LIS hubs that process up to 90 tubes per hour-features North American mega-labs deem essential for value-based reimbursement targets. The osmometers market size for high-throughput units should therefore outpace historical averages over the forecast as hospitals redesign core labs around modular automation.
European sites adopt 24-place racks with smartphone-style touchscreens, allowing one technologist to oversee parallel electrolyte, glucose and osmolality tests. In rural health centers, compact single-sample devices persist, but vendors refresh them with cloud logging, simplified QC and one-button maintenance. This balanced demand keeps both categories relevant yet sharply differentiated on throughput and connectivity.
The Osmometers Market Report is Segmented by Product Type (Freezing Point Osmometers, Vapor Pressure Osmometers, and More), Sampling Capacity (Single-Sample and Multi-Sample Osmometers), Application (Clinical, Pharmaceutical & Biotech, and More), End User (Hospitals, Diagnostic and Laboratory Centers, and More), and Geography (North America, Europe, Asia-Pacific, and More). The Market Forecasts are Provided in Terms of Value (USD).
Geography Analysis
North America kept 37.77% of global osmometers market share in 2024 as reimbursement stability and high test volumes underpinned steady upgrades. The region benefits from the deepest base of CLIA-certified labs and a dense biopharma corridor that values process analytical technology. Asia-Pacific, compounding at 7.98% CAGR, benefits from national health insurance expansions, aggressive biologics capacity build-outs and rising adoption of bedside testing in China, India and South Korea. Europe, while hampered by regulatory bottlenecks, leverages automation uptake and strong vaccine pipelines to maintain competitive parity. Middle East and Africa remain nascent but secure double-digit unit growth where hospital build programs pair with local device assembly incentives.
Government subsidies in Singapore, Korea and China tilt capex toward high-throughput, 21 CFR Part 11-ready osmometers that future-proof regulatory filings. EU MDR's protracted certification cycles delay some product launches, but also create white-space for nimble suppliers with pre-notified-body strategies. Across all regions, demand gravitates toward platforms that compress workflow, integrate data streams and reduce total cost of ownership.
- Advanced Instrumentations
- Precision Systems
- ELITech Group
- Arkray
- ASTORI TECNICA
- KNAUER Wissenschaftliche Gerate GmbH
- Loser Messtechnik
- SanoTec GmbH
- TearLab Corporation
- Mechatronics Instruments BV
- Gonotec GmbH
- Shanghai Medical Instruments Co.
- Labnics Equipment
- Thermo Fisher Scientific
- Beijing Hiyi Technology Co., Ltd.
- Merck
- Bio-Techne
- Anton Paar
- Precision Systems Science Co. Ltd.
Additional Benefits:
- The market estimate (ME) sheet in Excel format
- 3 months of analyst support
TABLE OF CONTENTS
1 Introduction
- 1.1 Study Assumptions and Market Definition
- 1.2 Scope of the Study
2 Research Methodology
3 Executive Summary
4 Market Landscape
- 4.1 Market Overview
- 4.2 Market Drivers
- 4.2.1 Technological Advancements & Automation
- 4.2.2 Growing R&D Spend & Disease Burden
- 4.2.3 Biopharma Shift To High-Concentration Biologics
- 4.2.4 Portable Impedance-Based Devices For Home Renal Care
- 4.2.5 Regulatory Push For In-Process Osmolality Testing
- 4.2.6 LIS-Integrated QA In Food & Beverage Plants
- 4.3 Market Restraints
- 4.3.1 Intrinsic Accuracy/Throughput Limits
- 4.3.2 Shortage Of Skilled Operators
- 4.3.3 Cryoscopic Sensor Supply-Chain Risks
- 4.3.4 Emerging Non-Contact T-Measurement Alternatives
- 4.4 Value / Supply-Chain Analysis
- 4.5 Regulatory Landscape
- 4.6 Technology Outlook
- 4.7 Porter's Five Forces Analysis
- 4.7.1 Bargaining Power of Suppliers
- 4.7.2 Bargaining Power of Buyers
- 4.7.3 Threat of New Entrants
- 4.7.4 Threat of Substitutes
- 4.7.5 Intensity of Competitive Rivalry
5 Market Size and Growth Forecasts (Value-USD)
- 5.1 By Product Type
- 5.1.1 Freezing Point Osmometers
- 5.1.2 Vapor Pressure Osmometers
- 5.1.3 Membrane Osmometers
- 5.1.4 Impedance-Based (Others)
- 5.2 By Sampling Capacity
- 5.2.1 Single-sample Osmometers
- 5.2.2 Multi-sample Osmometers
- 5.3 By Application
- 5.3.1 Clinical
- 5.3.2 Pharmaceutical & Biotech
- 5.3.3 Industrial & Food QC
- 5.3.4 Research & Academic
- 5.4 By End User
- 5.4.1 Hospitals
- 5.4.2 Diagnostic & Laboratory Centers
- 5.4.3 Biopharma Manufacturers
- 5.4.4 Research Institutes
- 5.5 By Geography
- 5.5.1 North America
- 5.5.1.1 United States
- 5.5.1.2 Canada
- 5.5.1.3 Mexico
- 5.5.2 Europe
- 5.5.2.1 Germany
- 5.5.2.2 United Kingdom
- 5.5.2.3 France
- 5.5.2.4 Italy
- 5.5.2.5 Spain
- 5.5.2.6 Rest of Europe
- 5.5.3 Asia-Pacific
- 5.5.3.1 China
- 5.5.3.2 Japan
- 5.5.3.3 India
- 5.5.3.4 Australia
- 5.5.3.5 South Korea
- 5.5.3.6 Rest of Asia-Pacific
- 5.5.4 Middle East and Africa
- 5.5.4.1 GCC
- 5.5.4.2 South Africa
- 5.5.4.3 Rest of Middle East and Africa
- 5.5.5 South America
- 5.5.5.1 Brazil
- 5.5.5.2 Argentina
- 5.5.5.3 Rest of South America
- 5.5.1 North America
6 Competitive Landscape
- 6.1 Market Concentration
- 6.2 Market Share Analysis
- 6.3 Company profiles (includes Global level Overview, Market level overview, Core Segments, Financials as available, Strategic Information, Market Rank/Share for key companies, Products and Services, and Recent Developments)
- 6.3.1 Advanced Instruments LLC
- 6.3.2 Precision Systems Inc.
- 6.3.3 ELITech Group
- 6.3.4 ARKRAY Inc.
- 6.3.5 ASTORI TECNICA
- 6.3.6 KNAUER Wissenschaftliche Gerate GmbH
- 6.3.7 Loser Messtechnik
- 6.3.8 SanoTec GmbH
- 6.3.9 TearLab Corporation
- 6.3.10 Mechatronics Instruments BV
- 6.3.11 Gonotec GmbH
- 6.3.12 Shanghai Medical Instruments Co.
- 6.3.13 Labnics Equipment
- 6.3.14 Thermo Fisher Scientific
- 6.3.15 Beijing Hiyi Technology Co., Ltd.
- 6.3.16 Merck KGaA
- 6.3.17 Bio-Techne Corporation
- 6.3.18 Anton Paar GmbH
- 6.3.19 Precision Systems Science Co. Ltd.
7 Market Opportunities & Future Outlook
- 7.1 White-space & Unmet-need Assessment


