


 |
市场调查报告书
商品编码
1852103
电容器:市场份额分析、行业趋势、统计数据和成长预测(2025-2030 年)Capacitor - Market Share Analysis, Industry Trends & Statistics, Growth Forecasts (2025 - 2030) |
||||||
※ 本网页内容可能与最新版本有所差异。详细情况请与我们联繫。
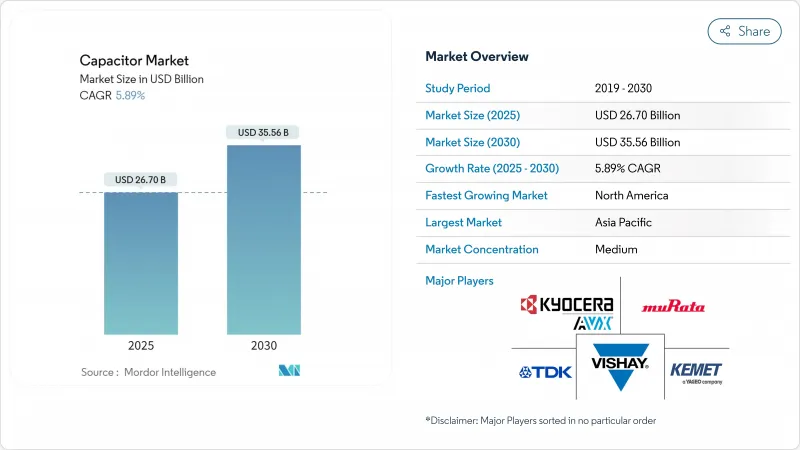
预计电容器市场规模将在 2025 年达到 267 亿美元,在 2030 年达到 355.6 亿美元,年复合成长率为 5.89%。
电动车、分散式能源和5G网路密集化的持续普及,构成了支撑产业成长前景的三大驱动力。陶瓷MLCC电容器凭藉其在宽温范围内优异的可靠性,将继续保持其在设计插座领域的领先地位;而随着公用事业公司试验混合储能拓扑结构,超级电容的收入增长速度将最快。人工智慧资料中心节点资本支出的活性化将进一步推动对超低ESR、高涟波电流电容器的需求,从而有效摆脱传统智慧型手机销售的季节性波动。对本地製造的同步投资将有助于降低地缘政治风险,并创造新的价格弹性需求,尤其是在北美电动车新兴企业。政策制定者的采购奖励将提高愿意透过在地化供应链来换取税额扣抵的企业的收入可见度。
全球电容器市场趋势与洞察
电动汽车电力电子技术的应用日益广泛
预计到2024年,电动车产量将达到1,730万辆,比前一年成长25%,这将直接推动牵引逆变器用高压薄膜电容器的需求成长。每辆纯电动车包含超过15,000个MLCC(多层陶瓷电容器),是传统燃油车型的四倍,而高阶800V动力系统则需要具有更高电压额定值和热稳定性的装置。获得AEC-Q200认证的电容器供应商已成功实施多年设计方案,以应对消费性电子产品的波动性。 TDK的100V、10µF、3225封装的MLCC就是一个很好的例子,它展示了产品蓝图如何在不增加封装尺寸的情况下扩展效能范围。这将导致每辆车的平均售价结构性成长,从而加强电气化与电容器市场之间的正向驱动力。
5G/FTTx的快速部署推动了对高频MLCC的需求
分析师预测,到2029年,全球75%的行动数据将透过5G基础设施传输。大规模MIMO天线阵列需要频率高于6GHz且介电损耗极低的电容器,传统的陶瓷配方难以满足此要求。三星马达正将其最初为通讯基地台开发的技术应用于连网汽车平台,目标是实现汽车MLCC(多层陶瓷电容器)1兆韩元的销售额。村田製作所的006003吋MLCC比传统产品小75%,体现了在维持电气性能指标的同时,不断推进小型化进程。每个基地台无线电板都包含数万个电容器,随着5G部署的持续推进,电容器市场与全球频宽消耗趋势密切相关。
大批量陶瓷MLCC供应链的不稳定性
钛酸钡的短缺将使汽车级多层陶瓷电容器(MLCC)的前置作业时间延长至2024年,超过六个月,凸显了中国在前驱体加工领域占据主导地位所带来的地理集中风险。符合AEC-Q200标准的电容器产量比率仍低于70%,一旦供应紧张,就会在汽车和电讯客户之间造成分配衝突。设备升级使得製造更薄的介质层成为可能,但由于介质层厚度接近物理极限,因此需要超高纯度的原料,这进一步加剧了供应限制。儘管西方製造商已宣布扩大产能,但新工厂的认证可能需要长达两年的时间,这将延长目前的供需失衡。
细分市场分析
陶瓷电容器凭藉其优异的体积效率和耐高温性能,预计到2024年将占据电容器市场42.3%的份额,即使其他介质材料逐渐占据一席之地,陶瓷电容器仍将保持营收主导。此领域的成长动能源自于层数的持续增加和晶粒精细化控制,例如村田製作所推出的006003吋MLCC,其尺寸缩小75%后仍能维持电容值。未来的成长将取决于镍阻挡层端子的应用,这种端子可以降低银钯合金的成本,同时防止高温下的迁移。
超级/超强电容器将成为所有类型电容器中成长最快的,复合年增长率将达到7.5%,这主要得益于将高压锂电池组与碳基功率缓衝器相结合的混合总线线路。钽元件在医疗植入和航空电子模组领域仍将保持重要地位,其体积效率足以抵消成本溢价,但矿石供应将加剧价格波动。电解电容器将继续在高压电源插座领域占有一席之地,因为在这些领域,突波电流能力比耐用性更为重要。聚丙烯薄膜电容器将在可再生能源转换器领域获得成长,而聚四氟乙烯(PTFE)基电容器则面临与全氟烷基和多氟烷基物质(PFAS)相关的逐步淘汰要求。
低压设备(≤100V)在2024年贡献了49.1%的收入,主要得益于智慧型手机、穿戴式装置和资讯娱乐系统。然而,由于800V电池电动车和串联电容器组的普及,高压设备(>1kV)预计将以6.4%的复合年增长率加速成长,这扩大了电网调节专用电容器的市场规模。随着机器人技术和工厂自动化维修迁移到更高直流母线电压以提高效率,中压元件(100V至1kV)也呈现稳定成长。
设计人员正越来越多地采用电阻控制型高压堆迭结构,这种结构结合了陶瓷和薄膜技术,用于抑制宽能带隙半导体开关中的振铃现象。提供混合模组的供应商能够获得高价,这充分体现了能够同时应对高涟波电流和局部放电抑制能力的解决方案的价值。结果是,随着销售量的成长,产品差异化程度更高,价格下降速度也更慢。
区域分析
亚太地区预计到2024年将占全球销售额的46.7%,主要得益于中国、日本和韩国垂直整合的供应链。成熟的陶瓷粉末烧结技术、自动化MLCC烧结製程以及接近性电子产品OEM丛集的优势,带来了规模经济效益,巩固了该地区在基准生产领域的领先地位。日本供应商利用小型化专利,即使人事费用较高,也能确保较高的平均售价;而韩国供应商则专注于生产符合AEC-Q200热衝击标准的汽车级产品。
预计到2030年,北美将以7.4%的复合年增长率成长,成为各大主要地区中成长最快的地区。联邦政府在晶片和科学法案下的激励措施鼓励晶圆製造厂投资週边被动元件的生产回流;新建电动汽车组装厂利用在地采购来获得洁净汽车税额扣抵;此外,随着人工智慧加速器将电路板级产能预算提高约25%,数据中心营运商的需求也在不断增长,从而推动了高可靠性陶瓷和聚合物铝件价格的上涨多年。
欧洲在强劲的工业自动化需求与监管阻力之间寻求平衡,后者正在改变材料的选择。 PFAS的逐步淘汰正迅速推动聚丙烯和Polyethylene Naphthalate薄膜的替代,而电池法规2023/1542引入了生产者延伸责任制,有利于能够提供闭合迴路回收证明的供应商。南美和中东及非洲等新兴市场由于可再生能源竞标和电讯网路的扩张而出现暂时性成长,但由于基础设施不足,绝对销量仍然较低。整体而言,地理多元化有助于缓衝单一区域的衝击,并促进电容器市场的长期扩张。
其他福利:
- Excel格式的市场预测(ME)表
- 3个月的分析师支持
目录
第一章 引言
- 研究假设和市场定义
- 调查范围
第二章调查方法
第三章执行摘要
第四章 市场情势
- 市场概览
- 市场驱动因素
- 电动汽车电力电子技术的应用日益广泛
- 5G/FTTx的快速部署推动了对高频MLCC的需求
- 电网级电池部署
- 汽车区域电子电气架构
- 需要超低ESR上限的能源采集物联网节点
- 市场限制
- 高容量陶瓷MLCC供应链的变异性
- 固体电容器的技术诀窍差距
- PFAS逐步淘汰过渡到PTFE薄膜压力电容器市场
- 钽矿原料成本上涨
- 宏观经济因素的影响
- 产业供应链分析
- 监管环境
- 技术展望
- 波特五力分析
- 买方的议价能力
- 供应商的议价能力
- 新进入者的威胁
- 替代品的威胁
- 竞争对手之间的竞争
- 投资分析
第五章 市场规模与成长预测
- 按类型
- 陶瓷电容器
- 钽电容器
- 电解电容器
- 薄膜电容器
- 超级/超强电容器
- 按电压范围
- 低电压(100伏特或以下)
- 中压(100伏-1千伏)
- 高压(1千伏或以上)
- 以 Mount Style 为主题
- 表面贴装
- 通孔
- 按最终用户行业划分
- 车
- 产业
- 能源与电力
- 通讯/伺服器/数据存储
- 消费性电子产品
- 航太/国防
- 医疗设备
- 按地区
- 北美洲
- 美国
- 加拿大
- 墨西哥
- 南美洲
- 巴西
- 阿根廷
- 其他南美洲国家
- 欧洲
- 德国
- 英国
- 法国
- 俄罗斯
- 其他欧洲地区
- 亚太地区
- 中国
- 日本
- 印度
- 韩国
- 东南亚
- 亚太其他地区
- 中东和非洲
- 中东
- 沙乌地阿拉伯
- 阿拉伯聯合大公国
- 其他中东地区
- 非洲
- 南非
- 埃及
- 其他非洲地区
- 北美洲
第六章 竞争情势
- 市场集中度
- 策略趋势
- 市占率分析
- 公司简介
- Murata Manufacturing Co., Ltd.
- TDK Corporation
- KYOCERA AVX Components Corporation
- KEMET(Yageo Group)
- Vishay Intertechnology, Inc.
- Panasonic Holdings Corporation
- Samsung Electro-Mechanics Co., Ltd.
- Taiyo Yuden Co., Ltd.
- Walsin Technology Corporation
- Nippon Chemi-Con Corporation
- Rubycon Corporation
- Nichicon Corporation
- Cornell Dubilier Electronics, Inc.
- EPCOS AG(Infineon Technologies)
- Eaton Corporation plc(xEV capacitors)
- Maxwell Technologies, Inc.(UCAP)
- Skeleton Technologies Group OU
- LS Materials Co., Ltd.
- WIMA GmbH & Co KG
- Wurth Elektronik eiSos GmbH & Co KG
- Illinois Capacitor(Cornell Dubilier)
- Cap-XX Limited
- Lelon Electronics Corporation
- Samwha Electric Co., Ltd.
- Faratronic Co., Ltd.
- Elna Co., Ltd.
第七章 市场机会与未来展望
The capacitor market size stands at USD 26.7 billion in 2025 and is forecast to achieve USD 35.56 billion in 2030, advancing at a 5.89% CAGR.
Unabated electric-vehicle adoption, distributed-energy resources, and 5G densification form a durable three-pronged driver set that underpins the industry's growth outlook. Ceramic MLCCs retain design-socket dominance because of reliability across wide temperature ranges, whereas supercapacitors post the fastest revenue gains as utilities trial hybrid storage topologies. Heightened capital expenditure in artificial-intelligence data-center nodes further amplifies demand for ultra-low-ESR and high-ripple-current capacitors, effectively decoupling volumes from legacy smartphone seasonality. Parallel investments in localized production mitigate geopolitical risk and create new price-elastic demand pockets, especially among North American electric-mobility startups. Policymakers' procurement incentives strengthen the revenue visibility of companies willing to regionalize supply chains in exchange for tax credits.
Global Capacitor Market Trends and Insights
Growing Adoption of EV Power-Electronics
Electric-vehicle output rose to 17.3 million units in 2024, a 25% year-on-year surge that translates directly into higher demand for high-voltage film capacitors in traction inverters. Each battery-electric car now integrates more than 15,000 MLCCs, quadrupling the baseline content found in traditional combustion models, while premium 800 V drivetrains require devices with enhanced voltage ratings and thermal stability. Capacitor suppliers able to pass AEC-Q200 qualifications enjoy multi-year design wins that shield them from consumer-electronics volatility. TDK's 100 V, 10 µF MLCC in the 3225 case size exemplifies how product roadmaps stretch performance envelopes without enlarging footprint. The result is a structural uplift in average selling price per vehicle, reinforcing the positive flywheel between electrification and the capacitor market.
Rapid 5G/FTTx Roll-Outs Driving High-Frequency MLCC Demand
More than 300 network operators will activate commercial 5G service by late 2024, and analysts forecast that 75% of global mobile data will traverse 5G infrastructure by 2029.Massive-MIMO antenna arrays require capacitors with ultra-low dielectric loss at frequencies above 6 GHz, a specification that legacy ceramic formulations struggle to meet. Samsung Electro-Mechanics, therefore, targets KRW 1 trillion in automotive MLCC revenue, leveraging know-how originally developed for telecommunication base stations to serve connected-vehicle platforms. Murata's 006003-inch MLCC, 75% smaller than its predecessor, embodies the perpetual miniaturization race while safeguarding electrical performance metrics. With each base-station radio board hosting tens of thousands of capacitors, the upward trajectory of 5G deployments ensures that the capacitor market remains tightly coupled to global bandwidth-consumption trends.
Volatility in MLCC Supply Chain for High-Capacitance Ceramics
Barium titanate shortages pushed lead times for automotive-grade MLCCs beyond six months in 2024, underlining geographic concentration risks because China dominates precursor processing. Yield rates for capacitors that meet AEC-Q200 standards remain below 70%, creating allocation battles between automotive and telecom customers whenever supply tightens. Equipment upgrades that enable thinner dielectric layers exacerbate constraints by requiring ultrapure raw materials as layer thickness nears physical limits. Western manufacturers have announced capacity expansions, yet fresh factories need up to two years to qualify, prolonging near-term supply imbalances.
Other drivers and restraints analyzed in the detailed report include:
- Grid-Scale Battery Storage Deployment
- Automotive Zonal E/E Architectures
- Technical Know-How Gap for Solid-State Ultracapacitors
For complete list of drivers and restraints, kindly check the Table Of Contents.
Segment Analysis
Ceramic capacitors captured 42.3% of the capacitor market share in 2024 by balancing volumetric efficiency with rugged temperature tolerance, maintaining revenue leadership even as alternative dielectrics gain niche footholds. The segment's momentum stems from relentless layer-count increases and finer-grain control, as demonstrated by Murata's release of a 006003-inch MLCC that maintains capacitance despite a 75% footprint reduction. Future growth hinges on incorporating nickel-barrier terminations that reduce silver-palladium cost exposure while preventing migration at high temperatures.
Super-/ultracapacitors register a 7.5% CAGR, the fastest across all types, propelled by hybrid bus lines that pair high-voltage lithium packs with carbon-based power buffers. Tantalum parts sustain relevance in medical implants and avionics modules where volumetric efficiency offsets cost premiums, though ore sourcing adds price volatility. Aluminum electrolytics retain high-voltage power-supply sockets where surge current capability trumps endurance concerns. Film capacitors experience bifurcated demand: polypropylene films grow in renewable-energy converters, whereas PTFE-based variants face PFAS-related phase-down mandates.
Low-voltage devices (<=100 V) delivered 49.1% of 2024 revenue, anchored by smartphones, wearables, and infotainment consoles. Yet the high-voltage class (>1 kV) is projected to accelerate at a 6.4% CAGR as 800 V battery-electric vehicles and series-capacitor banks proliferate; together they are expanding the capacitor market size devoted to power-transmission conditioning. Medium-voltage parts (100 V-1 kV) grow steadily because robotics and factory-automation retrofits migrate to higher DC-bus levels for efficiency gains.
Designers increasingly demand impedance-controlled, high-voltage stacks that combine ceramic and film technologies to tame ringing in wide-band-gap semiconductor switches. Suppliers responding with hybrid modules capture premium pricing, demonstrating that value accrues to solutions able to handle both high ripple current and partial-discharge endurance. The resulting product differentiation keeps price erosion modest even as unit volumes rise.
The Capacitor Market Report is Segmented by Type (Ceramic, Tantalum, and More), Voltage Range (Low <=100 V, Medium 100 V-1 KV, High - Above 1 KV), Mounting Style (Surface-Mount, and Through-Hole), End-User Industry (Automotive, Industrial, Energy and Power, Consumer Electronics, and More), and Geography (North America, South America, Europe, Asia-Pacific, and More). The Market Forecasts are Provided in Terms of Value (USD).
Geography Analysis
Asia-Pacific commanded 46.7% of 2024 worldwide revenue thanks to vertically integrated supply chains in China, Japan, and South Korea. Mature ceramic-powder calcination, automated MLCC sintering, and proximity to electronics OEM clusters provide scale economies that reinforce the region's grip on baseline production. Japanese vendors leverage miniaturization patents to secure higher average selling prices despite labor-cost premiums, while South Korean lines specialize in automotive-grade lots that satisfy AEC-Q200 thermal-shock limits.
North America is forecast to record a 7.4% CAGR through 2030, the fastest across major regions. Federal incentives under the CHIPS and Science Act encourage passive-component reshoring adjacent to wafer-fab investments, and new EV assembly plants use localized sourcing to unlock clean-vehicle tax credits. Data-center operators also raise demand as AI accelerators inflate board-level capacitance budgets by about 25%, sustaining a multi-year uplift for high-reliability ceramic and polymer-aluminum devices.
Europe balances steady industrial-automation demand with regulatory headwinds that reshape material choices. PFAS phase-outs compel rapid substitution toward polypropylene and polyethylene naphthalate films, while Battery Regulation 2023/1542 introduces extended-producer-responsibility rules that favor suppliers able to document closed-loop recycling. Emerging markets in South America and the Middle East & Africa add episodic upside via renewable-energy auctions and telecom network expansions, yet infrastructure gaps keep absolute volumes small. Altogether, geographic diversification mitigates single-region shocks and reinforces long-run expansion for the capacitor market.
- Murata Manufacturing Co., Ltd.
- TDK Corporation
- KYOCERA AVX Components Corporation
- KEMET (Yageo Group)
- Vishay Intertechnology, Inc.
- Panasonic Holdings Corporation
- Samsung Electro-Mechanics Co., Ltd.
- Taiyo Yuden Co., Ltd.
- Walsin Technology Corporation
- Nippon Chemi-Con Corporation
- Rubycon Corporation
- Nichicon Corporation
- Cornell Dubilier Electronics, Inc.
- EPCOS AG (Infineon Technologies)
- Eaton Corporation plc (xEV capacitors)
- Maxwell Technologies, Inc. (UCAP)
- Skeleton Technologies Group OU
- LS Materials Co., Ltd.
- WIMA GmbH & Co KG
- Wurth Elektronik eiSos GmbH & Co KG
- Illinois Capacitor (Cornell Dubilier)
- Cap-XX Limited
- Lelon Electronics Corporation
- Samwha Electric Co., Ltd.
- Faratronic Co., Ltd.
- Elna Co., Ltd.
Additional Benefits:
- The market estimate (ME) sheet in Excel format
- 3 months of analyst support
TABLE OF CONTENTS
1 INTRODUCTION
- 1.1 Study Assumptions and Market Definition
- 1.2 Scope of the Study
2 RESEARCH METHODOLOGY
3 EXECUTIVE SUMMARY
4 MARKET LANDSCAPE
- 4.1 Market Overview
- 4.2 Market Drivers
- 4.2.1 Growing adoption of EV power-electronics
- 4.2.2 Rapid 5G/FTTx roll-outs driving high-frequency MLCC demand
- 4.2.3 Grid-scale battery storage deployment
- 4.2.4 Automotive zonal E/E architectures
- 4.2.5 Energy harvesting IoT nodes needing ultra-low-ESR caps
- 4.3 Market Restraints
- 4.3.1 Volatility in MLCC supply chain for high-capacitance ceramics
- 4.3.2 Technical know-how gap for solid-state ultracapacitor
- 4.3.3 PFAS phase-out pressure on PTFE film capacitor
- 4.3.4 Rising raw-material cost of tantalum ore
- 4.4 Impact of Macroeconomic Factors
- 4.5 Industry Supply Chain Analysis
- 4.6 Regulatory Landscape
- 4.7 Technological Outlook
- 4.8 Porter's Five Forces Analysis
- 4.8.1 Bargaining Power of Buyers
- 4.8.2 Bargaining Power of Suppliers
- 4.8.3 Threat of New Entrants
- 4.8.4 Threat of Substitute Products
- 4.8.5 Intensity of Competitive Rivalry
- 4.9 Investment Analysis
5 MARKET SIZE AND GROWTH FORECASTS (VALUE)
- 5.1 By Type
- 5.1.1 Ceramic Capacitor
- 5.1.2 Tantalum Capacitor
- 5.1.3 Aluminum Electrolytic Capacitor
- 5.1.4 Film Capacitor
- 5.1.5 Super-/Ultra Capacitor
- 5.2 By Voltage Range
- 5.2.1 Low Voltage (<=100 V)
- 5.2.2 Medium Voltage (100 V-1 kV)
- 5.2.3 High Voltage (Above 1 kV)
- 5.3 By Mounting Style
- 5.3.1 Surface-Mount
- 5.3.2 Through-Hole
- 5.4 By End-user Industry
- 5.4.1 Automotive
- 5.4.2 Industrial
- 5.4.3 Energy and Power
- 5.4.4 Communications / Servers / Data Storage
- 5.4.5 Consumer Electronics
- 5.4.6 Aerospace and Defense
- 5.4.7 Medical Devices
- 5.5 By Geography
- 5.5.1 North America
- 5.5.1.1 United States
- 5.5.1.2 Canada
- 5.5.1.3 Mexico
- 5.5.2 South America
- 5.5.2.1 Brazil
- 5.5.2.2 Argentina
- 5.5.2.3 Rest of South America
- 5.5.3 Europe
- 5.5.3.1 Germany
- 5.5.3.2 United Kingdom
- 5.5.3.3 France
- 5.5.3.4 Russia
- 5.5.3.5 Rest of Europe
- 5.5.4 Asia-Pacific
- 5.5.4.1 China
- 5.5.4.2 Japan
- 5.5.4.3 India
- 5.5.4.4 South Korea
- 5.5.4.5 South-East Asia
- 5.5.4.6 Rest of Asia-Pacific
- 5.5.5 Middle East and Africa
- 5.5.5.1 Middle East
- 5.5.5.1.1 Saudi Arabia
- 5.5.5.1.2 United Arab Emirates
- 5.5.5.1.3 Rest of Middle East
- 5.5.5.2 Africa
- 5.5.5.2.1 South Africa
- 5.5.5.2.2 Egypt
- 5.5.5.2.3 Rest of Africa
- 5.5.1 North America
6 COMPETITIVE LANDSCAPE
- 6.1 Market Concentration
- 6.2 Strategic Moves
- 6.3 Market Share Analysis
- 6.4 Company Profiles (includes Global level Overview, Market level overview, Core Segments, Financials as available, Strategic Information, Market Rank/Share for key companies, Products & Services, and Recent Developments)
- 6.4.1 Murata Manufacturing Co., Ltd.
- 6.4.2 TDK Corporation
- 6.4.3 KYOCERA AVX Components Corporation
- 6.4.4 KEMET (Yageo Group)
- 6.4.5 Vishay Intertechnology, Inc.
- 6.4.6 Panasonic Holdings Corporation
- 6.4.7 Samsung Electro-Mechanics Co., Ltd.
- 6.4.8 Taiyo Yuden Co., Ltd.
- 6.4.9 Walsin Technology Corporation
- 6.4.10 Nippon Chemi-Con Corporation
- 6.4.11 Rubycon Corporation
- 6.4.12 Nichicon Corporation
- 6.4.13 Cornell Dubilier Electronics, Inc.
- 6.4.14 EPCOS AG (Infineon Technologies)
- 6.4.15 Eaton Corporation plc (xEV capacitors)
- 6.4.16 Maxwell Technologies, Inc. (UCAP)
- 6.4.17 Skeleton Technologies Group OU
- 6.4.18 LS Materials Co., Ltd.
- 6.4.19 WIMA GmbH & Co KG
- 6.4.20 Wurth Elektronik eiSos GmbH & Co KG
- 6.4.21 Illinois Capacitor (Cornell Dubilier)
- 6.4.22 Cap-XX Limited
- 6.4.23 Lelon Electronics Corporation
- 6.4.24 Samwha Electric Co., Ltd.
- 6.4.25 Faratronic Co., Ltd.
- 6.4.26 Elna Co., Ltd.
7 MARKET OPPORTUNITIES AND FUTURE OUTLOOK
- 7.1 White-space and Unmet-need Assessment
 三端电容器市场:依产品类型、介质类型、额定电压、安装方式、封装、应用和终端用户产业划分,全球预测,2026-2032年MOS电容器市场按类型、应用、安装方式、额定电压和电容范围划分,全球预测(2026-2032年)
 全球半导体晶圆厂高真空设备市场预测(至2034年),依设备类型、晶圆厂节点、晶圆厂规模、技术、应用、最终用户及地区划分
 电容器薄膜市场规模、份额和趋势分析报告:按介电材料、应用、地区和细分市场预测(2026-2033 年)
 2026年全球卡入式电解电容器市场报告2026年全球水冷电容器市场报告2026年全球电解电容器市场报告2026年全球表面黏着型元件(SMD)电容器市场报告2026年金属-绝缘体-半导体(MIS)晶片电容器全球市场报告固体电容器市场按介质类型、电容范围、额定电压、封装技术和终端用户产业划分-全球预测(2026-2032年)