


 |
市场调查报告书
商品编码
1910459
铂族金属:市场占有率分析、产业趋势与统计、成长预测(2026-2031)Platinum Group Metals - Market Share Analysis, Industry Trends & Statistics, Growth Forecasts (2026 - 2031) |
||||||
※ 本网页内容可能与最新版本有所差异。详细情况请与我们联繫。
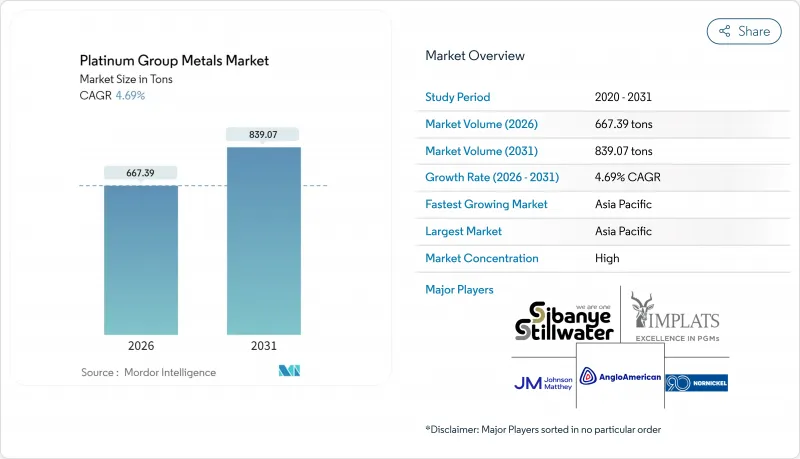
2025 年铂族金属市场价值为 637.51 吨,预计从 2026 年的 667.39 吨增长到 2031 年的 839.07 吨,在预测期(2026-2031 年)内,预计复合年增长率为 4.69%。
铂族金属市场受惠于两大需求来源:一是汽油和混合动力汽车对汽车触媒的持续需求,二是质子交换膜(PEM)氢气生产技术的快速发展。催化剂中钯金向铂金的转变提振了短期市场情绪,而长期机会则来自绿色氢能的扩张,预计到2025年,绿色氢能将使PEM电解中铂金的年需求量翻一番。铱供应紧张、亚洲珠宝饰品强劲以及铂族金属在先进电子产品中应用日益广泛,这些因素共同支撑了铂族金属价格。然而,价格持续波动以及南非不断上涨的生产成本阻碍了长期供应协议的签署,尤其是与燃料电池原始设备製造商(OEM)的协议。
全球铂系元素市场趋势与洞察
汽车产业对触媒转换器的需求不断增长
2024年,乘用车、混合动力汽车合计占铂族金属总消费量的60%。更严格的欧7和国六b排放标准推动了单车铂族金属用量的增加,抵消了汽油产量下降的影响。混合动力汽车催化剂中铂族金属含量尤其高,预计2025年汽车催化剂对铂的需求量将达到八年来的最高水平,为324万盎司。重型车辆需要更高浓度的铂族金属,这形成了一个盈利的细分市场,且受乘用车需求放缓的影响较小。亚洲市场的规模,加上政府对清洁引擎的支持,使得铂族金属市场高度依赖汽车需求。
北美PEM电解的扩张
预计到2030年,与氢气相关的铂金需求将达到87.5万盎司(约占铂金总用量的10%),并在2025年再次翻倍。加拿大的清洁氢能税额扣抵(40%)和美国的《通货膨胀控制法案》正在推动数吉瓦级电解槽的订单。铱供不应求是限制因素,预计2024年的产量仅7.7吨。诸如Smoltec公司的奈米涂层技术等技术突破对于扩大供应至关重要,该技术可将PEM电池中铱的使用量减少95%。这些进展为铂族金属市场的长期成长奠定了坚实的基础。
生产成本上升
南非的电力限制和劳工动盪推高了采矿成本。英美资源集团铂金公司2024年的单位成本为每盎司6E铂金20,922兰特,较上年上涨5%。深层矿床需要先进的冷却技术和矿脉稳定措施,这增加了固定成本。在价格低迷时期,轮流开采的铂族金属生产商往往只能勉强维持收支平衡甚至亏损,降低了其扩张所需的资本能力。这些动态增加了铂族金属供应安全的下行风险,并限制了铂族金属市场的长期合约。
细分市场分析
2025年,钯金在铂族金属(PGM)市场中占比46.55%,汽油催化剂的持续需求推动了其消费。铱金主要用于PEM电解槽阳极,预计到2031年将以8.92%的复合年增长率成长,在所有铂族金属中增速最高。供应紧张和技术依赖性将维持铱金的溢价,使其在未来几年对铂族金属市场的贡献更大。铂金的復苏主要受汽油催化剂替代需求的推动,光是2023年就有超过60万盎司的需求转移。铑金由于替代品有限,价格将保持高位,而钌和锇在小众化学和数据存储应用领域的需求不断增长,从而实现了收入来源的多元化。
PEM系统和先进记忆体的持续成长正推动铱和钌从特殊应用领域走向主流应用。预计2024年铑的平均价格将达到每盎司5,375美元,这表明供应将受到限制。铂供应量的成长和现有的替代需求维持了强劲的需求,并稳定了铂族金属市场。技术废弃物(例如硬碟)回收率的提高提高了钌的供应安全性,缓解了价格压力,同时增强了其对循环经济的贡献,而循环经济正是电子产品製造商的优先事项。
到2025年,珠宝饰品业仍将占铂族金属消费量的28.75%,巩固其作为最大应用领域的地位,尤其是在中国、日本和印度。儘管宏观经济疲软,但低调的奢侈品消费趋势和铂金的投资吸引力支撑着潜在需求。同时,燃料电池产业正以28.47%的复合年增长率快速成长,这得益于多吉瓦级电解计划和固定式发电专案的推动。因此,预计到2031年,燃料电池堆用铂族金属的市场规模将快速扩张。
随着排放标准的日益严格,汽车催化剂仍然至关重要。随着半导体製程节点缩小至3奈米及以下,电子应用领域持续成长。玻璃纤维製造和颜料应用充分利用了铂金的高熔点,而医疗设备产业则强调其在导管和支架製造方面的生物相容性。化学製程催化剂,尤其是在炼油厂的硝酸生产和加氢裂解製程中,铂族金属(PGM)的消费量持续保持稳定且庞大,从而提供了多元化且经济均衡的应用基础。
铂系元素报告按金属类型(铂、钯、铑等)、应用领域(汽车催化剂、电气和电子设备等)、来源(原生(采矿)、回收/再生)、终端用户行业(汽车、工业化学品等)以及地区(亚太、北美、欧洲、南美、中东和非洲)进行细分。市场预测以吨为单位。
区域分析
预计到2025年,亚洲将占据铂族金属市场51.60%的主导地位,这主要得益于中国作为全球最大的钯金(用于汽车催化剂)和铂金(用于珠宝饰品)消费国的地位。随着北京寻求提升国内定价权,广州期货交易所已上市铂金和钯金期货合约,从而增强了市场流动性,并鼓励工业用户对冲其长期头寸(日经亚洲)。日本珠宝饰品需求的復苏以及印度婚礼带动的饰品需求正在提振区域需求,而台湾和韩国的电子产业丛集则支撑着工业消费。
在欧洲,德国和英国更严格的排放法规导致铂族金属(PGM)消费量显着增加,催化剂用量也随之提高。即将实施的欧7排放标准预计将进一步增加乘用车和重型车辆的铂族金属用量,而向电动车的转型则使供需平衡变得更加复杂。欧洲在铂族金属回收领域也处于领先地位。庄信万丰(Johnson Matthey)和优美科(Umicore)经营先进的设施,在回收汽车催化剂金属的同时最大限度地减少排放,从而支持循环经济的目标,并有助于稳定铂族金属市场。
在氢能政策和汽油动力汽车持续销售的推动下,北美正在崛起为成长中心。加拿大是世界第三大钯金生产国和第四大铂金生产国,预计2022年将开采71万盎司铂金,主要产自安大略省。渥太华的清洁氢能税收优惠政策正在刺激电解计划,进一步提振该地区对铂金和铱的需求。美国《通膨控制法案》将透过资助氢能中心建设来巩固这一趋势,从而巩固铂族金属市场的长期前景。
其他福利:
- Excel格式的市场预测(ME)表
- 3个月的分析师支持
目录
第一章 引言
- 研究假设和市场定义
- 调查范围
第二章调查方法
第三章执行摘要
第四章 市场情势
- 市场概览
- 市场驱动因素
- 汽车产业对触媒转换器的需求不断增长
- 北美PEM电解的扩张推动了铂金需求。
- 电子业对铂、钯和钌的需求不断增长
- 钯金替代铂金催化剂将推动对这种双金属催化剂的需求。
- 亚太地区国家珠宝饰品消费成长
- 市场限制
- 高成本
- 价格波动阻碍燃料电池原始设备製造商的长期承保
- 回收竞赛
- 价值链分析
- 波特五力模型
- 供应商的议价能力
- 买方的议价能力
- 新进入者的威胁
- 替代品的威胁
- 竞争程度
第五章 市场规模与成长预测
- 按金属类型
- 铂
- 钯
- 铑
- 铱
- 钌
- 钡
- 透过使用
- 汽车触媒
- 电气和电子设备
- 燃料电池
- 玻璃、陶瓷、颜料
- 珠宝饰品
- 医疗(牙科和製药)
- 化工
- 其他(航太、感测器、水处理、法医学)
- 按来源
- 初级(采矿)
- 繁殖/次要
- 按最终用途行业划分
- 车
- 工业化学品
- 可再生能源和氢能
- 电子和半导体
- 珠宝饰品和奢侈品
- 医疗设备
- 玻璃製造
- 炼油
- 其他的
- 按地区
- 亚太地区
- 中国
- 印度
- 日本
- 韩国
- ASEAN
- 亚太其他地区
- 北美洲
- 美国
- 加拿大
- 墨西哥
- 欧洲
- 德国
- 英国
- 法国
- 义大利
- 西班牙
- 其他欧洲地区
- 南美洲
- 巴西
- 阿根廷
- 其他南美洲
- 中东和非洲
- 沙乌地阿拉伯
- 南非
- 其他中东和非洲地区
- 亚太地区
第六章 竞争情势
- 市场集中度
- 策略趋势
- 市占率分析
- 公司简介
- African Rainbow Minerals Limited
- Anglo American plc
- BASF SE
- DOWA Holdings Co., Ltd
- Glencore
- Heraeus Group
- Impala Platinum Holdings Ltd
- Ivanhoe Mines
- Jinchuan Group International Resources Co. Ltd
- Johnson Matthey
- Norilsk Nickel
- Northam Platinum Holdings Limited
- Platinum Group Metals Ltd
- Sibanye-Stillwater Limited
- TANAKA PRECIOUS METAL GROUP Co., Ltd.
- Umicore
- Vale
第七章 市场机会与未来展望
The Platinum Group Metals Market was valued at 637.51 tons in 2025 and estimated to grow from 667.39 tons in 2026 to reach 839.07 tons by 2031, at a CAGR of 4.69% during the forecast period (2026-2031).
The Platinum group metals market benefits from a dual-track demand profile: sustained autocatalyst requirements in gasoline and hybrid vehicles and fast-accelerating adoption in proton-exchange-membrane (PEM) hydrogen technologies. The ongoing palladium-for-platinum shift in catalysts buoys short-term sentiment, while longer-term opportunity stems from green-hydrogen build-outs expected to double platinum demand for PEM electrolysers year-on-year through 2025. Iridium supply constraints, jewelry's resilience in Asia, and increasing PGM intensity in advanced electronics collectively support price fundamentals. Simultaneously, persistent price volatility and rising South African production costs inhibit long-dated offtake contracts, especially for fuel-cell OEMs.
Global Platinum Group Metals Market Trends and Insights
Growing Demand for Catalytic Converters from the Automotive Sector
Passenger cars, hybrids, and heavy-duty trucks together consumed 60% of all PGMs in 2024. Stricter Euro 7 and China VI-b standards raise PGM loadings per vehicle, offsetting lower gasoline production volumes. Hybrid-vehicle catalysts are especially PGM-dense, pushing projected platinum autocatalyst demand to an eight-year high of 3.24 million oz in 2025. Heavy-duty vehicles require even higher PGM doses, creating a profitable niche that shields producers from passenger-car headwinds. Asia's scale, coupled with government incentives for cleaner engines, keeps the Platinum group metals market firmly reliant on automotive offtake.
PEM Electrolyser Build-out in North America
Platinum demand linked to hydrogen is expected to double again in 2025, after reaching 875 koz by 2030, roughly 10% of total platinum use. Canada's 40% clean-hydrogen tax credit and the United States' Inflation Reduction Act underpin multi-gigawatt electrolyser orders. Iridium scarcity is an obstacle: 2024 production barely reached 7.7 tons. Technology breakthroughs, such as Smoltek's nanoscale coatings that reduce iridium loading in PEM cells by 95%, are vital for scaling supply. These developments solidify a long-run growth platform for the Platinum group metals market.
High Production Costs
Electricity load shedding and labor unrest in South Africa elevated mining costs: Anglo American Platinum's unit cost rose 5% to ZAR 20,922 per 6E oz in 2024. Deep-level deposits require advanced refrigeration and reef stabilization, elevating the fixed-cost base. During price troughs, swing producers operate at breakeven or losses, reducing capital capacity for expansion. These dynamics add downside risk to supply stability and limit long-term contracts for the Platinum group metals market.
Other drivers and restraints analyzed in the detailed report include:
- Increasing Electronics Demand
- Palladium-for-Platinum Substitution
- Price Volatility Deterring Long-Term Off-Take
For complete list of drivers and restraints, kindly check the Table Of Contents.
Segment Analysis
Palladium captured 46.55% of the Platinum group metals market in 2025 as gasoline catalysts continued to dominate consumption. Iridium, used chiefly in PEM electrolyser anodes, is projected to grow at a 8.92% CAGR through 2031, the fastest among all PGMs. Tight supply and technological reliance sustain iridium's price premium, magnifying its contribution to the Platinum group metals market size in later years. Platinum's renaissance stems from its substitution into gasoline catalysts; over 600 koz converted demand in 2023 alone. Rhodium's limited substitutes command high pricing, while ruthenium and osmium gain traction in niche chemical and data-storage applications, diversifying revenue streams.
Persistent load-growth in PEM systems and advanced memory drives iridium and ruthenium from specialty to mainstream status. Prices for rhodium averaged USD 5,375 /oz in 2024, indicative of constrained supply. Platinum's wider availability and ongoing substitution lock-in robust demand, stabilizing the Platinum group metals market. Recycling yields of technological scraps such as disk drives improve ruthenium supply security, tempering upward price pressure but reinforcing circular-economy credentials prized by electronics firms.
Jewelry retained 28.75% of PGM consumption in 2025, cementing its status as the largest application, especially across China, Japan, and India. Quiet-luxury trends and platinum's investment appeal sustain baseline volumes despite macroeconomic softness. The fuel-cell segment, however, is racing ahead with a 28.47% CAGR, supported by multi-gigawatt electrolyser initiatives and stationary power programs. The Platinum group metals market size allocated to fuel-cell stacks is thus expected to expand rapidly through 2031.
Autocatalysts remain indispensable as lawmakers raise emission-control thresholds. Electronics applications keep climbing as semiconductor nodes shrink below 3 nm. Glass fibre production and pigment uses leverage platinum's high melting point, while medical devices rely on its biocompatibility for catheters and stents. Chemical-process catalysts, notably in nitric-acid and refinery hydrocracking, continue to consume sizable but steady PGM volumes, offering a diversified application base that hedges cyclical swings.
The Platinum Group Metals Report is Segmented by Metal Type (Platinum, Palladium, Rhodium, and More), Application (Auto Catalysts, Electrical and Electronics, and More), Source (Primary (Mined), Recycled/Secondary), End-Use Industry (Automotive, Industrial Chemicals, and More), and Geography (Asia-Pacific, North America, Europe, South America, and Middle East and Africa). The Market Forecasts are Provided in Terms of Volume (tons).
Geography Analysis
Asia held a commanding 51.60% share of the Platinum group metals market in 2025, underpinned by China's status as the largest consumer of palladium for autocatalysts and platinum for jewelry. Beijing's pursuit of domestic pricing power led the Guangzhou Futures Exchange to list platinum and palladium contracts, deepening liquidity and encouraging industrial users to hedge long-term positions Nikkei Asia. Japan's jewelry rebound and India's wedding-driven ornament demand strengthen regional pull, while the region's electronics clusters in Taiwan and South Korea reinforce industrial consumption.
Europe, driven by stringent emissions mandates in Germany and the United Kingdom, has experienced significant growth in consumption, leading to heightened catalyst loadings. The forthcoming Euro 7 framework stimulates additional PGM intensity in both passenger and heavy-duty platforms, although the electric-vehicle transition creates a complex demand balance. Europe also champions PGM recycling: Johnson Matthey and Umicore run state-of-the-art facilities that recover autocatalyst metals with minimal emissions, supporting circular-economy targets and stabilizing the Platinum group metals market.
North America is emerging as a growth pole thanks to hydrogen policies and sustained gasoline vehicle sales. Canada is the world's third-largest palladium and fourth-largest platinum producer, with 710,000 oz mined in 2022, chiefly in Ontario Natural Resources Canada. Ottawa's clean-hydrogen tax incentive accelerates electrolyser projects, channelling additional platinum and iridium demand into the region. The United States' Inflation Reduction Act amplifies this trajectory by funding hydrogen hubs, reinforcing long-run prospects for the Platinum group metals market.
- African Rainbow Minerals Limited
- Anglo American plc
- BASF SE
- DOWA Holdings Co., Ltd
- Glencore
- Heraeus Group
- Impala Platinum Holdings Ltd
- Ivanhoe Mines
- Jinchuan Group International Resources Co. Ltd
- Johnson Matthey
- Norilsk Nickel
- Northam Platinum Holdings Limited
- Platinum Group Metals Ltd
- Sibanye-Stillwater Limited
- TANAKA PRECIOUS METAL GROUP Co., Ltd.
- Umicore
- Vale
Additional Benefits:
- The market estimate (ME) sheet in Excel format
- 3 months of analyst support
TABLE OF CONTENTS
1 Introduction
- 1.1 Study Assumptions and Market Definition
- 1.2 Scope of the Study
2 Research Methodology
3 Executive Summary
4 Market Landscape
- 4.1 Market Overview
- 4.2 Market Drivers
- 4.2.1 Growing Demand for Catalytic Converters from the Automotive Industry
- 4.2.2 PEM Electrolyser Build-out in North America Accelerating Platinum Demand
- 4.2.3 Increasing Demand for Platinum, Palladium, and Ruthenium from the Electronics Industry
- 4.2.4 Palladium-for-Platinum Catalyst Substitution Creating Dual-Metal Upswing
- 4.2.5 Growing Jewelry Consumption in Asia-Pacific Countries
- 4.3 Market Restraints
- 4.3.1 High Costs Involved in Production and Maintenance
- 4.3.2 Price Volatility Deterring Long-Term Off-Take by Fuel-Cell OEMs
- 4.3.3 Recycling Competition
- 4.4 Value Chain Analysis
- 4.5 Porter's Five Forces
- 4.5.1 Bargaining Power of Suppliers
- 4.5.2 Bargaining Power of Buyers
- 4.5.3 Threat of New Entrants
- 4.5.4 Threat of Substitutes
- 4.5.5 Degree of Competition
5 Market Size and Growth Forecasts (Volume)
- 5.1 By Metal Type
- 5.1.1 Platinum
- 5.1.2 Palladium
- 5.1.3 Rhodium
- 5.1.4 Iridium
- 5.1.5 Ruthenium
- 5.1.6 Osmium
- 5.2 By Application
- 5.2.1 Auto Catalysts
- 5.2.2 Electrical and Electronics
- 5.2.3 Fuel Cells
- 5.2.4 Glass, Ceramics and Pigments
- 5.2.5 Jewellery
- 5.2.6 Medical (Dental and Pharma)
- 5.2.7 Chemical Industry
- 5.2.8 Other (Aerospace, Sensors, Water, Forensics)
- 5.3 By Source
- 5.3.1 Primary (Mined)
- 5.3.2 Recycled/Secondary
- 5.4 By End-Use Industry
- 5.4.1 Automotive
- 5.4.2 Industrial Chemicals
- 5.4.3 Renewable Energy and Hydrogen
- 5.4.4 Electronics and Semiconductors
- 5.4.5 Jewellery and Luxury Goods
- 5.4.6 Healthcare Devices
- 5.4.7 Glass Manufacturing
- 5.4.8 Petroleum Refining
- 5.4.9 Others
- 5.5 By Geography
- 5.5.1 Asia-Pacific
- 5.5.1.1 China
- 5.5.1.2 India
- 5.5.1.3 Japan
- 5.5.1.4 South Korea
- 5.5.1.5 ASEAN
- 5.5.1.6 Rest of Asia-Pacific
- 5.5.2 North America
- 5.5.2.1 United States
- 5.5.2.2 Canada
- 5.5.2.3 Mexico
- 5.5.3 Europe
- 5.5.3.1 Germany
- 5.5.3.2 United Kingdom
- 5.5.3.3 France
- 5.5.3.4 Italy
- 5.5.3.5 Spain
- 5.5.3.6 Rest of Europe
- 5.5.4 South America
- 5.5.4.1 Brazil
- 5.5.4.2 Argentina
- 5.5.4.3 Rest of South America
- 5.5.5 Middle East and Africa
- 5.5.5.1 Saudi Arabia
- 5.5.5.2 South Africa
- 5.5.5.3 Rest of Middle East and Africa
- 5.5.1 Asia-Pacific
6 Competitive Landscape
- 6.1 Market Concentration
- 6.2 Strategic Moves
- 6.3 Market Share Analysis
- 6.4 Company Profiles (includes Global level Overview, Market level overview, Core Segments, Financials as available, Strategic Information, Market Rank/Share for key companies, Products and Services, and Recent Developments)
- 6.4.1 African Rainbow Minerals Limited
- 6.4.2 Anglo American plc
- 6.4.3 BASF SE
- 6.4.4 DOWA Holdings Co., Ltd
- 6.4.5 Glencore
- 6.4.6 Heraeus Group
- 6.4.7 Impala Platinum Holdings Ltd
- 6.4.8 Ivanhoe Mines
- 6.4.9 Jinchuan Group International Resources Co. Ltd
- 6.4.10 Johnson Matthey
- 6.4.11 Norilsk Nickel
- 6.4.12 Northam Platinum Holdings Limited
- 6.4.13 Platinum Group Metals Ltd
- 6.4.14 Sibanye-Stillwater Limited
- 6.4.15 TANAKA PRECIOUS METAL GROUP Co., Ltd.
- 6.4.16 Umicore
- 6.4.17 Vale
7 Market Opportunities and Future Outlook
- 7.1 White-Space and Unmet-Need Assessment
- 7.2 Usage of Platinum in Green Technology
 2026年全球钢锭市场报告
 钌市场规模、占有率、成长及全球产业分析:依产品类型、应用和地区划分的洞察与预测(2026-2034)
 日本铑市场报告(按来源、产品类型、应用、最终用途产业和地区划分,2026-2034年)
 铂金矿业市场规模、份额及成长分析(按开采方法、矿石品位、矿床类型、应用及地区划分)-产业预测(2026-2033)
 铑市场规模、份额和成长分析(按类型、产品类型、应用、最终用户和地区划分)—产业预测,2026-2033年
 钌市场按应用、终端用户产业、产品类型、纯度等级、形态和销售管道划分-2025-2032年全球预测铑市场按来源类型、形态和应用划分-2025-2032年全球预测铽箔市场(按产品类型、厚度、形状、纯度、最终用途和分销管道)—2025-2030 年全球预测
 全球铸铝加热板市场全球铂族金属市场