


 |
市场调查报告书
商品编码
1905996
石油炼製:市场占有率分析、产业趋势与统计、成长预测(2026-2031)Oil Refining - Market Share Analysis, Industry Trends & Statistics, Growth Forecasts (2026 - 2031) |
||||||
※ 本网页内容可能与最新版本有所差异。详细情况请与我们联繫。
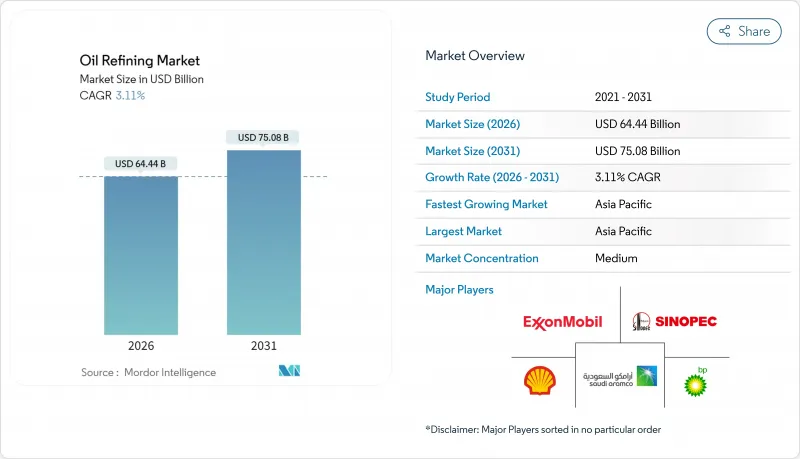
2025 年石油炼製市场价值 625 亿美元,预计从 2026 年的 644.4 亿美元成长到 2031 年的 750.8 亿美元,预测期(2026-2031 年)复合年增长率为 3.11%。
这一成长轨迹主要得益于加速推进石化一体化、大规模脱硫维修以及可再生柴油平台,这些措施有助于在汽油需求疲软的情况下保障利润率。那些结合深度转化、数位优化和多元化燃料组合的营运商持续表现优异,而那些依赖单一燃料经济性或缺乏原料柔软性的炼油厂则面临关闭或转型为特殊用途。亚太、中东和部分非洲市场的炼油产能新增最为强劲,这些地区的政府正大力支持下游产业的自给自足和出口目标。同时,经合组织国家的合理化改革以及缺乏与环境、社会和治理(ESG)相关的资本,限制了已开发地区的新建设,加剧了全球对优质原油和稳定裂解价差的竞争。
全球炼油市场趋势与洞察
亚洲对石化原料需求的成长推动了转化设施的升级改造。
亚洲炼油厂正透过整合催化裂解装置和聚丙烯生产线,朝向价值链上游迈进。中国海洋石油总公司(中海油)宁波炼厂的升级改造,每年新增45万吨聚丙烯产能,原油加工能力提升50%,使其能满足国内强劲的化工产品需求。印度也在进行类似的投资,目标是到2030年新增3,500万至4,000万吨产能。石脑油将被转用于芳烃和烯烃的生产。产业整合正在获取更高的石化产品价差,这有助于抵御电动车带来的利润侵蚀,并支撑整个炼油市场的长期获利能力。
IMO 2020 新规实施后,低硫船用燃料亟需维修改造
硫含量上限持续重塑着人们对燃油品质的预期。埃克森美孚在弗利(Foley)的投资项目包括一套加氢处理装置,该装置每年将生产5.7亿加仑低硫柴油。内陆炼油厂也正在维修脱硫装置,以供应更高品质的船用燃料,从而扩大供应基础并改善套利机会。持续流入的监管升级资金正在增强对氢气和催化系统的需求,维持产能柔软性,并为石油炼製市场提供支援。
经合组织国家在净零排放目标下的炼油厂合理化
在欧洲和北美,随着企业调整经营策略以适应气候政策,一些老旧炼油厂正在关闭或改造。道达尔能源公司正在将格兰德普伊炼油厂改造成一个零原油平台,用于生产永续航空燃料和生物聚合物。壳牌公司将于2025年前停止韦瑟林炼油厂的原油加工,并转型生产基础油。这些措施将收紧区域供应,提高剩余炼油厂的运转率,并重塑成品油进口格局,但同时也限制了炼油市场的产能扩张。
细分市场分析
2025年,中馏分油在成品油市场中将维持37.12%的份额,这主要得益于喷射机燃料和柴油市场的復苏,而航空煤油和柴油市场的復苏又受到新兴市场全球旅行需求和货运量復苏的推动。轻馏分油持续受惠于开发中国家汽车保有量的成长,但在成熟市场则面临结构性下滑。重油受到航运和发电业监管趋严的影响,促使企业投资焦化和加氢裂解装置以提升残渣油的品质。预计石化原料领域将以3.85%的复合年增长率实现最高增速,这主要得益于一体化运营商将石脑油和液化石油气转化为高利润聚合物产品链。向化工领域的转型正在推动利润率的稳定,并支撑成品油市场收入基础的扩大。
高度一体化提高了装置的复杂性,增强了原油加工的柔软性,并实现了更多样化的产品组合。中国海洋石油总公司(中海油)宁波聚丙烯项目的扩建以及壳牌公司计划于2028年在海州扩建的项目,凸显了以化工为中心运营的趋势。这些计划扩大了高转换率炼油设备的市场规模,并保障了电动车取代汽油需求所造成的收入损失。
石油炼製市场报告按产品组合(轻质馏分油、中质馏分油、燃料油及残渣、石化原料)、所有权类型(国家石油公司、综合石油公司、独立/公司炼油商)和地区(北美、欧洲、亚太、南美、中东和非洲)进行细分。市场规模和预测以美元计价。
区域分析
亚太地区的炼油扩张巩固了其主导地位。中国海洋石油总公司(中海油)投资27.4亿美元扩建宁波炼油厂,将使原油加工能力提升至每日24万桶,并新增聚丙烯产能以满足国内塑胶需求。印度计画新增19兆至22兆印度卢比的炼油产能,将支撑其以4%年复合成长率成长的消费需求。在东南亚,越南和印尼正在推动旨在减少对成品油进口依赖的新计画,而日本和韩国则专注于提高营运效率和技术出口。该地区的一体化模式和政府支持将继续推动其炼油市场的扩张。
北美仍然是重要的出口地区。页岩轻质原油供应降低了美国墨西哥湾沿岸炼油厂的原料成本。菲利普斯66公司位于斯威尼的炼油厂升级改造后,能够灵活运营,优先生产汽油和化学原料。瓦莱罗能源公司正在投资54亿美元用于低碳计划,包括可再生柴油,以平衡排放目标和获利能力。在加拿大和墨西哥竞相在政策转变中实现炼油厂现代化之际,美国凭藉着丰富的原料和深水物流网络,在炼油市场保持结构性优势。
欧洲正经历最快速的结构性变革。道达尔能源公司正将其位于格兰德普伊的炼油厂改造为可再生能源中心。壳牌公司正在对其韦瑟林炼油厂进行改造,减少传统产能,同时增加永续航空燃料和基础油的生产。碳定价提高了重质燃料的营运成本,推动了装置改造和氢能的整合。炼油厂关闭造成的供应限制导致从中东和美国的进口量增加,促进了跨大西洋贸易,并扩大了炼油厂市场中倖存炼油厂之间的竞争差距。
其他福利:
- Excel格式的市场预测(ME)表
- 3个月的分析师支持
目录
第一章 引言
- 研究假设和市场定义
- 调查范围
第二章调查方法
第三章执行摘要
第四章 市场情势
- 市场概览
- 市场驱动因素
- 亚洲对石化原料的需求不断成长,推动了转化设施的升级改造。
- IMO 2020新规实施后,低硫船用燃料将引发一波维修
- 透过对中东国家石油公司的下游整合来获得下游利润
- 美国轻质油繁荣推动冷凝油分离器投资
- 俄罗斯乌拉尔原油价格下跌提振欧洲炼油厂利润率。
- 经合组织国家的可再生柴油协同加工奖励措施增加了加氢处理支出
- 市场限制
- 经合组织国家在净零排放目标下的炼油厂合理化
- 新建工厂所需的ESG主导资本日益短缺
- 不稳定的裂解价格上涨会削弱炼油厂的资本报酬率。
- 透过碳定价压缩重油利润率
- 供应链分析
- 技术展望
- 监理展望
- 波特五力模型
- 供应商的议价能力
- 买方的议价能力
- 新进入者的威胁
- 替代品的威胁
- 竞争对手之间的竞争
第五章 市场规模与成长预测
- 按产品配置
- 轻质馏分油(汽油、石脑油)
- 中间馏分油(瓦斯油/柴油、航空煤油/煤油)
- 燃料油和残渣
- 石油化学原料(丙烯、芳烃化合物)
- 所有权
- 国家石油公司(NOC)
- 综合石油公司(IOC)
- 独立/公司炼油商
- 按地区
- 北美洲
- 美国
- 加拿大
- 墨西哥
- 欧洲
- 英国
- 德国
- 法国
- 西班牙
- 北欧国家
- 俄罗斯
- 其他欧洲地区
- 亚太地区
- 中国
- 印度
- 日本
- 韩国
- 马来西亚
- 泰国
- 印尼
- 越南
- 澳洲
- 亚太其他地区
- 南美洲
- 巴西
- 阿根廷
- 哥伦比亚
- 其他南美洲
- 中东和非洲
- 阿拉伯聯合大公国
- 沙乌地阿拉伯
- 南非
- 埃及
- 其他中东和非洲地区
- 北美洲
第六章 竞争情势
- 市场集中度
- 策略性倡议(併购、联盟、购电协议)
- 市场占有率分析(主要企业的市场排名和份额)
- 公司简介
- Exxon Mobil Corporation
- Sinopec Corp.
- Shell plc
- Saudi Aramco
- BP plc
- Chevron Corporation
- Valero Energy Corp.
- Marathon Petroleum Corp.
- Phillips 66
- Indian Oil Corporation Ltd.
- Rosneft PJSC
- CNPC
- TotalEnergies SE
- PKN Orlen SA
- Petrobras SA
- ENOC
- Reliance Industries Ltd.
- Petron Corp.
- PETRONAS
- Bharat Petroleum Corporation Limited
第七章 市场机会与未来展望
The Oil Refining Market was valued at USD 62.5 billion in 2025 and estimated to grow from USD 64.44 billion in 2026 to reach USD 75.08 billion by 2031, at a CAGR of 3.11% during the forecast period (2026-2031).
This forward trajectory stems from refiners' accelerated push into petrochemical integration, large-scale desulfurization retrofits, and renewable diesel platforms that help shield margins from soft gasoline demand. Operators that combine conversion depth, digital optimization, and diversified fuel slates continue to outperform, while plants locked into single-fuel economics or lacking feedstock flexibility are closing or converting to specialty uses. Refinery throughput growth remains strongest in the Asia-Pacific, the Middle East, and select African markets, where governments support downstream self-sufficiency and export ambitions. Simultaneously, OECD rationalization and ESG-linked capital scarcity limit green-field build in developed regions, intensifying the global contest for high-quality barrels and resilient cracks.
Global Oil Refining Market Trends and Insights
Petro-chemical feed-stock push in Asia bolstering conversion upgrades
Asia's refiners integrate catalytic crackers and polypropylene lines to move up the value chain. CNOOC's Ningbo upgrade added 450,000 tpy polypropylene capacity and lifted crude runs by 50%, giving the complex access to robust domestic chemical demand. Similar investments in India aim to target 35-40 million tonnes of new capacity by 2030, with naphtha being directed to aromatic and olefin chains. Integration protects margins from erosion driven by electric vehicles, while capturing higher petrochemical spreads that underpin long-term earnings resilience across the oil refining market.
Low-sulfur marine fuels post-IMO 2020 triggering desulfurization retrofits
The sulfur cap continues to reshape fuel quality expectations. ExxonMobil's Fawley investment includes a hydrotreater that produces 570 million gallons of low-sulfur diesel annually. Inland refiners also retrofit desulfurizers to supply premium bunker fuel, expanding geographic supply and improving arbitrage options. Sustained capital inflows toward compliance upgrades reinforce demand for hydrogen and catalyst systems, sustaining throughput flexibility and supporting the oil refining market.
OECD refinery rationalisation under net-zero targets
Europe and North America are closing or repurposing older plants as firms align with climate policies. TotalEnergies is converting Grandpuits into a zero-crude platform producing sustainable aviation fuel and biopolymers. Shell will end crude runs at Wesseling by 2025, shifting to base oils. These actions tighten regional supply, elevate utilization at surviving sites, and reshape product import patterns, yet cap capacity growth within the oil refining market.
Other drivers and restraints analyzed in the detailed report include:
- Middle-East NOCs' forward integration capturing downstream margins
- U.S. light-tight oil boom driving condensate splitter investments
- Rising ESG-driven capital scarcity for green-field plants
For complete list of drivers and restraints, kindly check the Table Of Contents.
Segment Analysis
Middle distillates retained a 37.12% oil refining market share in 2025, as jet fuel and diesel recovered alongside global travel and emerging-market freight. Light distillates continue to benefit from rising vehicle ownership in developing economies, yet face structural declines in mature regions. Heavy fuel oil struggles with stricter marine and power regulations, prompting investments in cokers and hydrocrackers to upgrade residues. The petrochemical feedstock category grows at the fastest rate, with a 3.85% CAGR, as integrated operators channel naphtha and LPG into high-margin polymer chains. The chemicals pivot enhances margin stability and supports a broader revenue base within the oil refining market.
Greater integration increases unit complexity, enhancing crude flexibility and enabling the selection of a diverse slate. CNOOC's polypropylene addition in Ningbo and Shell's Huizhou expansion, scheduled for 2028, highlight the trend toward operations centered on chemicals. Such projects expand the oil refining market size for high-conversion assets and shield earnings from gasoline displacement by electric vehicles.
The Oil Refining Market Report is Segmented by Product Slate (Light Distillates, Middle Distillates, Fuel Oil and Residuals, and Petro-Chemical Feed-Stocks), Ownership (National Oil Companies, Integrated Oil Companies, and Independent/Merchant Refiners), and Geography (North America, Europe, Asia-Pacific, South America, and Middle East and Africa). The Market Size and Forecasts are Provided in Terms of Revenue (USD).
Geography Analysis
Asia-Pacific's refining complex expansion underpins its leadership. CNOOC's USD 2.74 billion Ningbo upgrade lifted crude runs to 240,000 bpd, adding polypropylene units to meet domestic plastics demand. India's planned capacity builds worth INR 1.9-2.2 lakh crore support sustained supply as consumption expands at 4% CAGR. Southeast Asia is seeing new projects in Vietnam and Indonesia aimed at reducing product import dependence, while Japan and South Korea are focusing on high-efficiency operations and technology exports. The region's integrated models and government backing continue to enlarge the oil refining market.
North America remains a pivotal exporter. Shale-driven light crude availability reduces feedstock costs for Gulf Coast refineries. Phillips 66's Sweeny upgrades allow flexible runs that favor gasoline and chemical feedstock production. Valero channels USD 5.4 billion into low-carbon projects, including renewable diesel, to balance emissions objectives with margin capture. Canada and Mexico vie to modernize their assets amid policy shifts, yet the U.S. maintains a structural advantage in the oil refining market through its abundant feedstocks and deepwater logistics networks.
Europe experiences the fastest structural change. TotalEnergies converts Grandpuits to a renewable platform, while Shell repurposes Wesseling, removing conventional capacity yet adding sustainable aviation and base-oil output. Carbon pricing increases operating costs for heavy-fuel streams, incentivizing the conversion of units and the integration of hydrogen. Supply tightness from closures increases imports from the Middle East and the United States, elevating trans-Atlantic trade and reinforcing competitiveness gaps among surviving plants within the oil refining market.
- Exxon Mobil Corporation
- Sinopec Corp.
- Shell plc
- Saudi Aramco
- BP plc
- Chevron Corporation
- Valero Energy Corp.
- Marathon Petroleum Corp.
- Phillips 66
- Indian Oil Corporation Ltd.
- Rosneft PJSC
- CNPC
- TotalEnergies SE
- PKN Orlen SA
- Petrobras SA
- ENOC
- Reliance Industries Ltd.
- Petron Corp.
- PETRONAS
- Bharat Petroleum Corporation Limited
Additional Benefits:
- The market estimate (ME) sheet in Excel format
- 3 months of analyst support
TABLE OF CONTENTS
1 Introduction
- 1.1 Study Assumptions & Market Definition
- 1.2 Scope of the Study
2 Research Methodology
3 Executive Summary
4 Market Landscape
- 4.1 Market Overview
- 4.2 Market Drivers
- 4.2.1 Petro-chemical feed-stock push in Asia bolstering conversion upgrades
- 4.2.2 Low-sulfur marine fuels post-IMO 2020 triggering desulfurization retrofit wave
- 4.2.3 Middle-East NOCs' forward integration capturing downstream margins
- 4.2.4 U.S. light-tight oil boom driving condensate-splitter investments
- 4.2.5 Discounted Russian Urals stimulating European complex refinery margins
- 4.2.6 Renewable diesel co-processing incentives in OECD raising hydro-treating spend
- 4.3 Market Restraints
- 4.3.1 OECD refinery rationalization under net-zero targets
- 4.3.2 Rising ESG-driven capital scarcity for green-field plants
- 4.3.3 Volatile crack?spreads eroding ROCE for merchant refiners
- 4.3.4 Carbon-pricing schemes compressing heavy-fuel margins
- 4.4 Supply-Chain Analysis
- 4.5 Technological Outlook
- 4.6 Regulatory Outlook
- 4.7 Porter's Five Forces
- 4.7.1 Bargaining Power of Suppliers
- 4.7.2 Bargaining Power of Buyers
- 4.7.3 Threat of New Entrants
- 4.7.4 Threat of Substitutes
- 4.7.5 Competitive Rivalry
5 Market Size & Growth Forecasts
- 5.1 By Product Slate
- 5.1.1 Light Distillates (Gasoline, Naphtha)
- 5.1.2 Middle Distillates (Diesel/Gasoil, Jet/Kero)
- 5.1.3 Fuel Oil and Residuals
- 5.1.4 Petro-chemical Feed-stocks (Propylene, Aromatics)
- 5.2 By Ownership
- 5.2.1 National Oil Companies (NOCs)
- 5.2.2 Integrated Oil Companies (IOCs)
- 5.2.3 Independent/Merchant Refiners
- 5.3 By Geography
- 5.3.1 North America
- 5.3.1.1 United States
- 5.3.1.2 Canada
- 5.3.1.3 Mexico
- 5.3.2 Europe
- 5.3.2.1 United Kingdom
- 5.3.2.2 Germany
- 5.3.2.3 France
- 5.3.2.4 Spain
- 5.3.2.5 Nordic Countries
- 5.3.2.6 Russia
- 5.3.2.7 Rest of Europe
- 5.3.3 Asia-Pacific
- 5.3.3.1 China
- 5.3.3.2 India
- 5.3.3.3 Japan
- 5.3.3.4 South Korea
- 5.3.3.5 Malaysia
- 5.3.3.6 Thailand
- 5.3.3.7 Indonesia
- 5.3.3.8 Vietnam
- 5.3.3.9 Australia
- 5.3.3.10 Rest of Asia-Pacific
- 5.3.4 South America
- 5.3.4.1 Brazil
- 5.3.4.2 Argentina
- 5.3.4.3 Colombia
- 5.3.4.4 Rest of South America
- 5.3.5 Middle East and Africa
- 5.3.5.1 United Arab Emirates
- 5.3.5.2 Saudi Arabia
- 5.3.5.3 South Africa
- 5.3.5.4 Egypt
- 5.3.5.5 Rest of Middle East and Africa
- 5.3.1 North America
6 Competitive Landscape
- 6.1 Market Concentration
- 6.2 Strategic Moves (M&A, Partnerships, PPAs)
- 6.3 Market Share Analysis (Market Rank/Share for key companies)
- 6.4 Company Profiles (includes Global level Overview, Market level overview, Core Segments, Financials as available, Strategic Information, Products & Services, and Recent Developments)
- 6.4.1 Exxon Mobil Corporation
- 6.4.2 Sinopec Corp.
- 6.4.3 Shell plc
- 6.4.4 Saudi Aramco
- 6.4.5 BP plc
- 6.4.6 Chevron Corporation
- 6.4.7 Valero Energy Corp.
- 6.4.8 Marathon Petroleum Corp.
- 6.4.9 Phillips 66
- 6.4.10 Indian Oil Corporation Ltd.
- 6.4.11 Rosneft PJSC
- 6.4.12 CNPC
- 6.4.13 TotalEnergies SE
- 6.4.14 PKN Orlen SA
- 6.4.15 Petrobras SA
- 6.4.16 ENOC
- 6.4.17 Reliance Industries Ltd.
- 6.4.18 Petron Corp.
- 6.4.19 PETRONAS
- 6.4.20 Bharat Petroleum Corporation Limited
7 Market Opportunities & Future Outlook
- 7.1 White-space & Unmet-Need Assessment
 炼油和石化过滤市场:2026-2032年全球市场预测(按应用、过滤介质介质、过滤技术、设备类型和最终用途行业划分)
 全球石油炼製市场规模、份额、趋势和成长分析报告(2026-2034)
 2026年全球炼油和石化过滤器市场报告炼油製程添加剂市场按类型、原料、应用和最终用户划分 - 全球预测 2026-2032锅炉製程添加剂市场按产品类型、锅炉类型、给水来源、应用、最终用途产业和分销管道划分-全球预测,2026-2032年
 石油炼製市场规模、份额和成长分析(按复杂程度、产品类型、製程类型、炼厂产能、最终用户和地区划分)-2026-2033年产业预测
 全球炼油和石化过滤市场(按过滤器类型、应用、最终用户和地区划分)- 预测至 2030 年
 全球炼油市场
 2025-2029年全球精製市场
 炼油厂和石化过滤市场-全球产业规模、份额、趋势、机会和预测(按类型、应用、地区和竞争细分,2020-2030 年)