


 |
市场调查报告书
商品编码
1906025
印度油气上游:市场占有率分析、产业趋势与统计、成长预测(2026-2031)India Oil And Gas Upstream - Market Share Analysis, Industry Trends & Statistics, Growth Forecasts (2026 - 2031) |
||||||
※ 本网页内容可能与最新版本有所差异。详细情况请与我们联繫。
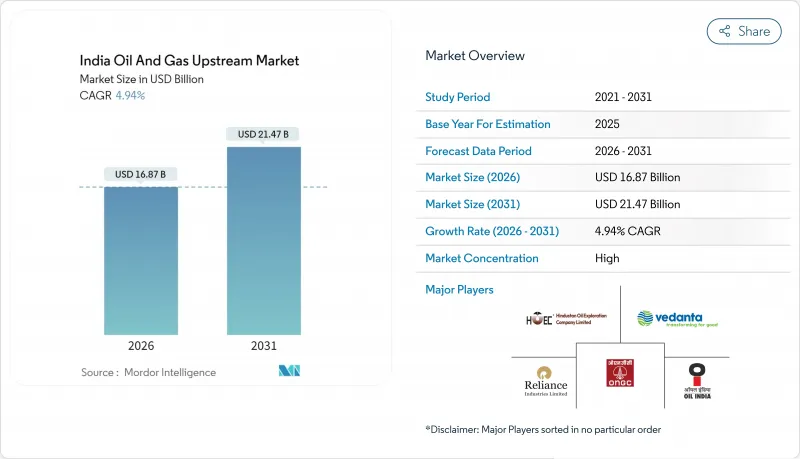
印度上游油气市场预计将从 2025 年的 160.8 亿美元成长到 2026 年的 168.7 亿美元,预计到 2031 年将达到 214.7 亿美元,2026 年至 2031 年的复合年增长率为 4.94%。
强有力的政策支持、数位化油田的普及以及提高采收率(EOR)计划的推进,正在抵消地质复杂性带来的限制,使营运商能够从成熟油田中开采更多石油,从而减缓进口成长。资本正转向深水探勘计划,大规模发现可以与现有基础设施连接,但随着印度第一代海上平台接近使用寿命终点,一波退役合约正在涌现。私人公司正在采用灵活的钻井和完井技术,而国有企业则透过区块持有和现有基础设施保持战略控制。钻井平台、支撑剂和海底设备的供应链瓶颈仍然是主要的营运挑战,但随着「印度製造」政策下国内製造业的扩张,这些瓶颈正在逐步缓解。
印度油气上游市场趋势与分析
国内产量下降推动了提高采收率投资
随着国内油气产量从2017财年的3,600万吨下降到2024财年的2,940万吨,业者显然有充分的奖励在成熟储存中采用强化采油(ASP)、聚合物注入和混合气体注入技术。凯恩石油天然气公司在2025年4月的股东报告中累计,将投入10亿美元用于其拉贾斯坦邦油田的全油田强化采油(ASP)实施,目标是将采收率提高15%至20%。在阿萨姆邦的拉克瓦油田和古吉拉突邦的卡罗尔油田试验计画已证实,日产量增加了4000至6000桶,显示该方法在印度430个成熟油田中具有可重复的成效。由于大部分地面基础设施已经到位,营运商目前正将强化采油(EOR)定位为比风险更高的前沿探勘更有利可图的替代方案,从而将投资回收期缩短至不到四年。
扩大石油和天然气勘探和特许权政策(OALP)竞标轮次和HELP奖励
印度的《油气探勘与许可政策》(HELP)使印度得以从成本回收的生产分成体系过渡到透明的收益分成体系,解决了审核争议,并全面开放了天然气销售。据印度油气总局称,自2018年以来,已进行了九轮开放式油气勘探许可(OALP)竞标,共授予134个区块,承诺的工作计划价值13.7亿美元。 BP和埃尼等主要企业已获得即将进行的第十轮招标的资格预审,它们被涵盖常规和非常规资源的统一许可条款所吸引。开放式区块模式允许竞标根据其勘探目标设定多边形区块,无需等待政府指定的竞标地图,从而加快了区块获取週期。
成熟陆上盆地的地质复杂性
拉贾斯坦邦巴尔默尔山脉的储存非均质性以及阿萨姆邦的裂隙碳酸盐岩,使得多级水力压裂和高密度垂直测井成为必要,钻井成本比传统油井高出一倍。印度油气总局已将60多个渗透率低于1mD的勘探油田归类为「緻密油」。储存品质的不确定性增加了钻井失败的风险,迫使作业者在钻井过程中预先采购完井设备,从而占用资金并推高油田的损益平衡点。此外,在杰伊瑟尔梅尔等干旱地区,压裂作业用水的取得也需要加强环境监测。
细分市场分析
2025年,海上油田收入占总收入的46.22%,但预计到2031年,由于深水回接计画投资回收期缩短,海上油田收入将以6.32%的复合年增长率超过陆上油田。印度上游油气市场规模(仅海上油田)预计将从2025年的74.3亿美元成长到2031年的107.3亿美元。同时,陆上油田虽然仍占据重要地位,但由于大多数易采资源已被耗尽,预计其产量将趋于稳定,复合年增长率仅3.56%。
海上成长要素包括印度石油天然气公司(ONGC)的KG-DWN-98/2丛集、信实工业(Reliance)和英国石油公司(BP)的MJ油田及其卫星油田开发项目,以及印度石油公司(Oil India)和巴西石油公司(Petrobras)在马哈纳迪盆地的合资项目。海底增压帮浦、多相帮浦和长距离回接管道的应用正在降低单位生产成本,即使在水深超过1500公尺的情况下也是如此。潘纳穆克塔塔普蒂(Panna Mukta Tapti)平台的退役表明监管机构有能力管理报废责任,这鼓励了那些关注报废义务的新进入者。拥有成熟基础设施的陆上油气机会仍然具有吸引力,但严格的用水限制和土地使用权延迟可能会减缓近期成长。
儘管原油在2025年仍维持了67.45%的收入份额,但随着天然气产量成长以实现国家初级能源占15%的目标,预计到2031年,天然气相关收入将占34.80%。根据「能源、环境和生活改善计画」(HELP)获得许可的富含天然气的区块将推动印度上游油气市场规模(天然气产业)在2025年达到52.3亿美元,年复合成长率(CAGR)为6.88%。这一增速超过了石油业4.18%的成长率,反映了政策奖励和脱碳进程的推动。
基础建设,包括扩建全国天然气管网和新建295座压缩天然气(CNG)加气站,将确保天然气需求稳定。天然气生产商将可自由出售自2016年以来发现的高达6兆立方英尺(Tcf)的天然气产量,从而避免传统价格上限对收入的影响。同时,以石油为主的资产依赖于提高采收率(EOR)投资来限制减产,这增加了成本并限制了利润成长。联产气货币化仍然是一个尚未充分利用的途径,仅印度石油天然气公司(ONGC)的孟买高地火炬回流计划预计在完工后每天就能贡献4亿立方英尺(Bcf/d)的伴生气,从而增强其均衡的油气投资组合。
其他福利:
- Excel格式的市场预测(ME)表
- 分析师支持(3个月)
目录
第一章 引言
- 研究假设和市场定义
- 调查范围
第二章调查方法
第三章执行摘要
第四章 市场情势
- 市场概览
- 市场驱动因素
- 国内产量下降推动了提高采收率投资
- 扩大OALP竞标轮次和HELP奖励
- 天然气价格指数化改革改善了计划经济效益
- 印度大型IT公司主导油田数位转型
- 市场限制
- 成熟陆上盆地的地质复杂性
- 冗长的环境和土地征用核准程序
- 国内压裂支撑剂供应短缺
- 供应链分析
- 技术展望
- 监管环境
- 原油产量和消费量预测
- 天然气生产与消费预测
- 非传统资源资本支出展望(緻密油、油砂、深水)
- 波特五力模型
- 新进入者的威胁
- 供应商的议价能力
- 买方的议价能力
- 替代品的威胁
- 竞争强度
- PESTEL 分析
第五章 市场规模与成长预测
- 按安装位置
- 陆上
- 离岸
- 按资源类型
- 原油
- 天然气
- 按井类型
- 传统的
- 传统型
- 透过服务
- 探勘
- 开发与生产
- 退休
第六章 竞争情势
- 市场集中度
- 策略性倡议(併购、伙伴关係、购电协议)
- 市场占有率分析(主要企业的市场排名和份额)
- 公司简介
- Oil & Natural Gas Corporation
- Oil India Ltd
- Vedanta Ltd(Cairn O&G)
- Reliance Industries
- BP plc
- Hindustan Oil Exploration Co.
- Bharat PetroResources Ltd
- Essar Oil & Gas Exploration
- Adani Welspun Exploration
- Sun Petrochemicals
- GAIL(E&P)
- Shell India(BG Exploration)
- Joshi Technologies Int'l
- Deep Industries Ltd
- Jindal Drilling & Industries
- Larsen & Toubro Ltd(L&T)
- Hindustan Construction Co.
- Halliburton India
- Schlumberger India
- Baker Hughes India
第七章 市场机会与未来展望
The India Oil And Gas Upstream Market is expected to grow from USD 16.08 billion in 2025 to USD 16.87 billion in 2026 and is forecast to reach USD 21.47 billion by 2031 at 4.94% CAGR over 2026-2031.
Strong policy support, digital oilfield rollouts, and enhanced oil recovery (EOR) projects offset the drag from geological complexity, enabling operators to extract additional barrels from maturing assets and thereby slowing import growth. Capital is shifting toward deepwater prospects, where large discoveries can be tied back to existing infrastructure, while a wave of decommissioning contracts emerges as India's first generation of offshore platforms nears the end of their life. Private companies introduce agile drilling and completion technologies, yet state-owned enterprises retain strategic control through acreage holdings and legacy infrastructure. Supply-chain bottlenecks in rigs, proppants, and subsea equipment remain the principal operational headwinds but are gradually easing as domestic manufacturing expands under "Make in India" mandates.
India Oil And Gas Upstream Market Trends and Insights
Declining Domestic Output Spurring EOR Investments
National oil output fell from 36 million tonnes in FY2017 to 29.4 million tonnes in FY2024, creating a clear incentive for operators to deploy ASP, polymer, and miscible-gas flooding in mature reservoirs. Cairn Oil & Gas has earmarked USD 1 billion to retrofit its Rajasthan fields with full-field ASP, targeting a 15-20% uplift in recovery factors as per its April 2025 shareholder presentation. Pilot programs in Assam's Lakwa and Gujarat's Kalol fields recorded incremental gains of 4,000-6,000 barrels per day, demonstrating replicable gains across India's 430 mature fields. Operators now view EOR as a margin-accretive alternative to risky frontier exploration because most surface facilities are already in place, shortening payback periods to under four years.
Expansion of OALP Bid Rounds & HELP Incentives
The Hydrocarbon Exploration & Licensing Policy (HELP) has transitioned India from a cost-recovery production-sharing regime to a transparent revenue-sharing system, thereby eliminating audit disputes while granting full marketing freedom for gas. Since 2018, nine OALP rounds have cumulatively awarded 134 blocks and attracted work-program commitments worth USD 1.37 billion, according to the Directorate General of Hydrocarbons. Major industry players, such as BP and Eni, have pre-qualified for the upcoming Round X, enticed by unified license terms that cover both conventional and unconventional resources. The open-acreage model allows bidders to carve out prospect-specific polygons instead of waiting for government-curated bid maps, thereby accelerating acreage acquisition cycles.
Geological Complexity of Mature Onshore Basins
Reservoir heterogeneity in Rajasthan's Barmer-Hill and Assam's fractured carbonates requires multi-stage hydraulic fracturing and high-density vertical logging, which doubles drilling costs compared to vintage wells. The Directorate General of Hydrocarbons lists more than 60 prospects with permeability below 1 mD, classifying them as tight oil. Reservoir-quality uncertainty elevates failure risk and forces operators to pre-commit completion hardware while drilling, tying up capital and inflating field-level break-evens. Water sourcing for frac jobs also raises environmental scrutiny in arid districts such as Jaisalmer.
Other drivers and restraints analyzed in the detailed report include:
- Gas-Price Indexation Reforms Improving Project Economics
- Digital-Oilfield Adoption Led by Indian IT Majors
- Prolonged Environmental & Land-Acquisition Approvals
For complete list of drivers and restraints, kindly check the Table Of Contents.
Segment Analysis
Offshore fields delivered 46.22% of 2025 revenue, yet they are set to outpace onshore operations with a 6.32% CAGR through 2031 as deepwater tie-backs shorten payback periods. The India oil & gas upstream market size derived from offshore alone is projected to grow from USD 7.43 billion in 2025 to USD 10.73 billion by 2031. Meanwhile, the onshore domain, although still larger, faces a plateauing output at a 3.56% CAGR because most low-hanging resources have already been drained.
The offshore growth narrative is based on ONGC's KG-DWN-98/2 cluster, Reliance-BP's MJ and Satellite developments, and the collaboration between Oil India and Petrobras in the Mahanadi Basin. Sub-sea boosting, multiphase pumping, and long-tie-back pipelines reduce unit lifting costs, even in water depths exceeding 1,500 meters. Decommissioning of the Panna-Mukta-Tapti platforms also demonstrates the regulator's capacity to manage late-life liabilities, encouraging new entrants wary of end-of-life obligations. Onshore opportunities remain attractive where mature infrastructure exists; however, stringent water-use restrictions and land-access delays can dilute near-term growth.
Crude oil retained a 67.45% revenue share in 2025; however, natural-gas-linked revenue is expected to capture 34.80% by 2031 as gas output increases to meet the national goal of a 15% primary-energy share. Gas-rich blocks licensed under HELP contribute to an India oil & gas upstream market size of USD 5.23 billion in 2025 for gas, expanding at a 6.88% CAGR. This acceleration outpaces oil, which grows at 4.18%, mirroring policy incentives and lower carbon intensity.
Enabling infrastructure, including the National Gas Grid extension and 295 new CNG stations, creates offtake certainty. Gas producers enjoy marketing freedom for volumes up to 6 Tcf discovered post-2016, shielding returns from legacy price caps. Conversely, oil-focused assets rely on EOR spending to stem declines, adding cost layers that curb margin upside. Associated-gas monetization remains an under-exploited lever; ONGC's Mumbai High flare-back project alone could contribute 0.4 Bcf/d once completed, reinforcing balanced oil-gas portfolios.
The India Oil and Gas Upstream Market Report is Segmented by Location of Deployment (Onshore and Offshore), Resource Type (Crude Oil and Natural Gas), Well Type (Conventional and Unconventional), and Service (Exploration, Development and Production, and Decommissioning). The Market Sizes and Forecasts are Provided in Terms of Value (USD).
List of Companies Covered in this Report:
- Oil & Natural Gas Corporation
- Oil India Ltd
- Vedanta Ltd (Cairn O&G)
- Reliance Industries
- BP plc
- Hindustan Oil Exploration Co.
- Bharat PetroResources Ltd
- Essar Oil & Gas Exploration
- Adani Welspun Exploration
- Sun Petrochemicals
- GAIL (E&P)
- Shell India (BG Exploration)
- Joshi Technologies Int'l
- Deep Industries Ltd
- Jindal Drilling & Industries
- Larsen & Toubro Ltd (L&T)
- Hindustan Construction Co.
- Halliburton India
- Schlumberger India
- Baker Hughes India
Additional Benefits:
- The market estimate (ME) sheet in Excel format
- 3 months of analyst support
TABLE OF CONTENTS
1 Introduction
- 1.1 Study Assumptions & Market Definition
- 1.2 Scope of the Study
2 Research Methodology
3 Executive Summary
4 Market Landscape
- 4.1 Market Overview
- 4.2 Market Drivers
- 4.2.1 Declining domestic output spurring EOR investments
- 4.2.2 Expansion of OALP bid rounds & HELP incentives
- 4.2.3 Gas-price indexation reforms improving project economics
- 4.2.4 Digital-oilfield adoption led by Indian IT majors
- 4.3 Market Restraints
- 4.3.1 Geological complexity of mature onshore basins
- 4.3.2 Prolonged environmental & land-acquisition approvals
- 4.3.3 Shortage of fracking-grade domestic proppant supply
- 4.4 Supply-Chain Analysis
- 4.5 Technological Outlook
- 4.6 Regulatory Landscape
- 4.7 Crude-Oil Production & Consumption Outlook
- 4.8 Natural-Gas Production & Consumption Outlook
- 4.9 Unconventional Resources CAPEX Outlook (tight oil, oil sands, deep-water)
- 4.10 Porter's Five Forces
- 4.10.1 Threat of New Entrants
- 4.10.2 Bargaining Power of Suppliers
- 4.10.3 Bargaining Power of Buyers
- 4.10.4 Threat of Substitutes
- 4.10.5 Intensity of Rivalry
- 4.11 PESTLE Analysis
5 Market Size & Growth Forecasts
- 5.1 By Location of Deployment
- 5.1.1 Onshore
- 5.1.2 Offshore
- 5.2 By Resource Type
- 5.2.1 Crude Oil
- 5.2.2 Natural Gas
- 5.3 By Well Type
- 5.3.1 Conventional
- 5.3.2 Unconventional
- 5.4 By Service
- 5.4.1 Exploration
- 5.4.2 Development and Production
- 5.4.3 Decomissioning
6 Competitive Landscape
- 6.1 Market Concentration
- 6.2 Strategic Moves (M&A, Partnerships, PPAs)
- 6.3 Market Share Analysis (Market Rank/Share for key companies)
- 6.4 Company Profiles (includes Global level Overview, Market level overview, Core Segments, Financials as available, Strategic Information, Products & Services, and Recent Developments)
- 6.4.1 Oil & Natural Gas Corporation
- 6.4.2 Oil India Ltd
- 6.4.3 Vedanta Ltd (Cairn O&G)
- 6.4.4 Reliance Industries
- 6.4.5 BP plc
- 6.4.6 Hindustan Oil Exploration Co.
- 6.4.7 Bharat PetroResources Ltd
- 6.4.8 Essar Oil & Gas Exploration
- 6.4.9 Adani Welspun Exploration
- 6.4.10 Sun Petrochemicals
- 6.4.11 GAIL (E&P)
- 6.4.12 Shell India (BG Exploration)
- 6.4.13 Joshi Technologies Int'l
- 6.4.14 Deep Industries Ltd
- 6.4.15 Jindal Drilling & Industries
- 6.4.16 Larsen & Toubro Ltd (L&T)
- 6.4.17 Hindustan Construction Co.
- 6.4.18 Halliburton India
- 6.4.19 Schlumberger India
- 6.4.20 Baker Hughes India
7 Market Opportunities & Future Outlook
- 7.1 White-space & Unmet-need Assessment


