


 |
市场调查报告书
商品编码
1906872
矿业化学品:市场占有率分析、产业趋势与统计、成长预测(2026-2031)Mining Chemicals - Market Share Analysis, Industry Trends & Statistics, Growth Forecasts (2026 - 2031) |
||||||
※ 本网页内容可能与最新版本有所差异。详细情况请与我们联繫。
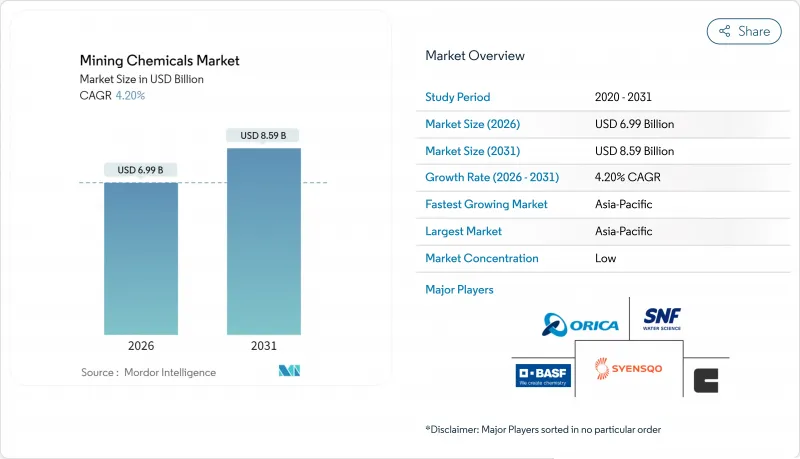
预计矿业化学品市场将从 2025 年的 67.1 亿美元成长到 2026 年的 69.9 亿美元,到 2031 年将达到 85.9 亿美元,2026 年至 2031 年的复合年增长率为 4.2%。
电池金属需求的成长、日益严格的环境法规以及加速的能源转型,正推动采购决策转向更具选择性、更环保高效的试剂配方,以提高金属回收率并降低水和电力消耗。亚太地区仍是主要的生产基地,而北美地区对新产能和湿式冶金的策略投资则支撑着其他矿业化学品市场需求的稳定成长。儘管浮选试剂仍然是收入的主要来源,但成长势头最强劲的是溶剂萃取试剂,它能够实现锂、镍、钴和稀土元素的低碳製程。市场竞争适中。现有供应商透过併购和数位化优化来捍卫市场份额,而小规模的新参与企业则利用生物基化学品和干式加工助剂,在矿业化学品市场中开闢尚未开发的细分市场。
全球矿业化学品市场趋势与洞察
亚太和北美地区的矿业资本投资增加
美国矿业化学品市场对试剂的需求强劲。仅在澳大利亚,资源出口收入预计在2024-2025年就将达到3800亿美元,不断增长的铜、锂和镍新计划储备推动了浮选、浸出和水处理试剂包的竞标增长。铜冶炼厂的加工率在2024年转为负值,显示精矿供应紧张,并刺激了依赖高纯度溶剂抽取剂的新型湿式冶金投资。金融分析师估计,广泛的工业资本支出週期每年将向基础设施注入2.5兆至5兆美元,透过增加对关键矿物的需求,间接增强矿业化学品市场。随着营运商在新资产中实现工厂化学製程的标准化,能够整合数位化计量控制和专业配方的供应商正在赢得长期供应合约。
电动车和可再生能源电网推动矿产需求激增
预计2024年运作的电池超级工厂将使美国电池产量增加40%,加速锂、镍和钴的单位需求,并使全球矿产需求预测值在2030年达到三倍。每增加锂辉石或红土的加工量,化学试剂的消耗量将比传统基底金属冶炼製程高出40%至200%,这推动了整个矿业化学品市场对溶剂萃取和结晶试剂的需求。同时,电池製造商向磷酸锂铁和钠离子电池技术转型,带来了新的製程控制挑战,需要客製化的螯合剂。由于地缘政治摩擦可能导致关键矿产供应中断,人们日益担忧,矿业公司正在签订多年试剂合约以降低供应风险,这进一步巩固了矿业化学品市场的结构性成长。
加强对有毒试剂的全球监管
世界各国政府现已要求氰化物、汞和黄原酸盐使用者按照严格的监管法规进行註册,这些法规要求持续监测、紧急时应对计画并为矿场关闭后的水处理提供财务担保。 《国际氰化物控制规范》和美国土地管理局关于长期处理资金的新规则正在增加合规成本。欧洲监管机构正在考虑进一步禁止使用全氟烷基和多氟烷基物质(PFAS)泡沫,这将加速矿业化学品市场向替代界面活性剂的转型。供应商被迫在重新配製产品和麵临市场进入限制之间做出选择,这将减缓短期成长,但将促进长期创新。
细分市场分析
预计到2025年,浮选化学品将占矿业化学品市场份额的55.30%,在从日益复杂的矿石中分离铜、锌和贵金属硫化物方面发挥至关重要的作用。捕收剂占据了市场的大部分收入,其次是抑制剂、凝聚剂、发泡剂和分散剂,这些产品用于调节矿浆化学成分,以实现最佳动态效果。与传统的黄原胶基化学品相比,Syensqo的AEROPHINE系列等优质捕收剂在用量降低高达30%的情况下即可提高选择性,因此备受寻求成本节约和符合ESG(环境、社会和治理)要求的矿业公司的青睐。抑制剂可防止硫化铁的稀释作用,而合成发泡剂则可稳定粗粒浮选迴路中的气泡尺寸。在矿业化学品市场中,由于矿石品位下降,需要进行更精细的研磨并添加更多化学品以维持回收率,因此预计浮选化学品市场将稳定成长。
抽取剂、稀释剂、抽取剂和反萃取液的复合年增长率 (CAGR) 为 4.32%,在各功能领域中增速最高。这一成长趋势主要得益于计画建造的用于锂卤水、镍红土矿和多金属精矿的大规模湿式冶金生产线。BASF的水相冶金平台生产高纯度金属盐所需的能耗比冶炼低 40%,这使得溶剂萃取成为一种极具吸引力的脱碳途径。
矿业化学品报告按功能(浮选化学品、萃取化学品、磨矿助剂)、应用(矿物加工和污水处理)以及地区(亚太地区、北美地区、欧洲地区、南美地区、中东和非洲地区)进行细分。市场预测以美元计价。
区域分析
预计到2025年,亚太地区将维持54.10%的矿业化学品市场份额,主要得益于中国在铜、镍和稀土元素加工领域的领先地位,以及印度大力推进国内矿产资源商业化。中国的锂和镍提炼丛集,加上国家对非洲和拉丁美洲矿山的投资,即使在经济放缓的情况下,也支撑着强劲的需求。
由于华盛顿推出政策保障先进电池和关键矿物的供应链,北美市场蓬勃发展。联邦政府的奖励促成了超过1500亿美元的电池芯和原料计划,从而提振了锂镍钴提取生产线的试剂需求。预计到2024年,加拿大探勘支出将达到41亿美元,中小矿业公司正积极推进稀土元素和关键金属矿床的水冶金试验。
欧洲的产量虽然不高,但创新活动却十分活跃。欧盟《关键材料法》支持国内提炼和回收,促进电池材料循环中特种试剂的应用。BASF和科莱恩从其欧洲工厂供应不含全氟烷基和多氟烷基物质(PFAS)的发泡剂和生物收集剂,提高了区域自给自足能力,并增强了竞争优势。南美洲的锂三角和智利铜矿的扩张发挥着重要作用,而非洲的矿产资源为能够克服基础设施和管治复杂性的供应商提供了成长潜力。中东的需求量小规模,但磷酸盐肥料和铝的垂直整合大型企划表明,某些特定领域存在成长空间。
其他福利:
- Excel格式的市场预测(ME)表
- 分析师支持(3个月)
目录
第一章 引言
- 研究假设和市场定义
- 调查范围
第二章调查方法
第三章执行摘要
第四章 市场情势
- 市场概览
- 市场驱动因素
- 亚太和北美地区的矿业资本投资增加
- 电动车和可再生能源供应链推动矿产需求成长
- 提高大型矿山水循环利用标准
- 商品价格回升为探勘预算提供支持
- 为符合ESG法规,向生物基收集器过渡
- 市场限制
- 加强对有毒试剂的全球监管
- 原油衍生原料成本波动
- 新兴的干式加工技术避免使用湿试剂
- 价值链分析
- 波特五力模型
- 供应商的议价能力
- 买方的议价能力
- 新进入者的威胁
- 替代品的威胁
- 竞争程度
第五章 市场规模与成长预测
- 按功能
- 浮选化学品
- 集电极
- 抑制剂
- 凝聚剂
- 气泡剂
- 分散剂
- 萃取化学品
- 冲淡
- 抽取剂
- 研磨助剂
- 浮选化学品
- 透过使用
- 矿物加工
- 污水处理
- 按地区
- 亚太地区
- 中国
- 印度
- 日本
- 韩国
- 印尼
- 马来西亚
- 澳洲和纽西兰
- 亚太其他地区
- 北美洲
- 美国
- 加拿大
- 墨西哥
- 欧洲
- 德国
- 英国
- 法国
- 义大利
- 俄罗斯
- 其他欧洲地区
- 南美洲
- 巴西
- 阿根廷
- 南美洲其他地区
- 中东和非洲
- 沙乌地阿拉伯
- 南非
- 其他中东和非洲地区
- 亚太地区
第六章 竞争情势
- 市场集中度
- 策略趋势
- 市占率分析
- 公司简介
- BASF
- 3M
- AECI
- Arkema
- Betachem(Pty)Ltd
- Celanese Corporation
- Chevron Phillips Chemical Company LLC
- Clariant
- CTC(Tennant Consolidated Group)
- Ecolab
- FMC Corporation
- Indorama Ventures Public Limited
- Kemira
- NASACO
- Orica Limited
- Qingdao Ruchang Mining Industry Co. Ltd
- Sasol
- SNF Group
- Syensqo
第七章 市场机会与未来展望
The Mining Chemicals Market is expected to grow from USD 6.71 billion in 2025 to USD 6.99 billion in 2026 and is forecast to reach USD 8.59 billion by 2031 at 4.2% CAGR over 2026-2031.
Rising demand for battery metals, stricter environmental regulations, and the accelerated energy transition are steering purchasing decisions toward more selective and eco-efficient reagent formulations that raise metal recovery while cutting water and power use. Asia-Pacific remains the dominant production hub, while new capacity in North America and strategic investments in hydrometallurgy underpin steady offtake growth across the rest of the mining chemicals market. Flotation agents continue to anchor revenue, yet the strongest momentum lies in solvent-extraction reagents that enable low-carbon flowsheets for lithium, nickel, cobalt, and rare earths. Competition is moderate: established suppliers defend share through mergers and acquisitions and digital optimization, whereas smaller entrants deploy bio-based chemistries and dry-processing aids to tap under-served niches in the mining chemicals market.
Global Mining Chemicals Market Trends and Insights
Increasing Mining CAPEX in APAC and North America
United States is translating into brisk reagent demand in the mining chemicals market. Australia alone expects resource export earnings to reach USD 380 billion in 2024-25, and the pipeline of new copper, lithium, and nickel projects is widening reagent tenders for flotation, leaching, and water treatment packages. Copper smelter treatment charges turned negative in 2024, signaling tight concentrate supply and encouraging fresh hydrometallurgical investments that rely on high-purity solvent-extraction agents. Financial analysts estimate that the broader industrial capex cycle could inject USD 2.5-5 trillion annually into infrastructure, indirectly fortifying the mining chemicals market through higher demand for critical minerals. Suppliers capable of bundling digital dosing control with specialty formulations are winning long-term supply contracts as operators standardize plant chemistry across new assets.
Surging Mineral Demand from EV and Renewable-Energy Supply Chains
Battery gigafactories commissioned in 2024 catapulted United States cell output by 40%, accelerating the hunt for lithium, nickel, and cobalt units and inflating global mineral demand forecasts three-fold by 2030. Each incremental tonne of spodumene or laterite processed consumes 40-200% more chemical reagents than legacy base-metal flowsheets, lifting solvent-extraction and crystallization reagent volumes across the mining chemicals market. In parallel, cell makers pivoting to lithium iron phosphate and sodium-ion chemistries are creating fresh process-control challenges that require tailor-made chelating agents. Miners are locking in multi-year reagent contracts to de-risk supply as geopolitical friction raises the specter of critical mineral disruptions, reinforcing structural growth for the mining chemicals market.
Tightening Global Regulations on Toxic Reagents
Governments now compel cyanide, mercury, and xanthate users to register under stricter codes that demand continuous monitoring, emergency response plans, and financial assurance for post-closure water treatment. The International Cyanide Management Code and recent U.S. Bureau of Land Management rules on long-term treatment funds have escalated compliance costs. European regulators consider additional bans on PFAS-based frothers, accelerating the shift toward alternative surfactants across the mining chemicals market. Suppliers must either reformulate or face restricted market access, dampening near-term growth but catalyzing long-run innovation.
Other drivers and restraints analyzed in the detailed report include:
- Stricter Water-Recycling Norms in Large Mines
- Shift to Bio-Based Collectors for ESG Compliance
- Emerging Dry-Processing Technologies That Bypass Wet Reagents
For complete list of drivers and restraints, kindly check the Table Of Contents.
Segment Analysis
Flotation reagents captured 55.30% of the mining chemicals market share in 2025, underscoring their essential role in separating copper, zinc, and precious-metal sulfides from increasingly complex ores. Collectors account for the largest slice of this revenue, followed by depressants, flocculants, frothers, and dispersants that adjust pulp chemistry for optimum kinetics. Premium collectors such as Syensqo's AEROPHINE series deliver improved selectivity at doses up to 30% lower than legacy xanthates, a feature prized by miners seeking both cost savings and ESG compliance. Depressants eliminate iron sulfide dilution, while synthetic frothers stabilize bubble size in coarse-particle flotation circuits. The mining chemicals market size for flotation reagents is forecast to grow steadily on the back of declining ore grades, which force operators to grind finer and add more chemistries to maintain recovery.
Extraction reagents, diluents, extractants, and stripping solutions, are expanding at a 4.32% CAGR, the highest among functional segments. This trajectory stems from large-scale hydrometallurgical lines planned for lithium brines, nickel laterites, and polymetallic concentrates. BASF's hydrometallurgy platform consumes 40% less energy than smelting and yields high-purity metal salts, making solvent extraction an attractive decarbonization pathway.
The Mining Chemicals Report is Segmented by Function (Flotation Chemicals, Extraction Chemicals, and Grinding Aids), Application (Mineral Processing and Wastewater Treatment), and Geography (Asia-Pacific, North America, Europe, South America, and Middle-East and Africa). The Market Forecasts are Provided in Terms of Value (USD).
Geography Analysis
Asia-Pacific maintained a 54.10% revenue hold on the mining chemicals market in 2025 thanks to China's dominant position in copper, nickel, and rare-earth processing as well as India's push to commercialize domestic mineral reserves. China's lithium and nickel refining clusters, coupled with state-backed investments in African and Latin American mines, underpin resilient demand even amid broader economic softening.
North America's market is growing as Washington pursues supply-chain security for advanced batteries and critical minerals. Federal incentives spurred more than USD 150 billion in announced cell and raw-material projects, reinforcing reagent demand in lithium, nickel, and cobalt extraction lines. Canada's exploration spend climbed to USD 4.1 billion in 2024, with junior players driving hydrometallurgy trials for rare-earth and critical-metal deposits.
Europe exhibits modest volume but intensive innovation. The EU Critical Raw Materials Act supports domestic refining and recycling, lifting specialty reagent uptake in battery material loops. BASF and Clariant supply PFAS-free frothers and bio-collectors from European plants, raising regional self-sufficiency and competitive differentiation. South America's lithium triangle and Chilean copper expansions secure a pivotal role, while Africa's mineral wealth offers upside for suppliers able to navigate infrastructure and governance complexities. Middle East demand is minor, yet vertically integrated mega-projects in phosphate fertilizers and aluminum point to selective growth pockets.
- BASF
- 3M
- AECI
- Arkema
- Betachem (Pty) Ltd
- Celanese Corporation
- Chevron Phillips Chemical Company LLC
- Clariant
- CTC (Tennant Consolidated Group)
- Ecolab
- FMC Corporation
- Indorama Ventures Public Limited
- Kemira
- NASACO
- Orica Limited
- Qingdao Ruchang Mining Industry Co. Ltd
- Sasol
- SNF Group
- Syensqo
Additional Benefits:
- The market estimate (ME) sheet in Excel format
- 3 months of analyst support
TABLE OF CONTENTS
1 Introduction
- 1.1 Study Assumptions and Market Definition
- 1.2 Scope of the Study
2 Research Methodology
3 Executive Summary
4 Market Landscape
- 4.1 Market Overview
- 4.2 Market Drivers
- 4.2.1 Increasing Mining CAPEX in APAC and North America
- 4.2.2 Surging Mineral Demand from EV And Renewable-Energy Supply Chains
- 4.2.3 Stricter Water-Recycling Norms in Large Mines
- 4.2.4 Commodity-Price Rebound Sustaining Exploration Budgets
- 4.2.5 Shift to Bio-Based Collectors for ESG Compliance
- 4.3 Market Restraints
- 4.3.1 Tightening Global Regulations on Toxic Reagents
- 4.3.2 Volatile Crude-Derived Raw-Material Costs
- 4.3.3 Emerging Dry-Processing Technologies that Bypass Wet Reagents
- 4.4 Value Chain Analysis
- 4.5 Porter's Five Forces
- 4.5.1 Bargaining Power of Suppliers
- 4.5.2 Bargaining Power of Buyers
- 4.5.3 Threat of New Entrants
- 4.5.4 Threat of Substitutes
- 4.5.5 Degree of Competition
5 Market Size and Growth Forecasts (Value)
- 5.1 By Function
- 5.1.1 Flotation Chemicals
- 5.1.1.1 Collectors
- 5.1.1.2 Depressants
- 5.1.1.3 Flocculants
- 5.1.1.4 Frothers
- 5.1.1.5 Dispersants
- 5.1.2 Extraction Chemicals
- 5.1.2.1 Diluents
- 5.1.2.2 Extractants
- 5.1.3 Grinding Aids
- 5.1.1 Flotation Chemicals
- 5.2 By Application
- 5.2.1 Mineral Processing
- 5.2.2 Wastewater Treatment
- 5.3 By Geography
- 5.3.1 Asia-Pacific
- 5.3.1.1 China
- 5.3.1.2 India
- 5.3.1.3 Japan
- 5.3.1.4 South Korea
- 5.3.1.5 Indonesia
- 5.3.1.6 Malaysia
- 5.3.1.7 Australia and New Zealand
- 5.3.1.8 Rest of Asia-Pacific
- 5.3.2 North America
- 5.3.2.1 United States
- 5.3.2.2 Canada
- 5.3.2.3 Mexico
- 5.3.3 Europe
- 5.3.3.1 Germany
- 5.3.3.2 United Kingdom
- 5.3.3.3 France
- 5.3.3.4 Italy
- 5.3.3.5 Russia
- 5.3.3.6 Rest of Europe
- 5.3.4 South America
- 5.3.4.1 Brazil
- 5.3.4.2 Argentina
- 5.3.4.3 Rest of South America
- 5.3.5 Middle-East and Africa
- 5.3.5.1 Saudi Arabia
- 5.3.5.2 South Africa
- 5.3.5.3 Rest of Middle-East and Africa
- 5.3.1 Asia-Pacific
6 Competitive Landscape
- 6.1 Market Concentration
- 6.2 Strategic Moves
- 6.3 Market Share Analysis
- 6.4 Company Profiles (includes Global level Overview, Market level overview, Core Segments, Financials as available, Strategic Information, Market Rank/Share for key companies, Products and Services, and Recent Developments)
- 6.4.1 BASF
- 6.4.2 3M
- 6.4.3 AECI
- 6.4.4 Arkema
- 6.4.5 Betachem (Pty) Ltd
- 6.4.6 Celanese Corporation
- 6.4.7 Chevron Phillips Chemical Company LLC
- 6.4.8 Clariant
- 6.4.9 CTC (Tennant Consolidated Group)
- 6.4.10 Ecolab
- 6.4.11 FMC Corporation
- 6.4.12 Indorama Ventures Public Limited
- 6.4.13 Kemira
- 6.4.14 NASACO
- 6.4.15 Orica Limited
- 6.4.16 Qingdao Ruchang Mining Industry Co. Ltd
- 6.4.17 Sasol
- 6.4.18 SNF Group
- 6.4.19 Syensqo
7 Market Opportunities and Future Outlook
- 7.1 White-space and Unmet-need Assessment
 2026年全球矿业化学品市场报告
 矿业化学品市场-全球产业规模、份额、趋势、机会及预测(按类型、应用、地区和竞争格局划分,2021-2031年)
 2026-2030年全球矿业化学品市场
 矿业化学品市场规模、份额和成长分析(按矿石、产品、矿物、应用和地区划分)-2026-2033年产业预测
 全球矿业化学品市场,2024-2031年
 全球矿业电化学加工市场:市场规模、份额、趋势分析(按製程类型、回收金属和地区划分)、细分市场预测,2025-2033年
 2025 年至 2033 年矿用化学品市场规模、份额、趋势及预测(按产品类型、矿物类型、应用和地区)
 矿业化学品市场-全球产业分析、规模、份额、成长、趋势及预测(2025-2035)
 钻井化学品市场:按化学品、流体类型、应用和地区划分
 采矿化学品市场报告:2030 年趋势、预测与竞争分析