


 |
市场调查报告书
商品编码
1906878
聚甲醛(POM):市场占有率分析、产业趋势与统计、成长预测(2026-2031)Polyoxymethylene (POM) - Market Share Analysis, Industry Trends & Statistics, Growth Forecasts (2026 - 2031) |
||||||
※ 本网页内容可能与最新版本有所差异。详细情况请与我们联繫。
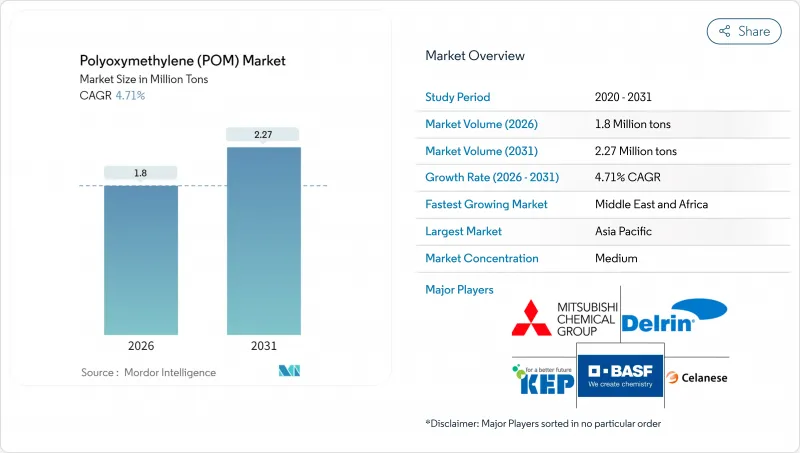
预计到 2026 年,聚甲醛 (POM) 市场规模将达到 180 万吨。
这比 2025 年的 172 万吨有所增加,预计到 2031 年将达到 227 万吨,2026 年至 2031 年的年复合成长率(CAGR)为 4.71%。
需求成长主要受车辆轻量化、电子产品小型化以及精密机械领域从金属转变为塑胶的转变所驱动。欧盟、中国和美国日益严格的汽车排放气体法规推动了尺寸稳定性工程树脂的应用。原始设备製造商 (OEM) 正在设计单一材料模组,以减少零件数量并简化回收流程,这种做法促使人们选择缩醛缩醛。同时,永续性倡议正推动製造商开发低甲醛和再生材料含量的产品,这些产品既符合监管标准,又不牺牲机械性能。在竞争方面,亚洲一体化製造商正利用其内部甲烷供应和与下游加工商的接近性来增强成本优势,而欧美供应商则透过为电动车 (EV) 内饰和半导体製造设备开发专用配方来脱颖而出。
全球聚甲醛(POM)市场趋势与洞察
汽车轻量化快速发展
汽车製造商正在指定使用聚甲醛缩醛来减轻车辆重量,同时保持结构刚性,尤其是在燃油模组、车门锁扣和变速箱零件中。到2024年,平均每辆汽车将包含8到10磅的聚甲醛(POM),而且随着每款新型纯电动车的推出,这一数字还在增加。电动车的温度控管系统正在增强这种树脂的抗蠕变性和化学惰性,从而能够製造出可以承受引擎室内热循环的薄壁部件。诸如车窗稳压器之类的滑动机构采用聚甲醛齿轮,以实现终身噪音、振动和不平顺性(NVH)目标。汽车製造商还将导轨、密封件和铰链销等多个子功能整合到单一射出成型模组中,以最大限度地减轻重量,同时简化报废时的拆卸。 2024年,汽车产业的需求将占聚甲醛总需求的31.05%,证实了这种聚合物在下一代出行解决方案中的重要角色。
电气和电子设备的微型化
智慧型手机、穿戴式装置和5G基础设施中组件的微型化推动了对尺寸稳定性塑胶的需求,这些塑胶需保持微米等级的公差。聚甲醛(POM)的低吸湿性可防止其在潮湿环境中膨胀,从而保护细间距连接器和微型齿轮的精确度。防静电等级的POM可降低晶片处理夹具中静电放电的风险,而高流动性等级的POM则可实现厚度低至0.25毫米的薄壁成型,适用于相机模组。消费性电子设备製造商正在利用POM树脂易于加工的特性,快速製作新型致动器设计的原型,从而缩短产品上市时间。物联网节点的快速成长需要数十个微型运动部件,这进一步扩大了缩醛共聚物在亚太地区契约製造企业的应用范围。
来自生物基塑胶和高性能塑胶的竞争
在永续性目标的驱动下,原始设备製造商 (OEM) 正在试验纤维素增强的缩醛和全生物基聚酰胺,这些材料可使生命週期排放降低两位数百分比。儘管成本增加,航太供应商仍在考虑以聚醚醚酮 (PEEK) 取代聚甲醛 (POM) 用于超过其 100°C排放极限的高温零件。在欧洲消费品市场,监管机构为碳负排放配方提供优惠的生态税政策,进而影响采购决策。一些医疗设备製造商正在转向可承受反覆蒸气灭菌循环的耐灭菌化学物质,这正在侵蚀 POM 在精密帮浦零件领域的市场份额。虽然现有聚合物仍保持着成本绩效优势,但日益严格的环境资讯揭露要求正在威胁那些存在环保替代品的应用领域的需求。
细分市场分析
到2025年,片材将占全球消费量的64.78%,反映出其在汽车门模组、电子设备机壳、工业盖板等领域的广泛应用。预计到2031年,该细分市场将维持5.05%的复合年增长率。挤出技术的进步使得片材厚度公差可达到±3%,因此无需二次刨削工序即可直接加工成复杂的三维零件。加工商重视片材均匀的晶体形貌,这有助于减少大尺寸面板热成型过程中的翘曲。
棒材和管材主要服务于精密零件的细分市场,例如齿轮、止推垫圈和流体处理歧管,这些零件在工作温度范围内尺寸偏差不得超过 0.05 毫米。混合动力传动系统组装和工厂自动化设备正在推动该市场缓慢但稳定成长。 「其他」类别(主要指射出成型)正吸引设计工程师的关注,他们希望以三分之一的成本获得类似铝材的重量。 ASTM D6100 标准统一了所有形状的公差标准,使全球原始设备製造商 (OEM) 对跨区域采购充满信心。虽然板材仍占据主导地位,但从 2027 年起,采用颗粒状原料进行增材製造可能会推动「其他」子细分市场逐步扩张。
聚甲醛(POM)市场报告按形态(板材、棒材和管材等)、终端用户行业(航太、汽车、电气电子、工业机械等)和地区(亚太、北美、欧洲、南美、中东和非洲)进行细分。市场预测以数量(吨)和价值(美元)为单位。
区域分析
到2025年,亚太地区将占全球出货量的66.70%,这主要得益于垂直整合的供应链以及中国、印度和东南亚原始设备製造商(OEM)的强劲需求。日本製造商持续供应精密齿轮的高结晶质共聚物,而韩国供应商则大力推广用于半导体製造设备的导电级产品。胡志明市和浦那週边的产业群聚正在加速从商用板材转型为汽车零件转型,从而增强区域自给自足能力。
中东和非洲地区将呈现最快的成长轨迹,到2031年复合年增长率将达到5.90%。像沙乌地基础工业公司(SABIC)旗下的Petrochemiya这样的巨型工厂正在整合甲醇、甲醛和下游聚合物生产设施,以确保原料供应稳定和能源效率。阿联酋的航太零件製造商正在逐步淘汰铝材,转而从在地采购),以支持海湾航空公司的机队扩张计划。该地区位于亚洲和欧洲消费中心之间,地理位置优越,有助于降低出口商的运输成本,而红海航线的瓶颈进一步放大了这一优势。
北美和欧洲保持着技术优势,并积极研发低甲醛和再生材料含量的开发平臺。密西根州和巴伐利亚州的一级汽车供应商正与树脂製造商合作,透过生产流程进行生命週期评估,并缩小规格范围,以确保与循环经济的兼容性。儘管南美市场尚未成熟,但受益于巴西汽车产业走廊的製造业投资,其对缩醛的需求与当地燃料系统生产密切相关。总体而言,亚太地区凭藉其高度集中的甲醇原料和成品组装,可望继续保持其优势。
其他福利:
- Excel格式的市场预测(ME)表
- 3个月的分析师支持
目录
第一章 引言
- 研究假设和市场定义
- 调查范围
第二章调查方法
第三章执行摘要
第四章 市场情势
- 市场概览
- 市场驱动因素
- 汽车轻量化的蓬勃发展
- 电气和电子设备领域的微型化
- 工业机械从金属到塑胶的转变
- 扩大亚太地区的製造业
- 用于电动车内装的低VOC POM等级
- 市场限制
- 来自生物基塑胶和高性能塑胶的竞争
- 原料价格波动和贸易壁垒
- 甲醇制永续航空燃料(SAF)价值链
- 价值链分析
- 监管环境
- 进出口分析
- 价格趋势
- 波特五力分析
- 供应商的议价能力
- 买方的议价能力
- 替代品的威胁
- 竞争对手之间的竞争
- 新进入者的威胁
- 终端用户产业趋势
- 航太(航太零件生产收入)
- 汽车(汽车产量)
- 建筑与施工(新建建筑占地面积)
- 电气电子设备(电气电子设备生产收入)
- 包装(塑胶包装量)
第五章 市场规模及成长预测(价值及数量)
- 按形式
- 床单
- 桿和管
- 其他的
- 按最终用户行业划分
- 航太工业
- 车
- 电气和电子设备
- 工业和机械
- 其他终端用户产业
- 按地区
- 亚太地区
- 中国
- 日本
- 印度
- 韩国
- 澳洲
- 马来西亚
- 亚太其他地区
- 北美洲
- 加拿大
- 墨西哥
- 美国
- 欧洲
- 德国
- 法国
- 义大利
- 英国
- 俄罗斯
- 其他欧洲地区
- 南美洲
- 巴西
- 阿根廷
- 南美洲其他地区
- 中东和非洲
- 沙乌地阿拉伯
- 阿拉伯聯合大公国
- 奈及利亚
- 南非
- 其他中东和非洲地区
- 亚太地区
第六章 竞争情势
- 市场集中度
- 策略趋势
- 市占率(%)/排名分析
- 公司简介
- Celanese Corporation
- China BlueChemical Ltd.
- Delrin USA, LLC
- Henan Energy and Chemical Group Co., Ltd.
- Kolon BASF innoPOM, Inc.
- Korea Engineering Plastics Co., Ltd.
- LG Chem
- Mitsubishi Chemical Group Corporation
- Polyplastics Co., Ltd.(Daicel Group)
- SABIC
- Yuntianhua Group Co., Ltd.
第七章 市场机会与未来展望
第八章:执行长面临的关键策略挑战
Polyoxymethylene market size in 2026 is estimated at 1.80 million tons, growing from 2025 value of 1.72 million tons with 2031 projections showing 2.27 million tons, growing at 4.71% CAGR over 2026-2031.
Elevated demand stems from automotive lightweighting programs, electronics miniaturization, and the shift from metal to plastic in precision machinery. The implementation of tighter vehicle emission rules in the European Union, China, and the United States favors the broader adoption of dimensionally stable engineering resins. Original equipment manufacturers (OEMs) are designing single-material modules to reduce part counts and simplify recycling, an approach that reinforces the selection of acetal copolymers. Meanwhile, sustainability initiatives encourage producers to launch low-formaldehyde and recycled-content grades that meet regulatory thresholds without sacrificing mechanical integrity. On the competitive front, integrated Asian producers leverage captive methanol supply and proximity to downstream converters to reinforce cost advantages, while Western suppliers differentiate through specialty formulations aimed at electric vehicle (EV) interiors and semiconductor tooling.
Global Polyoxymethylene (POM) Market Trends and Insights
Automotive Lightweighting Boom
Carmakers specify acetal copolymers to reduce vehicle mass while retaining structural stiffness, particularly in fuel modules, door latches, and transmission components. The average automobile incorporated 8-10 lb of POM in 2024, a figure that increases with every new battery-electric model. EV thermal-management systems enhance the resin's creep resistance and chemical inertness, allowing for thinner-walled parts that withstand under-hood heat cycling. Sliding assemblies, such as window regulators, adopt POM gears to meet lifetime noise, vibration, and harshness (NVH) targets. Automakers also bundle several sub-functions-such as guide rails, seals, and hinge pins-into single, injection-molded modules, maximizing weight savings while simplifying end-of-life disassembly. The 31.05% slice of 2024 demand tied to automotive underlines the polymer's entrenched role in next-generation mobility solutions.
Miniaturization in Electrical and Electronics
Component scaling in smartphones, wearables, and 5G infrastructure intensifies demand for dimensionally stable plastics that hold micron-level tolerances. POM's low moisture uptake prevents swelling in humid environments, safeguarding precision in fine-pitch connectors and micro-gears. Static-dissipative grades mitigate electrostatic discharge risks in chip-handling fixtures, while high-flow variants enable thin-wall molding down to 0.25 mm for camera modules. Consumer device makers capitalize on the resin's easy machinability to rapidly prototype new actuator designs, thereby shortening the time-to-market. The surge of IoT nodes-each requiring dozens of miniature moving parts-further broadens the addressable base for acetal copolymers across Asia-Pacific contract manufacturing hubs.
Competition from Bio-based and High-Performance Plastics
Sustainability goals prompt OEMs to experiment with cellulose-reinforced acetal and fully bio-derived polyamides, which reduce life-cycle emissions by double-digit percentages. Aerospace suppliers are weighing the substitution of polyetheretherketone (PEEK) for hot-section parts operating above POM's 100 °C ceiling, despite the associated cost premium. In European consumer goods markets, regulators reward carbon-negative formulations through lower eco-taxes, thereby tilting sourcing decisions. Some medical-device firms are pivoting to sterilization-stable chemistries to withstand repeated steam cycles, thereby eroding the share of POM in precision pump components. Although the incumbent polymer retains a cost-performance sweet spot, rising environmental disclosure obligations threaten demand in applications where drop-in greener alternatives exist.
Other drivers and restraints analyzed in the detailed report include:
- Metal-to-Plastic Shift in Industrial Machinery
- Manufacturing Expansion in Asia-Pacific
- Raw-Material Price Volatility and Trade Barriers
For complete list of drivers and restraints, kindly check the Table Of Contents.
Segment Analysis
The sheet category accounted for 64.78% of global consumption in 2025, reflecting its widespread use in automotive door modules, electronics housings, and industrial covers. The segment is also projected to pace a 5.05% CAGR through 2031. Extrusion advances now yield sheet thickness tolerances of +-3%, allowing for direct machining into complex three-dimensional parts without the need for secondary planing. Converters appreciate the material's uniform crystalline morphology, which resists warp during thermoforming of large panels.
Rod and tube forms serve high-precision niches, such as gears, thrust washers, and fluid-handling manifolds, where dimensional drift cannot exceed 0.05 mm over the service temperature range. Hybrid powertrain assemblies and factory automation equipment drive modest but steady growth. The "others" bucket-principally injection-molded near-net-shapes-attracts design engineers seeking weight parity with aluminum at one-third the cost. The ASTM D6100 specification unifies tolerance benchmarks across all form factors, providing global OEMs with confidence in multi-regional sourcing. Although sheet will remain dominant, the proliferation of additive-manufacturing feedstock pellets could gradually elevate the "others" sub-segment after 2027.
The Polyoxymethylene (POM) Market Report is Segmented by Form Type (Sheet, Rod and Tube, and Others), End-User Industry (Aerospace, Automotive, Electrical and Electronics, Industrial and Machinery, and Other End-User Industries), and Geography (Asia-Pacific, North America, Europe, South America, and Middle-East and Africa). The Market Forecasts are Provided in Terms of Volume (Tons) and Value (USD).
Geography Analysis
Asia-Pacific contributed 66.70% of 2025 shipments, buoyed by vertically integrated supply chains and surging demand from Chinese, Indian, and Southeast Asian OEMs. Japanese producers continue supplying high-crystallinity copolymers favored in precision gears, while Korean suppliers push electro-conductive grades for semiconductor tooling. Clusters around Ho Chi Minh City and Pune accelerate the conversion of off-the-shelf sheet into automotive assemblies, reinforcing regional self-sufficiency.
The Middle-East and Africa exhibit the fastest trajectory at 5.90% CAGR through 2031. Mega-sites like SABIC's Petrokemya integrate methanol, formaldehyde, and downstream polymer units, conferring feedstock stability and energy efficiency. Aerospace parts makers in the United Arab Emirates diversify away from aluminum, sourcing POM locally to support Gulf carrier fleet expansion plans. The region's location between Asian and European consumer bases helps exporters minimize freight costs, a factor amplified by Red Sea shipping bottlenecks.
North America and Europe maintain technology leadership, nurturing research and development pipelines for low-formaldehyde and recycled-content variants. Automotive Tier-1 suppliers in Michigan and Bavaria collaborate with resin producers on cradle-to-gate life-cycle assessments, advocating for narrower specification windows that ensure compatibility with the circular economy. South American markets remain nascent but benefit from manufacturing investments in Brazil's automotive corridor, where acetal demand aligns with localized fuel system production. Overall, the Asia-Pacific region appears poised to maintain its dominance, given its concentration of both methanol feedstock and finished goods assembly lines.
- Celanese Corporation
- China BlueChemical Ltd.
- Delrin USA, LLC
- Henan Energy and Chemical Group Co., Ltd.
- Kolon BASF innoPOM, Inc.
- Korea Engineering Plastics Co., Ltd.
- LG Chem
- Mitsubishi Chemical Group Corporation
- Polyplastics Co., Ltd. (Daicel Group)
- SABIC
- Yuntianhua Group Co., Ltd.
Additional Benefits:
- The market estimate (ME) sheet in Excel format
- 3 months of analyst support
TABLE OF CONTENTS
1 Introduction
- 1.1 Study Assumptions and Market Definition
- 1.2 Scope of the Study
2 Research Methodology
3 Executive Summary
4 Market Landscape
- 4.1 Market Overview
- 4.2 Market Drivers
- 4.2.1 Automotive Lightweighting Boom
- 4.2.2 Miniaturisation in Electrical and Electronics
- 4.2.3 Metal-to-plastic Shift in Industrial Machinery
- 4.2.4 Manufacturing Expansion in Asia-Pacific
- 4.2.5 Low-VOC POM Grades for EV Interiors
- 4.3 Market Restraints
- 4.3.1 Competition from Bio-based and High-performance Plastics
- 4.3.2 Raw-material Price Volatility and Trade Barriers
- 4.3.3 Methanol Diversion to SAF Value-chain
- 4.4 Value Chain Analysis
- 4.5 Regulatory Landscape
- 4.6 Import and Export Analysis
- 4.7 Price Trends
- 4.8 Porter's Five Forces Analysis
- 4.8.1 Bargaining Power of Suppliers
- 4.8.2 Bargaining Power of Buyers
- 4.8.3 Threat of Substitutes
- 4.8.4 Competitive Rivalry
- 4.8.5 Threat of New Entrants
- 4.9 End-use Sector Trends
- 4.9.1 Aerospace (Aerospace Component Production Revenue)
- 4.9.2 Automotive (Automobile Production)
- 4.9.3 Building and Construction (New Construction Floor Area)
- 4.9.4 Electrical and Electronics (Electrical and Electronics Production Revenue)
- 4.9.5 Packaging (Plastic Packaging Volume)
5 Market Size and Growth Forecasts (Value and Volume)
- 5.1 By Form Type
- 5.1.1 Sheet
- 5.1.2 Rod and Tube
- 5.1.3 Others
- 5.2 By End-user Industry
- 5.2.1 Aerospace
- 5.2.2 Automotive
- 5.2.3 Electrical and Electronics
- 5.2.4 Industrial and Machinery
- 5.2.5 Other End-user Industries
- 5.3 By Geography
- 5.3.1 Asia-Pacific
- 5.3.1.1 China
- 5.3.1.2 Japan
- 5.3.1.3 India
- 5.3.1.4 South Korea
- 5.3.1.5 Australia
- 5.3.1.6 Malaysia
- 5.3.1.7 Rest of Asia-Pacific
- 5.3.2 North America
- 5.3.2.1 Canada
- 5.3.2.2 Mexico
- 5.3.2.3 United States
- 5.3.3 Europe
- 5.3.3.1 Germany
- 5.3.3.2 France
- 5.3.3.3 Italy
- 5.3.3.4 United Kingdom
- 5.3.3.5 Russia
- 5.3.3.6 Rest of Europe
- 5.3.4 South America
- 5.3.4.1 Brazil
- 5.3.4.2 Argentina
- 5.3.4.3 Rest of South America
- 5.3.5 Middle-East and Africa
- 5.3.5.1 Saudi Arabia
- 5.3.5.2 United Arab Emirates
- 5.3.5.3 Nigeria
- 5.3.5.4 South Africa
- 5.3.5.5 Rest of Middle-East and Africa
- 5.3.1 Asia-Pacific
6 Competitive Landscape
- 6.1 Market Concentration
- 6.2 Strategic Moves
- 6.3 Market Share (%)/Ranking Analysis
- 6.4 Company Profiles (includes Global level Overview, Market level overview, Core Segments, Financials as available, Strategic Information, Market Rank/Share for key companies, Products and Services, and Recent Developments)
- 6.4.1 Celanese Corporation
- 6.4.2 China BlueChemical Ltd.
- 6.4.3 Delrin USA, LLC
- 6.4.4 Henan Energy and Chemical Group Co., Ltd.
- 6.4.5 Kolon BASF innoPOM, Inc.
- 6.4.6 Korea Engineering Plastics Co., Ltd.
- 6.4.7 LG Chem
- 6.4.8 Mitsubishi Chemical Group Corporation
- 6.4.9 Polyplastics Co., Ltd. (Daicel Group)
- 6.4.10 SABIC
- 6.4.11 Yuntianhua Group Co., Ltd.
7 Market Opportunities and Future Outlook
- 7.1 White-space and Unmet-Need Assessment
8 Key Strategic Questions for CEOs
 聚甲醛市场:依树脂类型、形态、销售管道和应用划分-2026-2032年全球市场预测
 全球聚甲醛市场:按类型、等级、加工技术、终端应用产业及地区划分-预测至2030年
 2026年全球聚甲醛(POM)市场报告聚甲醛树脂市场依产品类型、加工技术、等级、通路和应用划分-2026-2032年全球预测
 全球聚甲醛市场:市场规模、占有率、成长率、产业分析、按类型、应用和地区划分的考量、未来预测(2026-2034)
 聚甲醛市场规模、份额和成长分析(按类型、应用、加工方法、等级和地区划分)-2026-2033年产业预测
 聚甲醛市场机会、成长驱动因素、产业趋势分析及预测(2026-2035年)
 2025-2033年聚甲醛市场报告(按类型、製程、等级、最终用户和地区)
 聚甲醛的全球市场
 2030 年聚甲醛市场预测:按类型、加工方法、应用、最终用户和地区进行的全球分析