


 |
市场调查报告书
商品编码
1906886
机器人技术:市场占有率分析、产业趋势与统计、成长预测(2026-2031)Robotics - Market Share Analysis, Industry Trends & Statistics, Growth Forecasts (2026 - 2031) |
||||||
※ 本网页内容可能与最新版本有所差异。详细情况请与我们联繫。
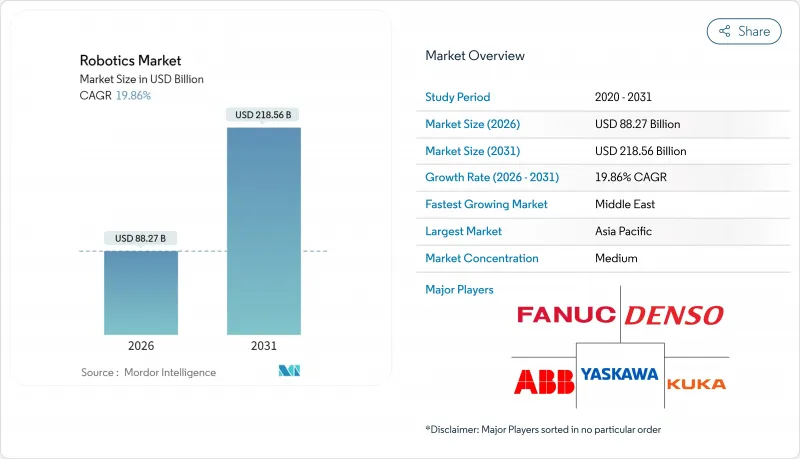
预计到2026年,机器人市场规模将达到882.7亿美元,高于2025年的736.4亿美元。预计到2031年,该市场规模将达到2,185.6亿美元,2026年至2031年的复合年增长率为19.86%。
这种成长轨迹反映了已开发国家结构性劳动力短缺、自动化硬体成本持续下降,以及政府主导的将机器人定位为战略基础设施而非可自由支配的资本财的回流政策。大型企业正在加速采用机器人以在薪资压力下稳定生产,而中小企业则透过协作机器人系统和机器人即服务合约获得机器人的使用权。区域发展趋势正在改变。亚太地区在销售方面保持领先地位,中东地区由于主权财富基金的技术主导多元化倡议,正经历着最快的成长。在供应方面,零件成本的下降和低程式码程式设计平台正在重塑价值链,使其朝着软体智慧方向发展,从而为掌握人工智慧控制技术的供应商提供可持续的收入来源。网路安全漏洞、出口管制摩擦以及小规模用户技能不足仍然是限制因素,但同时也为专业服务开闢了新的市场,尤其是在安全部署和生命週期支援方面。
全球机器人市场趋势与洞察
劳动力短缺日益严重,推动了对自动化的需求。
日本、美国和西欧的人口结构逆风正促使自动化从降低成本转向保障产能。到2024年,七国集团(G7)製造业将面临超过200万个工厂职位空缺,而日本的机器人密度已达到创纪录的每万名员工399台机器人。像Stellantis这样的汽车製造商正在悄悄推进协同部署,采用人性化的机器人单元,既能留住员工,又能减少重复性劳损。全球机器人市场受益于这些结构性缺口,这些缺口贯穿整个经济週期,为供应商提供了一个不受GDP波动影响的可预测需求基础。
每功能小时机器人平均价格下降
由于零件的商品化和大规模生产,协作机器人的价格将从2024年起每年下降约15%,而软体升级已使其性价比翻了一番。中国製造商正在以19.9万元人民币(约27,512美元)的价格销售入门级人形机器人,使机器人技术进入了中小型工厂的资本预算范围。硬体成本的下降将使中小型製造商和新兴市场製造商更快地接受机器人技术,从而扩大全球机器人市场的潜在客户群。
中小企业持续整合技能短缺
68%的中小企业仍缺乏部署机器人所需的技术人才,导致投资回收期长、运转率率低。系统整合商集中在都市区,农村企业服务不足。如果缺乏加速技能培养和承包服务模式,全球机器人市场仍将是巨大的未开发潜力。
细分市场分析
到2025年,工业机器人将占据全球机器人市场71.04%的份额,这主要得益于高生产率的汽车和电子产品组装的持续需求。然而,协作机器人将在2031年之前继续以25.64%的复合年增长率成长,这主要得益于安全认证的力感应技术以及低于3万美元的价格,使其进入中小企业的预算范围。这种转变表明,灵活的、由人工监督的单元,而非封闭的围栏,将推动全球机器人市场下一波应用浪潮。
中国协作机器人製造商的快速成长预计将使中国国内市场份额在2017年至2024年间从35%提升至73%,加剧价格竞争并加速全球机器人销售成长。服务型机器人领域也持续成长,预计到2025年,手术系统市场规模将超过41.8亿美元,再次印证医疗产业是成长最快的终端用户领域。这种多元化发展将有助于缓解全球机器人市场的周期性波动,并使硬体供应商免受单一产业衰退的影响。
儘管到2025年硬体支出仍将占总支出的63.12%,但随着人工智慧成为关键价值驱动因素,软体收入预计将以22.91%的年增长率成长。更高等级的控制堆迭融合了云端分析和强化学习技术,而ABB的OmniCore平台可将循环时间缩短25%,电力消耗量降低20%。随着客户从资本支出模式转向营运支出模式,预计到2031年,全球基于订阅的「机器人即服务」(Robot-as-a-Service)市场规模将成长两倍。
涵盖整合、远端监控和预测性维护的业务收益进一步强化了供应商锁定。因此,软体和服务之间的界限变得模糊,续订权和网路安全补丁被捆绑在多年期合约中。这一趋势正在重塑利润结构,并提高了全球机器人市场中纯粹以硬体为中心的厂商的准入门槛。
区域分析
到2025年,亚太地区将占据全球机器人市场37.72%的份额,主要得益于中国每年部署43万台工业机器人以及全球整体三分之二的机器人专利核准数量。中国工厂正在将机器人整合到锂离子电池和消费性电子产品生产线中,本土品牌也正在扩大出口,充分利用该地区在全球机器人市场的成本竞争力。在日本,FANUC)累计2024年利润将达到1,802亿日圆(约16.4亿美元),主要得益于中国市场需求的復苏和国内人口结构变化所带来的压力。在韩国,一项耗资26亿美元的公私合作计画正在利用人形机器人技术实现电池工厂的自动化,这反映了韩国对该技术的战略重视。
预计到2031年,中东地区的复合年增长率将达到21.31%,位居全球之首。这主要得益于主权财富基金将过剩的石油和天然气资本重新投入工业数位化、物流和医疗机器人领域。阿联酋自由贸易区正在试点将自主移动机器人(AMR)应用于仓库,以支援区域电子商务物流并减少对移民工人的过度依赖。此外,各国政府也正在资助先进製造地建设,并吸引全球系统整合商,从而扩大全球机器人市场的潜在基本客群。
北美市场需求仍然强劲,主要得益于国防合同,例如《晶片製造和整合法案》(CHIPS Act)下的半导体代工厂合同,以及授予安杜里尔公司(Anduril)的价值6.422亿美元的海军无人机合约。欧洲则专注于安全的人机协作标准和永续性目标,德国每年拨款6,900万欧元(约7,500万美元)用于人工智慧集成,为其发展提供了有力支撑。这两个地区都在增加对高价值软体和整合技术的投资,而将通用子组件生产外包给亚洲的趋势,则反映了全球机器人市场正在采取的「槓铃式」策略。
其他福利:
- Excel格式的市场预测(ME)表
- 3个月的分析师支持
目录
第一章 引言
- 研究假设和市场定义
- 调查范围
第二章调查方法
第三章执行摘要
第四章 市场情势
- 市场概览
- 市场驱动因素
- 劳动力短缺加剧,导致自动化需求不断成长
- 每功能小时机器人平均价格下降
- 低程式码机器人程式设计平台的兴起
- 七国集团国家製造业回流的财政奖励措施
- 电子商务第三方物流业者在仓库中采用自主移动机器人(AMR)的现状
- 国家级人形机器人研发任务(例如,中国2025)
- 市场限制
- 中小企业永续融入的技能差距
- 对先进伺服电机的地缘政治出口管制
- 稀土元素磁铁价格波动
- ROS部署中的网路安全漏洞
- 价值链分析
- 监管环境
- 技术展望
- 波特五力分析
- 新进入者的威胁
- 供应商的议价能力
- 买方的议价能力
- 替代品的威胁
- 竞争对手之间的竞争
- 对宏观经济趋势的市场评估
第五章 市场规模与成长预测
- 按机器人类型
- 工业机器人
- 服务机器人
- 协作机器人(cobots)
- 移动/AMR
- 按组件
- 硬体
- 软体
- 服务(整合、RaaS)
- 透过使用
- 製造和组装
- 物流/仓储业
- 医学与外科
- 国防与安全
- 检查和维护
- 清洁和卫生管理
- 按最终用户行业划分
- 车
- 电子和半导体
- 食品/饮料
- 医疗保健提供者
- 军事/国防
- 其他终端用户产业
- 按地区
- 北美洲
- 美国
- 加拿大
- 墨西哥
- 欧洲
- 德国
- 英国
- 法国
- 其他欧洲地区
- 亚太地区
- 中国
- 印度
- 日本
- 亚太其他地区
- 南美洲
- 巴西
- 阿根廷
- 其他南美洲
- 中东
- 阿拉伯聯合大公国
- 沙乌地阿拉伯
- 其他中东地区
- 非洲
- 南非
- 奈及利亚
- 其他非洲地区
- 北美洲
第六章 竞争情势
- 市场集中度
- 策略趋势
- 市占率分析
- 公司简介
- ABB Ltd.
- Fanuc Corporation
- Yaskawa Electric Corporation
- KUKA AG
- Kawasaki Heavy Industries Ltd
- Universal Robots A/S(Teradyne)
- Denso Corporation
- Mitsubishi Electric Corporation
- Omron Corporation
- Staubli International AG
- Epson Robots(Seiko Epson)
- Comau SpA
- Nachi-Fujikoshi Corp.
- Toshiba Corporation
- Intuitive Surgical Inc.
- Stryker Corporation
- iRobot Corporation
- Boston Dynamics Inc.
- Locus Robotics Corp.
- DJI Technology Co. Ltd
第七章 市场机会与未来展望
Robotics market size in 2026 is estimated at USD 88.27 billion, growing from 2025 value of USD 73.64 billion with 2031 projections showing USD 218.56 billion, growing at 19.86% CAGR over 2026-2031.
This growth trajectory reflects structural labor shortages in advanced economies, systematic cost deflation in automation hardware, and government-backed reshoring programs that treat robots as strategic infrastructure rather than optional capital goods. Large enterprises accelerate adoption to stabilise production amid wage pressure, while small and medium firms now gain access through collaborative systems and Robot-as-a-Service contracts. Regional momentum is shifting: Asia-Pacific retains volume leadership, but the Middle East shows the quickest pace as sovereign funds pursue technology-driven diversification. On the supply side, declining component costs and low-code programming platforms reshape the value chain toward software intelligence, setting up recurring revenue streams for vendors that master artificial-intelligence-based control. Cyber-security weaknesses, export-control friction, and skill gaps among smaller users remain braking forces, yet they also open specialist service niches, especially around secure deployment and lifecycle support.
Global Robotics Market Trends and Insights
Rising Labour-Shortage Led Automation Demand
Demographic headwinds in Japan, the United States, and much of Western Europe have shifted automation from cost-saving to capacity-assurance mode. Unfilled factory vacancies topped 2 million roles across G-7 manufacturing in 2024, while Japan's robot density reached 399 units per 10,000 employees, the highest on record. Automakers such as Stellantis adopted human-centric robotic cells that trim repetitive strain injuries yet safeguard headcount, signalling a nuanced push toward collaborative deployment. The global robotics market benefits because these structural gaps persist through economic cycles, giving vendors a predictable demand base that decouples from GDP volatility.
Declining Average Robot Price Per Functional Hour
Component commoditisation and scale production cut collaborative robot prices by roughly 15% a year post-2024, while software upgrades doubled performance relative to price. Chinese suppliers even marketed entry-level humanoids at CNY 199,000 (USD 27,512), placing robots within small-factory capital budgets. As hardware costs slide, adoption curves steepen among small and emerging-market manufacturers, thereby widening the addressable pool for the global robotics market.
Persistent SME Integration Skill-Gap
Sixty-eight percent of SMEs still lack engineering talent for robotics deployment, prolonging payback periods and dampening utilisation rates. Integrators cluster in urban hubs, leaving regional firms underserved. Without accelerated skills development or turnkey service models, the global robotics market leaves considerable latent demand untapped.
Other drivers and restraints analyzed in the detailed report include:
- Proliferation of Low-Code Robot-Programming Platforms
- Fiscal Incentives for Reshoring Manufacturing in G-7
- Geopolitical Export-Control on Advanced Servos
For complete list of drivers and restraints, kindly check the Table Of Contents.
Segment Analysis
Industrial robots accounted for 71.04% of the global robotics market in 2025, riding sustained demand from high-throughput automotive and electronics assembly lines. Yet collaborative robots expand at a 25.64% CAGR to 2031, underpinned by safety-certified force-sensing and sub-USD 30,000 price tags that place them within SME budgets. This pivot signals that flexible, human-supervised cells, rather than fenced-off lines, will drive the next deployment wave of the global robotics market.
A surge in Chinese cobot makers lifted their domestic share from 35% to 73% between 2017 and 2024, heightening price competition and accelerating worldwide unit growth. Service-robot niches also flourish: surgical systems surpassed USD 4.18 billion in 2025, reaffirming healthcare as the fastest-rising end-use. This diversification reduces cyclicality for the global robotics market and cushions hardware vendors against single-sector downturns.
Hardware still represented 63.12% of 2025 spending, but software revenue is set to grow 22.91% annually as artificial intelligence becomes the primary value driver. Higher-level control stacks now incorporate cloud analytics and reinforcement learning that deliver 25% faster cycle times with 20% lower electricity use on ABB's OmniCore platform. The global robotics market size for subscription-based Robot-as-a-Service is projected to treble by 2031 as customers migrate from capital expenditure toward operating expenditure models.
Service revenues, covering integration, remote monitoring, and predictive maintenance, further solidify vendor lock-in. As a result, software and services blur, embedding update rights and cyber-security patches into multi-year contracts. This trend rewires profit pools and raises entry barriers for purely hardware-centric challengers within the global robotics market.
The Robotics Market Report is Segmented by Robot Type (Industrial Robots, Service Robots, and More), Component (Hardware, Software, and Services), Application (Manufacturing and Assembly, Logistics and Warehousing, Medical and Surgical, and More), End-User Industry (Automotive, Electronics and Semiconductor, Food and Beverage, and More), and Geography. The Market Forecasts are Provided in Terms of Value (USD).
Geography Analysis
Asia-Pacific secured 37.72% of global robotics market share in 2025, anchored by China's 430,000 annual industrial-robot installations and two-thirds of worldwide robotics patent grants. Chinese factories integrate robots into lithium-ion battery and consumer-electronics lines, while domestic brands escalate exports, embedding regional cost competitiveness into the global robotics market. Japan posted JPY 180.2 billion (USD 1.64 billion) profit at Fanuc in 2024 on revived Chinese demand and domestic demographic pressure. South Korea's USD 2.6 billion public-private programme channels humanoid expertise toward battery-plant automation, underscoring strategic prioritisation.
The Middle East registers the highest 21.31% CAGR to 2031 as sovereign wealth vehicles divert hydrocarbons surplus into industrial digitalisation, logistics, and healthcare robotics. Free-trade zones in the United Arab Emirates trial warehouse AMRs to service regional e-commerce flows, reducing over-reliance on seasonal migrant labour. National programmes additionally fund advanced manufacturing hubs that attract global integrators, amplifying the addressable base for the global robotics market.
North American demand remains resilient, propelled by CHIPS-Act-backed fabs and defence contracts such as the USD 642.2 million Navy counter-drone award to Anduril. Europe focuses on safe human-robot collaboration standards and sustainability targets, helped by EUR 69 million (USD 75 million) in annual German funding for artificial-intelligence integration. Both regions increasingly outsource commodity sub-assemblies to Asia while investing in high-value software and integration, reflecting a barbell strategy within the global robotics market.
- ABB Ltd.
- Fanuc Corporation
- Yaskawa Electric Corporation
- KUKA AG
- Kawasaki Heavy Industries Ltd
- Universal Robots A/S (Teradyne)
- Denso Corporation
- Mitsubishi Electric Corporation
- Omron Corporation
- Staubli International AG
- Epson Robots (Seiko Epson)
- Comau SpA
- Nachi-Fujikoshi Corp.
- Toshiba Corporation
- Intuitive Surgical Inc.
- Stryker Corporation
- iRobot Corporation
- Boston Dynamics Inc.
- Locus Robotics Corp.
- DJI Technology Co. Ltd
Additional Benefits:
- The market estimate (ME) sheet in Excel format
- 3 months of analyst support
TABLE OF CONTENTS
1 INTRODUCTION
- 1.1 Study Assumptions and Market Definition
- 1.2 Scope of the Study
2 RESEARCH METHODOLOGY
3 EXECUTIVE SUMMARY
4 MARKET LANDSCAPE
- 4.1 Market Overview
- 4.2 Market Drivers
- 4.2.1 Rising labour-shortage led automation demand
- 4.2.2 Declining average robot price per functional hour
- 4.2.3 Proliferation of low-code robot-programming platforms
- 4.2.4 Fiscal incentives for reshoring manufacturing in G-7
- 4.2.5 Warehouse AMR roll-outs by e-commerce 3PLs
- 4.2.6 Nation-level humanoid RandD missions (e.g., China 2025)
- 4.3 Market Restraints
- 4.3.1 Persistent SME integration skill-gap
- 4.3.2 Geopolitical export-control on advanced servos
- 4.3.3 Rare-earth magnet price volatility
- 4.3.4 Cyber-security vulnerabilities in ROS deployments
- 4.4 Value Chain Analysis
- 4.5 Regulatory Landscape
- 4.6 Technological Outlook
- 4.7 Porter's Five Forces Analysis
- 4.7.1 Threat of New Entrants
- 4.7.2 Bargaining Power of Suppliers
- 4.7.3 Bargaining Power of Buyers
- 4.7.4 Threat of Substitutes
- 4.7.5 Intensity of Competitive Rivalry
- 4.8 Assessment of Macro Economic Trends on the Market
5 MARKET SIZE AND GROWTH FORECASTS (VALUES)
- 5.1 By Robot Type
- 5.1.1 Industrial Robots
- 5.1.2 Service Robots
- 5.1.3 Collaborative (Cobots)
- 5.1.4 Mobile/AMR
- 5.2 By Component
- 5.2.1 Hardware
- 5.2.2 Software
- 5.2.3 Services (Integration, RaaS)
- 5.3 By Application
- 5.3.1 Manufacturing and Assembly
- 5.3.2 Logistics and Warehousing
- 5.3.3 Medical and Surgical
- 5.3.4 Defense and Security
- 5.3.5 Inspection and Maintenance
- 5.3.6 Cleaning and Sanitation
- 5.4 By End-User Industry
- 5.4.1 Automotive
- 5.4.2 Electronics and Semiconductor
- 5.4.3 Food and Beverage
- 5.4.4 Healthcare Providers
- 5.4.5 Military and Defense
- 5.4.6 Other End-user Industries
- 5.5 By Geography
- 5.5.1 North America
- 5.5.1.1 United States
- 5.5.1.2 Canada
- 5.5.1.3 Mexico
- 5.5.2 Europe
- 5.5.2.1 Germany
- 5.5.2.2 United Kingdom
- 5.5.2.3 France
- 5.5.2.4 Rest of Europe
- 5.5.3 Asia-Pacific
- 5.5.3.1 China
- 5.5.3.2 India
- 5.5.3.3 Japan
- 5.5.3.4 Rest of Asia-Pacific
- 5.5.4 South America
- 5.5.4.1 Brazil
- 5.5.4.2 Argentina
- 5.5.4.3 Rest of South America
- 5.5.5 Middle East
- 5.5.5.1 United Arab Emirates
- 5.5.5.2 Saudi Arabia
- 5.5.5.3 Rest of Middle East
- 5.5.6 Africa
- 5.5.6.1 South Africa
- 5.5.6.2 Nigeria
- 5.5.6.3 Rest of Africa
- 5.5.1 North America
6 COMPETITIVE LANDSCAPE
- 6.1 Market Concentration
- 6.2 Strategic Moves
- 6.3 Market Share Analysis
- 6.4 Company Profiles (includes Global level Overview, Market level overview, Core Segments, Financials as available, Strategic Information, Market Rank/Share for key companies, Products and Services, and Recent Developments)
- 6.4.1 ABB Ltd.
- 6.4.2 Fanuc Corporation
- 6.4.3 Yaskawa Electric Corporation
- 6.4.4 KUKA AG
- 6.4.5 Kawasaki Heavy Industries Ltd
- 6.4.6 Universal Robots A/S (Teradyne)
- 6.4.7 Denso Corporation
- 6.4.8 Mitsubishi Electric Corporation
- 6.4.9 Omron Corporation
- 6.4.10 Staubli International AG
- 6.4.11 Epson Robots (Seiko Epson)
- 6.4.12 Comau SpA
- 6.4.13 Nachi-Fujikoshi Corp.
- 6.4.14 Toshiba Corporation
- 6.4.15 Intuitive Surgical Inc.
- 6.4.16 Stryker Corporation
- 6.4.17 iRobot Corporation
- 6.4.18 Boston Dynamics Inc.
- 6.4.19 Locus Robotics Corp.
- 6.4.20 DJI Technology Co. Ltd
7 MARKET OPPORTUNITIES AND FUTURE OUTLOOK
- 7.1 White-Space and Unmet-Need Assessment
 无线影像传输设备市场:按传输技术、设备类型、应用和最终用户产业划分,全球预测(2026-2032年)
 机器人市场分析及预测(至2035年):类型、产品类型、服务、技术、组件、应用、最终用户、功能、部署类型、设备
 全球烹饪机器人市场规模、份额、趋势和成长分析报告(2026-2034)
 日本製造机器人市场规模、份额、趋势及预测(按组件、类型、最终用户和地区划分),2026-2034年
 2026年全球烹饪机器人市场报告机器人产业涂料及应用技术全球市场报告(2026)
 2025-2029年全球个人与居家照护机器人市场
 机器人市场-全球产业规模、份额、趋势、机会及预测(按组件、类型、应用、垂直产业、地区和竞争格局划分),2021-2031年
 全球机器人市场:依组件、机器人类型、应用、产业和地区划分 - 市场规模、产业动态、机会分析及预测(2026-2035年)日本机器人市场规模、份额、趋势及预测(按产品类型和地区划分,2026-2034年)