


 |
市场调查报告书
商品编码
1906930
压力感测器产业:市场占有率分析、产业趋势与统计、成长预测(2026-2031)Pressure Sensors Industry - Market Share Analysis, Industry Trends & Statistics, Growth Forecasts (2026 - 2031) |
||||||
※ 本网页内容可能与最新版本有所差异。详细情况请与我们联繫。
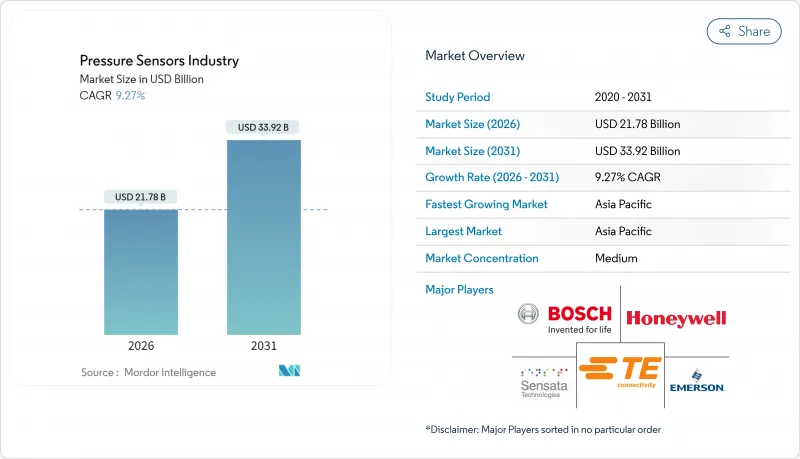
2025年压力感测器市值为199.3亿美元,预计到2031年将达到339.2亿美元,而2026年为217.8亿美元。
预计在预测期(2026-2031 年)内,复合年增长率将达到 9.27%。
强劲的需求源自于电动动力传动系统控制、智慧工厂维修和一次性医疗设备,这些都需要精确的压力监测以确保安全性和效率。亚太地区的电气化政策正在加速xEV电池温度控管系统中高精度气压感测器的应用。同时,欧洲和北美向工业4.0的升级也促使无线节点的普及,以降低安装成本。医疗设备的小型化,尤其是在心血管导管领域,为符合灭菌标准的一次性MEMS设计创造了巨大的机会。此外,在LNG运输船队等严苛环境下的探勘应用,也推动了对能够承受超过175°C製程温度的碳化硅(SiC)和光学技术的高端需求。竞争日趋激烈:现有企业正在边缘整合人工智慧引擎以保护利润率,而中国白牌MEMS代工厂则在扩大生产规模并降低平均售价。
全球压力感测器产业趋势与洞察
xEV动力传动系统控制系统的快速电气化推动了高精度气压感测技术的发展
在电动车领域,精密气压感知器用于检测电池膨胀并进行温度控管,从而避免热失控事件的发生。热失控事件可能导致汽车製造商每辆车损失高达 3000 美元。随着碳化硅驱动逆变器的渗透率预计到 2027 年将达到 50%,感测器供应商正在改进其设计,使其能够承受 175°C 以上的工作温度。中国、日本和韩国的汽车需求最为强劲,这些国家凭藉超级工厂的产能和政府补贴,正加速碳化硅驱动逆变器的普及应用。
智慧工厂维修的扩展将推动对无线感测器节点的需求。
欧洲和北美的製造商正在对现有设备进行改造,加装 LoRaWAN 和 NB-IoT 压力节点,以实现预测性维护。预计到 2030 年,低功耗广域网路连线数将超过 35 亿。例如,WIKA 的仪器生产线在一个自动化单元中整合了超过 10,000 种不同的感测器。在维修计划中,电池供电节点被优先考虑,以避免昂贵的管道工程,这也是无线技术应用年复合成长率 (CAGR) 达到 12.8% 的关键因素。
中国白牌MEMS代工厂平均售价(ASP)下降
儘管像MEMSensing这样的公司预计到2024年营收将成长28.8%至36.85%,但仍持续亏损,这凸显了激进的定价策略正在挤压全球现有企业的利润空间。西方供应商正透过转向高温碳化硅和人工智慧封装技术来应对这一局面。
细分市场分析
到2025年,有线设备仍将占总收入的71.32%,这主要得益于引擎控制单元和手术室等高耗电环境中确定性资料传输的需求。然而,随着工厂采用工业4.0,无线节点将以12.61%的复合年增长率超越有线设备。智慧控制改造套件可将安装成本降低40%,并支援压力容器的预测性停机维护。乙太网路供电(PoE)升级透过将电源和资料復用到单一线路上,保持了有线感测器的效用。无线节点利用能源采集和边缘运算技术,使其能够安装在以前无法触及的位置,例如旋转轴和密封腔室。
到2025年,绝对压力式感测器将占据45.58%的市场份额,这主要得益于歧管压力、气象记录和无人机高度测量等对真空参考测量的需求。差压式感测器的年复合成长率将达到10.23%,主要成长动力来自暖通空调维修和无尘室过滤监测。近年来,湿式蚀刻蚀硅製造技术的进步显着提升了感测器的灵敏度(5.07 mV/V/MPa)和线性度(0.67% FS)。压力表仍是液压系统中的关键装置,但其成长率较为温和,仅为个位数。
区域分析
亚太地区以35.62%的市占率主导,主要归功于中国的MEMS晶圆厂和印度强制实施的胎压监测系统(TPMS)。国家高速公路网络的扩张和5293个电动车充电站的建设正在推动每辆车感测器数量的成长。本土製造商正在缩小技术差距,主要厂商指出,国内供应商正在将人工智慧整合到其汽车感知系统中。欧洲凭藉其工业自动化传统优势,英飞凌投资50亿欧元的德勒斯登智慧功率工厂代表了其在半导体领域的战略自主性。北美在航太和医疗领域表现卓越,DARPA资助的研究推动了感测技术的尖端发展。中东和非洲的复合年增长率(CAGR)最高,达到12.08%,这主要得益于液化天然气(LNG)计划对海底仪器的需求,以及智慧城市基础设施为无线部署提供的基础。
其他福利:
- Excel格式的市场预测(ME)表
- 分析师支持(3个月)
目录
第一章 引言
- 研究假设和市场定义
- 调查范围
第二章调查方法
第三章执行摘要
第四章 市场情势
- 市场概览
- 市场驱动因素
- xEV动力传动系统控制系统的快速电气化推动了高精度气压感测技术的发展(亚洲)
- 智慧工厂维修的扩展将推动对无线感测器节点的需求(欧洲和北美)。
- 印度和东协掀起摩托车强制安装胎压监测装置的浪潮
- 加速部署5G毫米波无线技术需要精确的热机械压力控制。
- 门诊循环系统诊所采用一次性MEMS压力导管(美国)
- LNG装运船隻的增加推动了对用于恶劣环境(中东)的海底压力测量设备的需求。
- 市场限制
- 中国白牌MEMS代工厂平均售价(ASP)下降
- 无线通讯协定环境碎片化推高了整合成本。
- 人们担心在温度超过 175°C 的生产线上使用光压晶片的可靠性
- 大压电压阻晶片短缺影响供应链
- 价值/供应链分析
- 监理与技术展望
- 波特五力分析
- 供应商的议价能力
- 买方的议价能力
- 新进入者的威胁
- 替代品的威胁
- 竞争对手之间的竞争
- 宏观趋势如何影响市场
- 投资分析
第五章 市场规模与成长预测
- 依感测器类型
- 有线
- 无线的
- 依产品类型
- 绝对
- 不同之处
- 测量
- 透过技术
- 压电元件
- 电磁学
- 电容式
- 共振固体
- 光学
- 其他压力感测器
- 透过使用
- 车
- 医疗保健
- 家用电子电器
- 产业
- 航太/国防
- 食品/饮料
- HVAC
- 按地区
- 北美洲
- 美国
- 加拿大
- 墨西哥
- 欧洲
- 英国
- 德国
- 法国
- 义大利
- 其他欧洲地区
- 亚太地区
- 中国
- 日本
- 印度
- 韩国
- 亚太其他地区
- 中东
- 以色列
- 沙乌地阿拉伯
- 阿拉伯聯合大公国
- 土耳其
- 其他中东地区
- 非洲
- 南非
- 埃及
- 其他非洲地区
- 南美洲
- 巴西
- 阿根廷
- 南美洲其他地区
- 北美洲
第六章 竞争情势
- 市场集中度
- 策略趋势
- 市占率分析
- 公司简介
- ABB Ltd
- All Sensors Corporation
- Bosch Sensortec GmbH
- Endress+Hauser AG
- TE Connectivity
- Honeywell International Inc.
- Schneider Electric SE
- Kistler Group
- Rockwell Automation Inc.
- Emerson Electric Co.
- Sensata Technologies Inc.
- Siemens AG
- Yokogawa Electric Corp.
- Infineon Technologies AG
- STMicroelectronics NV
- Sensirion AG
- NXP Semiconductors NV
- Texas Instruments Inc.
- Omron Corporation
- Murata Manufacturing Co., Ltd.
- Amphenol(SSI Technologies)
- BD Sensors GmbH
- Keller AG fur Druckmesstechnik
第七章 市场机会与未来展望
The pressure sensors market was valued at USD 19.93 billion in 2025 and estimated to grow from USD 21.78 billion in 2026 to reach USD 33.92 billion by 2031, at a CAGR of 9.27% during the forecast period (2026-2031).
Strong demand stems from electrified power-train control, smart-factory retrofits, and disposable medical devices that require precise pressure monitoring for safety and efficiency. Electrification mandates in Asia-Pacific are accelerating adoption of high-accuracy barometric sensors in xEV battery-thermal systems, while Industry 4.0 upgrades across Europe and North America favor wireless nodes that cut installation cost. Medical device miniaturization, especially in cardiovascular catheters, is opening a sizeable opportunity for single-use MEMS designs that meet sterilization standards. At the same time, harsh-environment exploration-such as LNG carrier fleets-creates premium demand for silicon-carbide and optical technologies capable of surviving >175 °C process lines. Competitive intensity is rising: incumbents embed AI engines at the edge to defend margins, whereas Chinese white-label MEMS foundries scale volume and depress average selling prices.
Global Pressure Sensors Industry Trends and Insights
Rapid electrification of xEV power-train control systems driving high-accuracy barometric sensing
Electric vehicles use precision barometric sensors to detect cell swelling and manage heat, avoiding thermal runaway events that can cost OEMs up to USD 3,000 per vehicle. Sensor suppliers are hardening designs for >175 °C operation because silicon-carbide traction inverters will reach 50% penetration by 2027. Automotive demand is strongest in China, Japan, and South Korea where gigafactory capacity and government subsidies intersect to accelerate adoption.
Expansion of smart-factory retrofits boosting wireless sensor node demand
European and North American manufacturers are layering LoRaWAN and NB-IoT pressure nodes onto legacy equipment to enable predictive maintenance; low-power wide-area connections are forecast to exceed 3.5 billion by 2030. Assembly lines such as WIKA's gauge facility now incorporate more than 10,000 sensor variants in a single automated cell. Retrofit projects prioritize battery-powered nodes to avoid expensive conduit runs, a key factor behind the 12.8% CAGR in wireless uptake.
ASP erosion from Chinese white-label MEMS foundries
Firms such as MEMSensing posted 28.8%-36.85% revenue growth in 2024 while still running at a loss, underscoring aggressive pricing tactics that compress margins for global incumbents. Western vendors answer by pivoting toward high-temperature silicon-carbide and AI-enabled packages.
Other drivers and restraints analyzed in the detailed report include:
- Mandatory tyre-pressure monitoring adoption waves in India & ASEAN two-wheelers
- Accelerated rollout of 5G mmWave radios requiring precision thermo-mechanical pressure control
- Fragmented wireless protocol landscape inflating integration cost
For complete list of drivers and restraints, kindly check the Table Of Contents.
Segment Analysis
Wired devices retained 71.32% revenue in 2025 due to deterministic data delivery in power-rich settings such as engine control units and surgical theaters. However, wireless nodes will outpace with a 12.61% CAGR as factories retrofit to Industry 4.0. Smart Control retrofit kits cut installation expense by 40% while enabling predictive shutdowns for pressure vessels. Power-over-Ethernet upgrades are keeping wired sensors relevant by multiplexing power and data on a single line. Wireless nodes leverage energy harvesting and edge compute, allowing placement on rotating shafts or sealed chambers once considered unreachable.
Absolute designs held 45.58% share in 2025 because manifold pressure, weather logging, and drone altimetry require vacuum-referenced readings. Differential units will see a 10.23% CAGR thanks to HVAC retrofits and filtration monitoring in cleanrooms. Recent wet-etch silicon fabrication pushed sensitivity to 5.07 mV/V/MPa with 0.67% FS linearity. Gauge units remain staple devices in hydraulics but exhibit only mid-single-digit growth.
The Pressure Sensors Market Report is Segmented by Type of Sensor (Wired, Wireless), Product Type (Absolute, Differential, Gauge), Technology (Piezoresistive, Electromagnetic, Optical, Capacitive, Resonant Solid-State, and More), Application (Automotive, Medical, Industrial, Aerospace and Defense, HVAC, and More), and Geography. The Market Forecasts are Provided in Terms of Value (USD).
Geography Analysis
Asia-Pacific's 35.62% leadership stems from China's MEMS fabs and India's TPMS mandates. The National Highways expansion and 5,293 EV charging stations catalyze sensor content per vehicle. Local producers are closing the technology gap; Major players notes domestic suppliers are integrating AI into automotive perception stacks. Europe leverages its industrial automation heritage; Infineon's EUR 5 billion Dresden Smart Power Fab underscores strategic semiconductor self-reliance. North America excels in aerospace and medical segments, with DARPA-funded research pushing sensing frontiers. The Middle East & Africa posts the fastest 12.08% CAGR on LNG projects needing subsea instrumentation, complemented by smart-city infrastructure that seeds wireless deployments.
- ABB Ltd
- All Sensors Corporation
- Bosch Sensortec GmbH
- Endress+Hauser AG
- TE Connectivity
- Honeywell International Inc.
- Schneider Electric SE
- Kistler Group
- Rockwell Automation Inc.
- Emerson Electric Co.
- Sensata Technologies Inc.
- Siemens AG
- Yokogawa Electric Corp.
- Infineon Technologies AG
- STMicroelectronics N.V.
- Sensirion AG
- NXP Semiconductors N.V.
- Texas Instruments Inc.
- Omron Corporation
- Murata Manufacturing Co., Ltd.
- Amphenol (S S I Technologies)
- BD Sensors GmbH
- Keller AG fur Druckmesstechnik
Additional Benefits:
- The market estimate (ME) sheet in Excel format
- 3 months of analyst support
TABLE OF CONTENTS
1 INTRODUCTION
- 1.1 Study Assumptions and Market Definition
- 1.2 Scope of the Study
2 RESEARCH METHODOLOGY
3 EXECUTIVE SUMMARY
4 MARKET LANDSCAPE
- 4.1 Market Overview
- 4.2 Market Drivers
- 4.2.1 Rapid electrification of xEV power-train control systems driving high-accuracy barometric sensing (Asia)
- 4.2.2 Expansion of smart factory retrofits boosting wireless sensor node demand (Europe and NA)
- 4.2.3 Mandatory tyre-pressure monitoring adoption waves in India and ASEAN two-wheelers
- 4.2.4 Accelerated rollout of 5G mmWave radios requiring precision thermo-mechanical pressure control
- 4.2.5 Adoption of disposable MEMS pressure catheters in outpatient cardiovascular clinics (US)
- 4.2.6 LNG carrier fleet build-up elevating harsh-environment subsea pressure instrumentation (Middle East)
- 4.3 Market Restraints
- 4.3.1 ASP erosion from Chinese white-label MEMS foundries
- 4.3.2 Fragmented wireless protocol landscape inflating integration cost
- 4.3.3 Reliability concerns in optical pressure chips beyond 175 degree C process lines
- 4.3.4 Supply-chain exposure to bulk piezoresistive wafer shortages
- 4.4 Value / Supply-Chain Analysis
- 4.5 Regulatory and Technological Outlook
- 4.6 Porter's Five Forces Analysis
- 4.6.1 Bargaining Power of Suppliers
- 4.6.2 Bargaining Power of Buyers
- 4.6.3 Threat of New Entrants
- 4.6.4 Threat of Substitutes
- 4.6.5 Intensity of Competitive Rivalry
- 4.7 Impact of Macro Trends on the Market
- 4.8 Investment Analysis
5 MARKET SIZE AND GROWTH FORECASTS (VALUE)
- 5.1 By Type of Sensor
- 5.1.1 Wired
- 5.1.2 Wireless
- 5.2 By Product Type
- 5.2.1 Absolute
- 5.2.2 Differential
- 5.2.3 Gauge
- 5.3 By Technology
- 5.3.1 Piezoresistive
- 5.3.2 Electromagnetic
- 5.3.3 Capacitive
- 5.3.4 Resonant Solid-State
- 5.3.5 Optical
- 5.3.6 Other Pressure Sensors
- 5.4 By Application
- 5.4.1 Automotive
- 5.4.2 Medical
- 5.4.3 Consumer Electronics
- 5.4.4 Industrial
- 5.4.5 Aerospace and Defense
- 5.4.6 Food and Beverage
- 5.4.7 HVAC
- 5.5 By Geography
- 5.5.1 North America
- 5.5.1.1 United States
- 5.5.1.2 Canada
- 5.5.1.3 Mexico
- 5.5.2 Europe
- 5.5.2.1 United Kingdom
- 5.5.2.2 Germany
- 5.5.2.3 France
- 5.5.2.4 Italy
- 5.5.2.5 Rest of Europe
- 5.5.3 Asia-Pacific
- 5.5.3.1 China
- 5.5.3.2 Japan
- 5.5.3.3 India
- 5.5.3.4 South Korea
- 5.5.3.5 Rest of Asia-Pacific
- 5.5.4 Middle East
- 5.5.4.1 Israel
- 5.5.4.2 Saudi Arabia
- 5.5.4.3 United Arab Emirates
- 5.5.4.4 Turkey
- 5.5.4.5 Rest of Middle East
- 5.5.5 Africa
- 5.5.5.1 South Africa
- 5.5.5.2 Egypt
- 5.5.5.3 Rest of Africa
- 5.5.6 South America
- 5.5.6.1 Brazil
- 5.5.6.2 Argentina
- 5.5.6.3 Rest of South America
- 5.5.1 North America
6 COMPETITIVE LANDSCAPE
- 6.1 Market Concentration
- 6.2 Strategic Moves
- 6.3 Market Share Analysis
- 6.4 Company Profiles (includes Global- and Market-level Overview, Core Segments, Financials, Strategic Information, Market Rank/Share, Products and Services, Recent Developments)
- 6.4.1 ABB Ltd
- 6.4.2 All Sensors Corporation
- 6.4.3 Bosch Sensortec GmbH
- 6.4.4 Endress+Hauser AG
- 6.4.5 TE Connectivity
- 6.4.6 Honeywell International Inc.
- 6.4.7 Schneider Electric SE
- 6.4.8 Kistler Group
- 6.4.9 Rockwell Automation Inc.
- 6.4.10 Emerson Electric Co.
- 6.4.11 Sensata Technologies Inc.
- 6.4.12 Siemens AG
- 6.4.13 Yokogawa Electric Corp.
- 6.4.14 Infineon Technologies AG
- 6.4.15 STMicroelectronics N.V.
- 6.4.16 Sensirion AG
- 6.4.17 NXP Semiconductors N.V.
- 6.4.18 Texas Instruments Inc.
- 6.4.19 Omron Corporation
- 6.4.20 Murata Manufacturing Co., Ltd.
- 6.4.21 Amphenol (S S I Technologies)
- 6.4.22 BD Sensors GmbH
- 6.4.23 Keller AG fur Druckmesstechnik
7 MARKET OPPORTUNITIES AND FUTURE OUTLOOK
- 7.1 White-space and Unmet-Need Assessment
 压力感测器市场分析及预测(至2035年):依类型、产品类型、技术、应用、材质、最终用户、组件、安装类型及功能划分
 全球压力感测器市场规模、份额、趋势和成长分析报告(2026-2034年)
 全球压力感测器市场:产业分析、市场规模、份额及预测(按产品、类型、技术、应用、国家和地区划分)(2025-2032 年)
 2026年全球压力感测器市场报告2026年全球流体压力感测器市场报告
 压力感测器市场 - 全球产业规模、份额、趋势、机会及预测(按感测器类型、产品类型、技术、应用、地区和竞争格局划分,2021-2031年)
 压阻式压力感测器市场按压力类型、输出讯号、安装类型、膜片材料和最终用户划分,全球预测(2026-2032年)蓝宝石硅压力感测器技术市场:依产品类型、技术、终端用户产业及通路划分,全球预测(2026-2032年)压力感测器市场规模、占有率、成长及全球产业分析:按类型、应用和地区划分的洞察与预测(2026-2034)
 真空感测器市场规模、份额、成长分析(按类型、真空度、应用、最终用户和地区划分)-2026-2033年产业预测